ERA-Interim
Using a much improved atmospheric model and assimilation system from those used in ERA-40, ERA-Interim represents a third generation reanalysis. Several of the inaccuracies exhibited by ERA-40 such as too-strong precipitation over oceans from the early 1990's onwards and a too-strong Brewer-Dobson circulation in the stratosphere, were eliminated or significantly reduced. ERA-Interim now extends back to 1979 and the analysis is expected to be continued forward until the end of 2018.
The successor to ERA-Interim, ERA5, is available back to 1979 as of January, 2019. It provides hourly estimates of atmospheric variables, a horizontal resolution of 31 km and 137 vertical levels from the surface to 0.01 hPa. ERA5 will ultimately be extended back to 1950.
Key Strengths
Spatially and temporally complete data set of multiple variables at high spatial and temporal resolution
Improved low-frequency variability (compared to ERA-40)
Improved stratospheric circulation (compared to ERA-40)
Key Limitations
Too intense of a water cycling (precipitation, evaporation) over the oceans
In the Arctic: positive biases in temperature and humidity below 850hPA compared to radiosondes; does not capture low-level inversions
Research, education and commercial. See http://data-portal.ecmwf.int/data/d/license/interim_full
Expert Developer Guidance
The following was contributed by Dick Dee (ECMWF), March, 2012 (some of this has been excerpted and placed on the reanalysis overview page):
#Reanalysis data sets in general
Key strengths:
- The data are multivariate, spatially and temporally complete, and gridded
- The data combine information from many sources (observations and models)
- The data set is physically and dynamically coherent, according to the models used
Key weaknesses:
- Changes in the observing system can cause changes in mean errors
- Mixing observations with models tends to violate conservation properties
- Uncertainties in the reanalysis data are difficult to understand and quantify
ERA-Interim
Progress (relative to ERA-40) was made in the following areas:
- The reanalysis continues in near-real time
- Low-frequency variability is much better
- Analysis accuracy has improved
- The hydrological cycle has improved
- The quality of the stratospheric circulation is better
Specific problems in ERA-Interim
A list of known quality issues with ERA-Interim is maintained by the producers at http://www.ecmwf.int/research/era/do/get/index/QualityIssues. These include the following spurious shifts in ERA-Interim time series related to changes in the observing system:
- Shifts in precipitation (especially over tropical oceans) during the period January 1992 - December 2009, due to the assimilation of rain-affected radiances from SSM/I. See Section 5.2.1 in Dee et al. 2011 for details.
- A discontinuity in upper-stratospheric temperatures (at levels 5hPa and higher) associated with the introduction of radiance data from AMSU-A in August 1998. See Section 8 in Dee and Uppala 2008 for details.
- Warming of the lower stratosphere by approximately 0.2K in December 2006, with the introduction of GPS radio occultation data from the COSMIC constellation, which partly corrects an otherwise unconstrained cold bias in the assimilating model. See Poli et al. 2010.
- Slight excess warming of upper-tropospheric temperatures due to the assimilation of growing numbers of warm-biased temperature measurements from aircraft, beginning in 1999 (Dee and Uppala 2009). After December 2006, this drift is somewhat reduced with the introduction of GPS radio occultation data from the COSMIC constellation (Poli et al. 2010).
- The homogeneity of the ozone time series is affected by the availability of observations from different satellite ozone instruments, which fluctuates over time. See Section 4.5.1 in Dee et al. 2011.
In addition, the ERA-Interim snow analyses from 1 July 2003 to 23 February 2010 are affected by a geo-location error introduced during the processing of NESDIS snow cover data. Data locations were shifted by about 100km toward the South-East, causing incorrect removal of snow in some coastal areas in the Northern Hemisphere during winter.
Assessing the quality of reanalysis data
Please visit http://www.ecmwf.int/research/era for up-to-date information about ERA-Interim production, data availability, quality issues, documentation, etc.
Reanalysis data are often used to represent the "true state of the atmosphere according to observations." In actual fact, reanalysis combines inaccurate and incomplete observations with imperfect models, using methods and procedures that are technically and scientifically complex. Limitations and caveats of reanalysis data mainly result from:
- Lack of observations. The atmosphere is not now, nor ever has been, fully observed.
- Errors in the observations, and lack of information about those errors.
- Shortcomings in the assimilating model, and lack of information about model errors.
- Shortcomings in data assimilation methodology.
- Technical errors and mistakes.
- Computational limitations (e.g. limitations in spatial and temporal resolution)
Several of these items have to do with a lack of information. They represent fundamental limitations that are not restricted to reanalysis but play a role in any observational data set. (Note: replacing a skillfull forecast model by straightforward spatial interpolation does not solve anything - it is tantamount to removing, not adding, information).
To assess uncertainties in specific variables produced by reanalysis requires answering the following questions:
- How strongly is the variable constrained by observations? Is it directly or indirectly observed?
- What is the spatial and temporal distribution of the observations? How does this change in time?
- How accurately can the model represent the variable? Does the model have skill in extrapolating and/or predicting it?
Users interested in the quality of low-frequency variability and/or trend estimates need to consider these aspects throughout the time period in question. Temporal variation in the observational constraint can produce artificial shifts in the reanalysis time series, especially if the assimilating model has systematic errors. See Section 8 in Dee and Uppala (2008) for a stratospheric example of this problem.
Given the continuous changes in the observing system, and the fact that all models have some systematic errors, users should be cautious when using reanalysis data for climate studies. It is necessary (but not always possible) to verify trend estimates by comparing with independent data sets, e.g. as in Simmons et al (2010).
Most users do not have access to the information needed to answer the difficult questions listed above. On the other hand, producers of reanalysis data do not have the resources (nor the application-specific knowledge) to answer them either. The challenge is to provide better tools and information to support users in making their own uncertainty assessments. In particular, it should be made much easier for a user to get detailed information about the observations used in reanalysis, including the quality assessment and bias adjustments produced by the reanalysis process itself.#
Cite this page
Acknowledgement of any material taken from or knowledge gained from this page is appreciated:
Dee, Dick & National Center for Atmospheric Research Staff (Eds). Last modified "The Climate Data Guide: ERA-Interim.” Retrieved from https://climatedataguide.ucar.edu/climate-data/era-interim on 2026-02-07.
Citation of datasets is separate and should be done according to the data providers' instructions. If known to us, data citation instructions are given in the Data Access section, above.
Acknowledgement of the Climate Data Guide project is also appreciated:
Schneider, D. P., C. Deser, J. Fasullo, and K. E. Trenberth, 2013: Climate Data Guide Spurs Discovery and Understanding. Eos Trans. AGU, 94, 121–122, https://doi.org/10.1002/2013eo130001
Key Figures

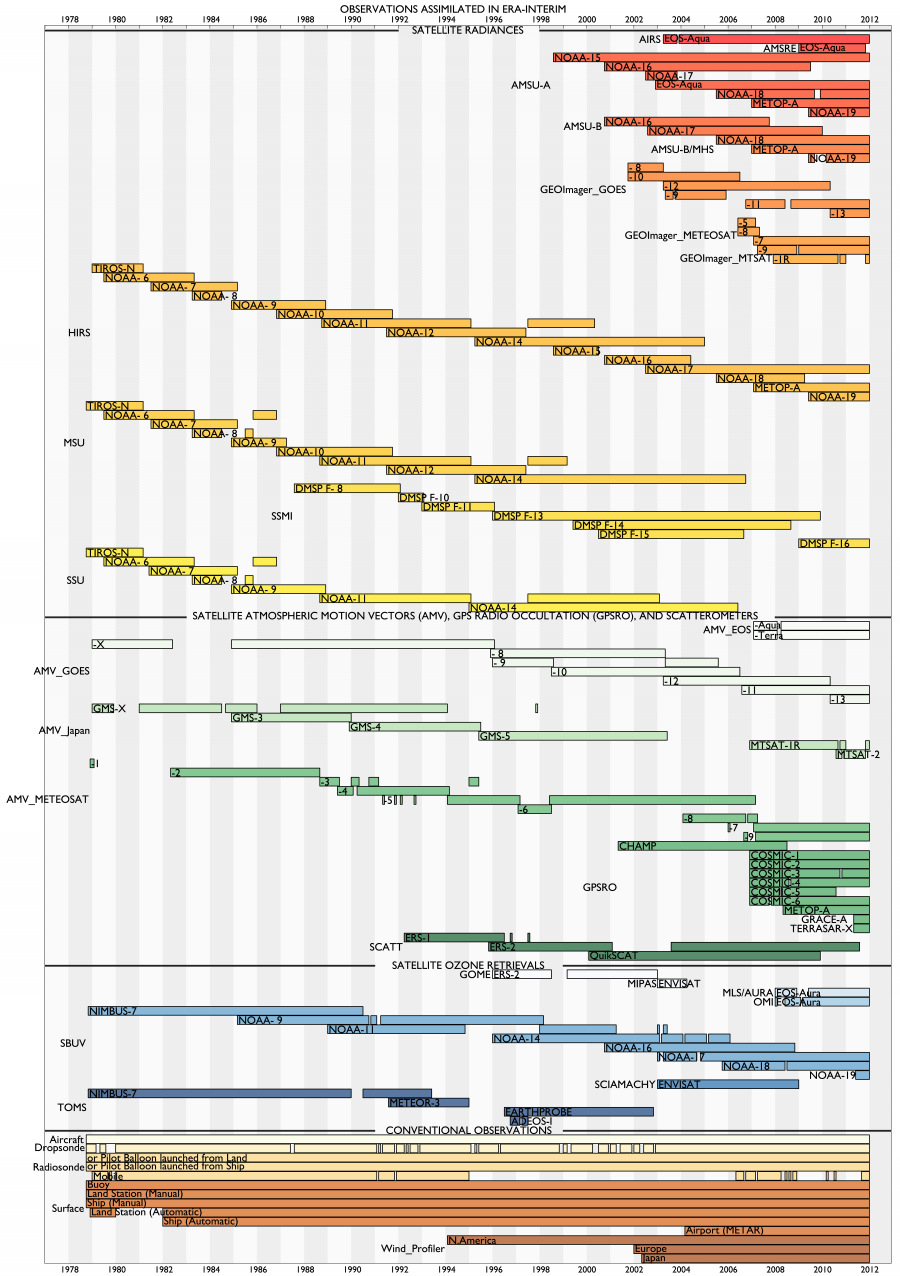
A timeline of the complete observing system used in ERA-Interim. Figure produced by Paul Poli. (Contributed by D. Dee)
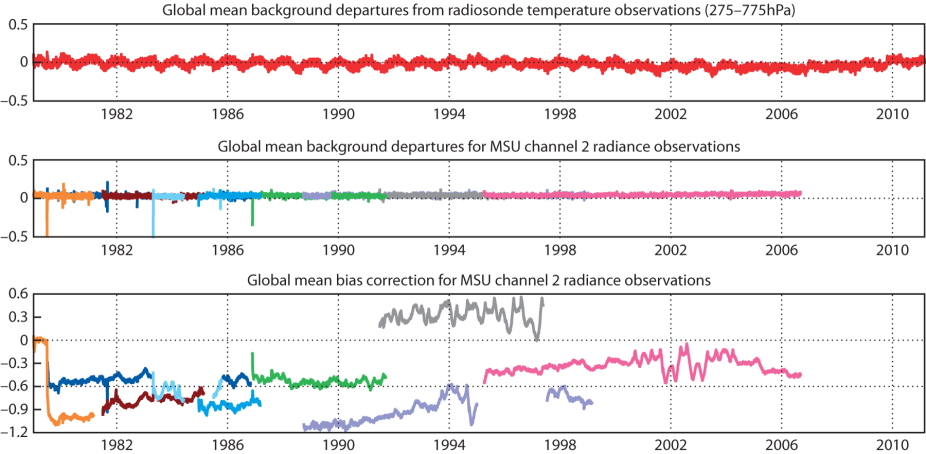
Globally averaged departures of ERA-Interim tropospheric temperatures relative to radiosonde observations (top) and radiance data from MSU channel 2 (center). The bottom panel shows globally averaged bias adjustments for the MSU channel 2 radiances, computed during the reanalysis using a variational bias correction scheme. DIfferent colors correspond to different satellites. (contributed by D. Dee)
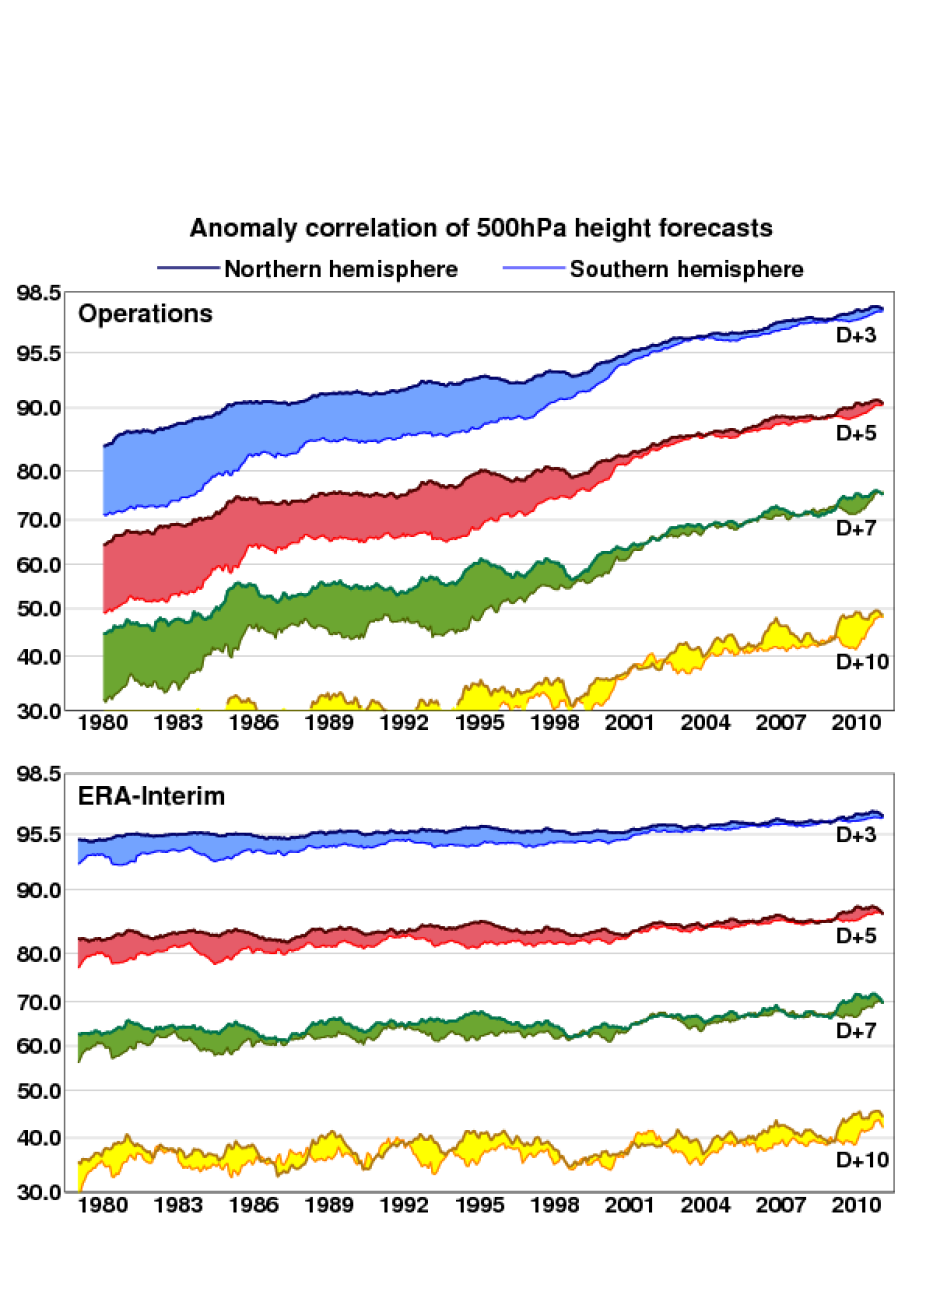
Evolution of skill in ECMWF operational forecasts (top panel) and in re-forecasts produced by the ERA-Interim system (bottom panel). Colored plumes show anomaly correlations for 3-day, 5-day,7-day and 10-day forecasts of 500hPa geopotential height, averaged for the northern and southern hemispheres. Comparing the top and the bottom panels helps separate the effect of changes in the observing system. Figure produced by Adrian Simmons. (Contributed by D. Dee)