IBTrACS: Tropical cyclone best track data

IBTrACS (International Best Track Archive for Climate Stewardship) provides global tropical cyclone best track data in a centralized location to aid our understanding of the distribution, frequency, and intensity of tropical cyclones worldwide. The World Meteorological Organization Tropical Cyclone Programme has endorsed IBTrACS as an official archiving and distribution resource for tropical cyclone best track data. The data are available in many formats. The IBTrACS-WMO version of the data set uses data from the WMO-sanctioned RSMC/TCWC in each basin.
Key Strengths
Key Limitations
Please reference Knapp et al 2010 when using IBTrACS data in any publication. Knapp, K. R., M. C. Kruk, D. H. Levinson, H. J. Diamond, and C. J. Neumann, 2010: The International Best Track Archive for Climate Stewardship (IBTrACS): Unifying tropical cyclone best track data. Bulletin of the American Meteor. Society, 91, 363-376. doi:10.1175/2009BAMS2755.1
Expert User Guidance
IBTrACS-ALL has data from over a dozen different sources that sometimes give 4 or more answers for the same storm. That's good for someone who is interested in the problems between agencies, but it confuses a lot of users. The WMO dataset just uses data from the WMO-sanctioned RSMC/TCWC in each basin, so it's one answer per storm. Carl Schreck, CICS-NC, 10 Feb 2012
Cite this page
Acknowledgement of any material taken from or knowledge gained from this page is appreciated:
Schreck, Carl & National Center for Atmospheric Research Staff (Eds). Last modified "The Climate Data Guide: IBTrACS: Tropical cyclone best track data.” Retrieved from https://climatedataguide.ucar.edu/climate-data/ibtracs-tropical-cyclone-best-track-data on 2026-02-07.
Citation of datasets is separate and should be done according to the data providers' instructions. If known to us, data citation instructions are given in the Data Access section, above.
Acknowledgement of the Climate Data Guide project is also appreciated:
Schneider, D. P., C. Deser, J. Fasullo, and K. E. Trenberth, 2013: Climate Data Guide Spurs Discovery and Understanding. Eos Trans. AGU, 94, 121–122, https://doi.org/10.1002/2013eo130001
Key Figures
Time series of the various NAO and NAM indices. They are highly correlated.
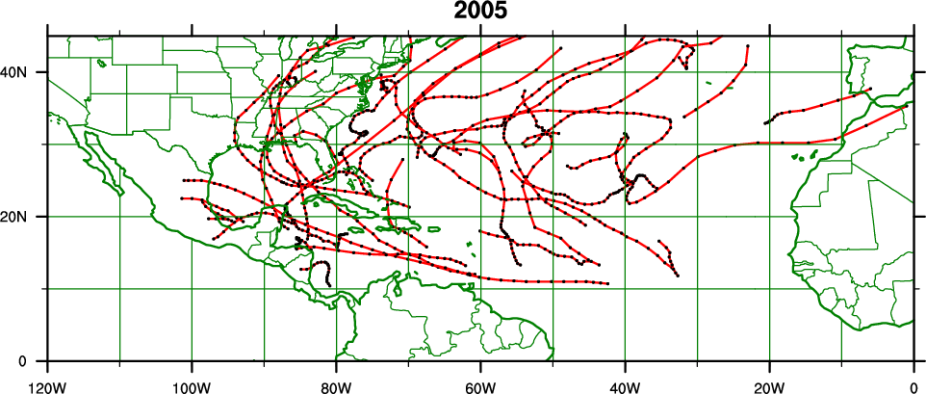
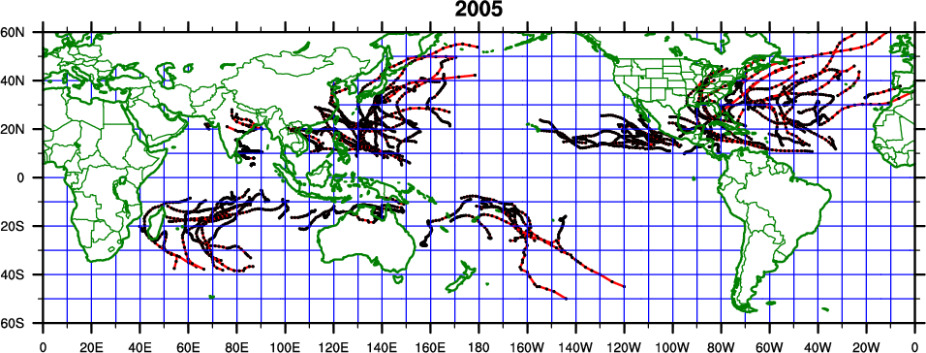
Tropical storm and hurricane tracks (120W-GM) in 2005. Contributed by Carl Schreck (CICS-NC, NOAA-NCDC).
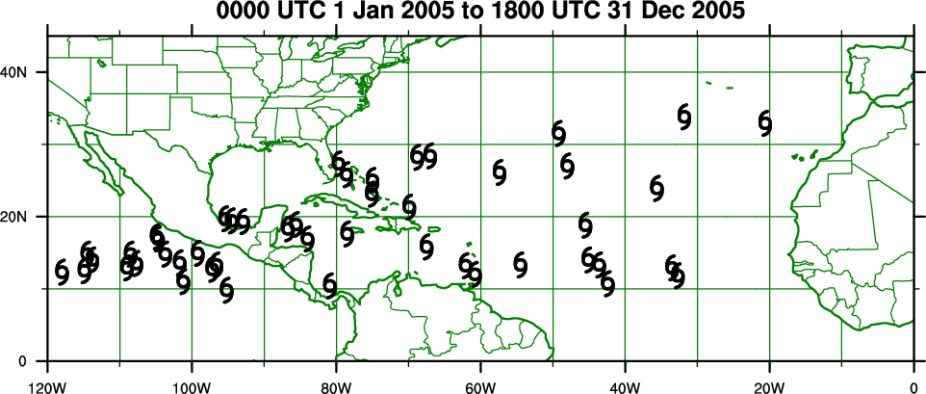
Initial locations for all tropical cyclones (120W-GM) in 2005. Contributed by Carl Schreck (CICS-NC, NOAA-NCDC).
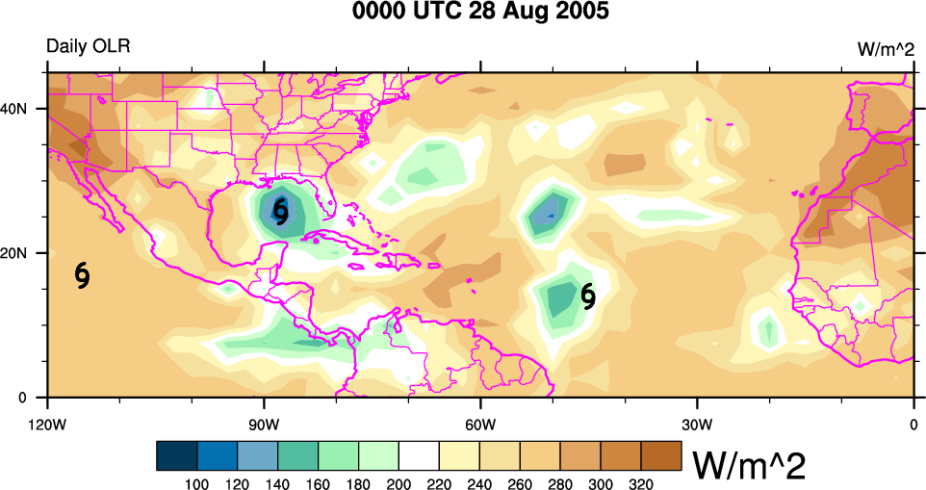
Outgoing longwave radiation (OLR) for 28 August 2005. From left to right, hurricane symbols denote the locations of Tropical Storm Irwin, Hurricane Katrina, and Tropical Storm Lee. Contributed by Carl Schreck (CICS-NC, NOAA-NCDC).
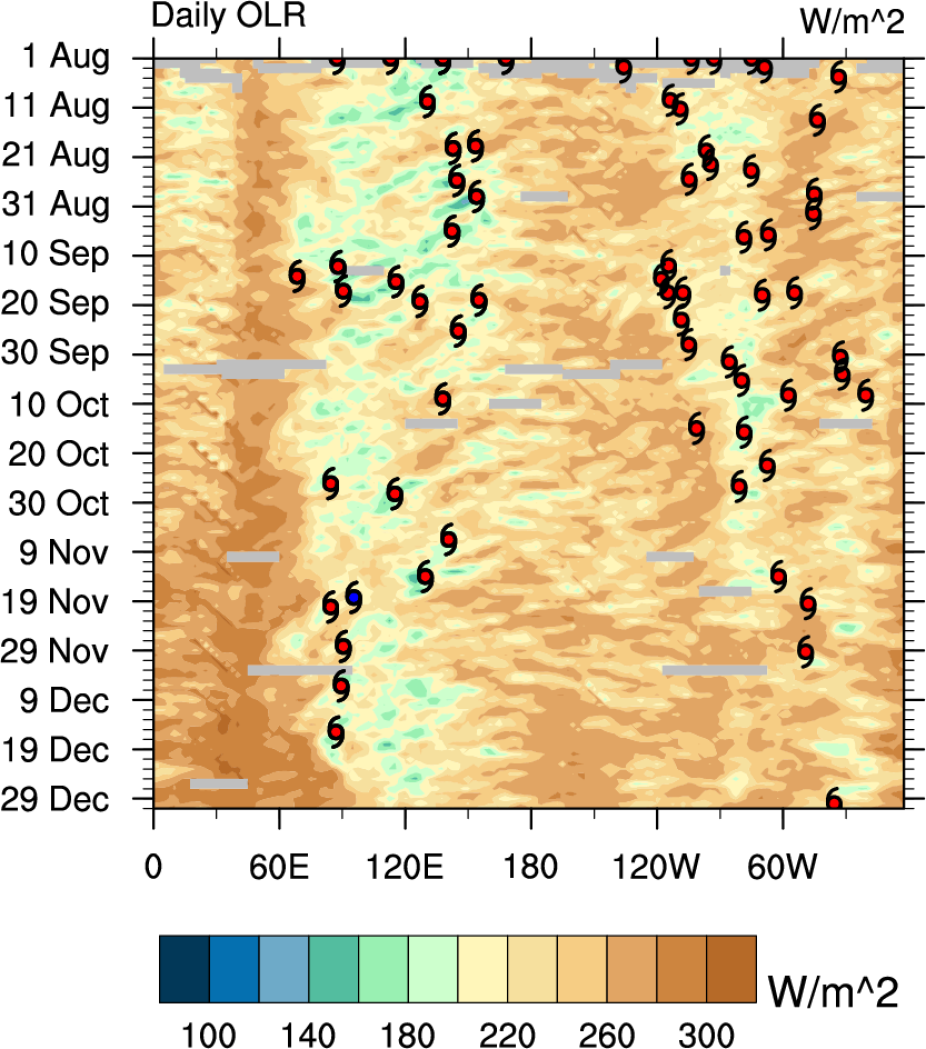
Longitude–time Hovmöller of outgoing longwave radiation (OLR) averaged 2.5N–17.5N. Hurricane symbols denote the genesis locations of all tropical cyclones. Red-filled symbols are Northern Hemisphere storms, while Southern Hemisphere storms are filled with Blue. Contributed by Carl Schreck (CICS-NC, NOAA-NCDC).
Other Information
- Knapp, K. R., M. C. Kruk, D. H. Levinson, H. J. Diamond, and C. J. Neumann, 2010: The International Best Track Archive for Climate Stewardship (IBTrACS): Unifying tropical cyclone best track data.
- Levinson, D. H., H. J. Diamond, K. R. Knapp, M. C. Kruk, and E. J. Gibney, 2010: Toward a homogenous global tropical cyclone best track dataset
- Kruk, M. C., K. R. Knapp, and D. H. Levinson, 2010: A technique for merging global tropical cyclone best track data.