Updates
Recently updated content
 CAM6+DART Reanalysis and Surface Forcings
Years of record
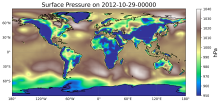
The CAM6+DART (Community Atmospheric Model version 6 + Data Assimilation Research Testbed) Reanalysis is an 80-member global atmospheric reanalysis with 6 hourly output from 2011-2020 on an approximately 1° lon-lat grid. This ensemble has two major features making it…
-
Formats
-
Timestep
- Sub-daily, Weekly
-
Domain
- Global
-
Collections
- Boundary Conditions
Experts contributing reviews
- Raeder, Kevin
 SST data: HadSST4
Years of record
- to
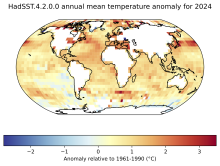
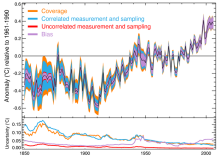
HadSST4 provides monthly SST anomalies on a 5°x5° grid for 1850-present. The anomalies are derived from a 30-year climatology spanning 1961-90. Coverage is global but there is no interpolation; Thus, missing data occur in the final product. This means that uncertainties…
-
Formats
- netCDF
-
Timestep
- Monthly
-
Domain
- Global
-
Collections
- Diagnostic Data Sets
Experts contributing reviews
- Kennedy, John, Sandford, Caroline
 SST data: HadSST3
Years of record
- to
Note: HadSST3 has been superseded by HadSST4. HadSST3 provides monthly SST anomalies on a 5°x5° grid for 1850-present. The anomalies are derived from a 30-year climatology spanning 1961-90.Coverage is global but there is no interpolation; Thus, missing data occur in the…
-
Timestep
- Monthly
-
Domain
- Global
Experts contributing reviews
- Kennedy, John
 Argo Ocean Temperature and Salinity Profiles
Years of record
- to
Argo is an array of over 4100 profiling floats distributed almost uniformly across the global oceans. First deployed in 2000, Argo floats provide temperature and salinity profiles from the surface to a depth of 2000m. The array has approximately 1 float for…
Main variables and Earth System components
Ocean Salinity Sub Surface Salinity Sub Surface TemperatureExperts contributing reviews
- Scanderbeg, Megan, Purkey, Sarah, Willis, Josh
 North Pacific (NP) Index by Trenberth and Hurrell; monthly and winter
Years of record
- to
The North Pacific Index (NP index or NPI) is the area-weighted sea level pressure over the region 30°N-65°N, 160°E-140°W. The NP index is defined to measure interannual to decadal variations in the atmospheric circulation. The dominant atmosphere-ocean relation in the…
-
Formats
- ascii
-
Timestep
- Monthly, Seasonal
-
Collections
- Climate Analysis Section (CAS) Data Catalog
Experts contributing reviews
- Hurrell, James, Phillips, Adam
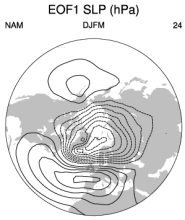 Hurrell wintertime SLP-based Northern Annular Mode (NAM) Index
Years of record
- to
The NAM (or Arctic Oscillation) is defined as the first EOF of NH (20°-90°N) winter SLP data. It explains 23% of the extended winter mean (December-March) variance, and it is clearly dominated by the NAO structure in the Atlantic sector. Although there are some subtle…
-
Formats
- ascii
-
Timestep
- Seasonal
-
Collections
Experts contributing reviews
- Phillips, Adam
 Hurrell North Atlantic Oscillation (NAO) Index (PC-based)
Years of record
- to
The principal component (PC)-based indices of the North Atlantic Oscillation (NAO) are the time series of the leading Empirical Orthogonal Function (EOF) of SLP anomalies over the Atlantic sector, 20°-80°N, 90°W-40°E. These indices are used to measure the NAO…
-
Formats
- ascii
-
Timestep
- Monthly, Seasonal, Annual
-
Domain
- Atlantic Ocean
-
Collections
- Climate Analysis Section (CAS) Data Catalog
Experts contributing reviews
- Hurrell, James, Phillips, Adam
 Southern Oscillation Indices: Signal, Noise and Tahiti/Darwin SLP (SOI)
Years of record
- to
The Southern Oscillation Index (SOI) is a time series used to characterize the large scale sea level pressure (SLP) patterns in the tropical Pacific. Monthly mean SLP at Tahiti [T] and Darwin [D] are used. An optimal SOI can be constructed. It consists of [T-D]…
-
Timestep
- Monthly
-
Domain
- Australia, Pacific Ocean, Tropics
-
Collections
- Climate Analysis Section (CAS) Data Catalog
Experts contributing reviews
- Trenberth, Kevin
 JRA-3Q Atmospheric Reanalysis
Years of record
The Japanese Reanalysis for Three Quarters of a Century (JRA-3Q) is the third generation long-term reanalysis product developed by the Japanese Meteorological Agency (JMA). JRA-3Q is a reanalysis using the JMA global Numerical Weather Prediction (NWP) system as of 12/2018…
Main variables and Earth System components
Atmosphere Air Temperature Geopotential Height Precipitable waterExperts contributing reviews
 JRA-55
Years of record
- to
Note: JRA-55 has been superseded by JRA-3Q Spanning 1958-present, JRA-55 is the longest third-generation reanalysis that uses the full observing system (in contrast, products like ERA-20C and NOAA 20CR assimilate a very limited set of observations while NCEP R1 uses an…
Main variables and Earth System components
Atmosphere Air Temperature Geopotential Height Precipitable waterExperts contributing reviews
- Kobayashi, Shinya