Total Solar Irradiance (TSI) datasets: An overview
The solar radiation arriving at Earth (once known as the “solar constant”, now usually referred to as Total Solar Irradiance (TSI)), is the most fundamental of climate parameters as it indicates the totality of the energy driving the climate system. All climate models need to prescribe a value for it, either explicitly or implicitly, but its measurement with the precision and stability needed for climate studies has proved challenging. -From Expert Guidance by Drs. Joanna Haigh and William Ball; please see the "Expert Guidance" tab for more.
TSI datasets generally fall under two categories, historical reconstructions and satellite-based radiometric measurements:
Historical reconstructions: The two key datasets for long, historical records of TSI are (1) SATIRE and (2) NRLTSI. The NRLTSI data are being produced by NOAA as a Climate Data Record, available in a useful netCDF format with data for 1882-present.
For CMIP6 historical experiments, the recommended solar forcing data (see "Get Data" tab for access) are based on a mean of these historical reconstructions.
Contemporary radiometric measurements from satellites: Recently, TSI has been measured by the Total Irradiance Monitor (TIM); two versions of this instrument have flown on the SORCE spacecraft (providing TSI measurements since 2003) and the TCTE platform (providing TSI measurements since 2013). SORCE and TCTE data are available through the University of Colorado's Laboratory for Atmospheric and Space Physics.
A joint European Space Agency-NASA experiment known as VIRGO, which encompasses 3 instruments for TSI on the SOHO spacecraft, has provided TSI data from the mid-1990s to present.
Earlier satellite-era TSI measurements came from the ERB/HF, ACRIM, and ERBS missions. Data from these earlier missions have been combined with contemporary VIRGO measurements to form a composite satellite-era TSI record known as PMOD (named for the institute in Davos, Switzerland that produces the data), which spans 1978-present.
Please see the "Expert Guidance" tab for more background on these datasets, and the "Get Data" tab for links to access the datasets.
Key Strengths
Key Limitations
- NOAA Climate Data Record (CDR) of Total Solar Irradiance (TSI), NRLTSI Version 2 (annual from 1610-; daily from 1882-)
- SATIRE historical reconstruction, daily values 1610-present and decadal values back to 9500BC
- Interactive TSI data portal from SOURCE/TIM and TCTE/TIM at U Colorado Laboratory for Atmospheric and Space Physics
- SORCE Mission TSI data
- TCTE Mission TSI data (successor to SORCE Mission)
- TSI data overview page from Gregg Kopp, U of Colorado
- PMOD composite data (1978-present)
- More information about the PMOD composite
- VIRGO daily data since 1996
- More information about the VIRGO data
- ACRIM data
- PREMOS/PICARD home page (data available on request)
- CMIP6 solar forcing data and recommendations
Expert User Guidance
The following was contributed by Drs. Joanna Haigh and Willam Ball, February, 2016:
The solar radiation arriving at Earth (once known as the “solar constant”, now usually referred to as Total Solar Irradiance (TSI), is the most fundamental of climate parameters as it indicates the totality of the energy driving the climate system. All climate models need to prescribe a value for it, either explicitly or implicitly, but its measurement with the precision and stability needed for climate studies has proved challenging.
Radiometric measurements
The first measurements of TSI using absolutely-calibrated radiometers were made from balloons and rockets from the late 1960s to mid-1970s. Before then, measurements were made from the Earth’s surface but these were subject to vagaries of instrument calibration, as well as to the effects of the intervening atmosphere, so the accuracy achieved was poor. From 1978 onwards radiometers on satellites have provided a series of temporally overlapping datasets. To take account of the varying distance between the Earth and the Sun these records have been scaled to the relative value at 1AU. The offsets between the individual records illustrate the challenge of achieving high absolute accuracy (although it should be noted that even an apparently large difference, of say 10 Wm-2, would represents an error of well under 1%). The precision of each instrument is much higher so that the large day-to-day changes shown in the figure accurately reflect variations in the Sun, such as the transit of sunspots across its surface. Furthermore, the variation in TSI of about 0.1% between minimum and maximum of the 11-year solar cycle is well resolved by each dataset. Nevertheless it is important to establish the absolute value with as high as possible accuracy and stability so that (a) a reliable energy input can be used in climate models and (b) any longer term trends in solar output can be monitored. A detailed study of the reasons for the disparity between contemporaneous measurements by different instruments has concluded that the geometrical arrangement of the internal optics in SORCE/TIM is better able than other instruments to prevent the scattering of stray light onto the detector and thus that its lower value of around 1361 Wm-2 is more accurate than the c. 1365 Wm-2 previously established. Understanding of TSI behaviour during overlapping periods allows a composite record back to 1979 to be constructed, although assumptions made by different authors give rise to results with slightly different long term inter-cycle trends. In recent years it has generally been accepted that the PMOD composite, which displays a decline of c. 0.3 Wm-2 over the past three solar cycle minima, is probably the most accurate.
KEY STRENGTHS for radiometric measurements:
- Data of very high precision, daily, monthly, annually over the past 37 years.
KEY LIMITATIONS for for radiometric measurements :
- Uncertainty in decadal trends.
Historical reconstructions
For dates prior to the satellite era TSI values are deduced from other indicators of solar activity. Typically the indicators provide areas of the solar surface covered by sunspot umbrae and penumbrae (dark), faculae and network (bright). A relationship between these measures and TSI is established over the satellite era and then used historically over the period for which the indicators are available. There are two main sources of historical TSI reconstruction available for climate science:
1. SATIRE
SATIRE-S: For dates since 1974 daily full-disc magnetograms and continuum images of the Sun are used to identify the spatial distributions of the different components and to quantify the fractional areas of the solar disc they cover.
SATIRE-T: From 1610 daily sunspot numbers, areas and locations are input to a physical model that simulates the evolution of the surface magnetic field, which is then used to calculate the same quantities as from the more recent data. A default version that combines SATIRE-T with SATIRE-S is available; the result is shown here.
SATIRE-T2: A newer version that employs a surface flux transport model from 1878 to describe the evolution of the solar surface magnetic field; the input is still the sunspot number and areas.
SATIRE-H: A Holocene version is also available, based on concentrations of the cosmogenic isotope 14C in tree rings (which vary inversely with solar activity) to provide decadal TSI values from 9500BC.
2. NRLTSI/NRLTSI2
A 2-component empirical model is used in which the first component represents darkening, and thus a reduction in TSI, due to the presence of sunspots and the second, brightening due to the presence of faculae, summed against a background “quite Sun” value. A third component is added for longer-term secular changes.
Daily sunspot areas and positions inform the darkening. Facular brightening since 1978 is based on daily measurements of the Mg II core-to-wing ratio in the solar UV. Before that date, back to 1610, a magnetic flux transport model is used to calculate the emergence of bright magnetic surface features. One version of this model, NRLTSI, was specified as input to the CMIP5 climate model comparison. A new version, NRLTSI2 has subsequently been developed.
NRLTSI2 has a long-term trend from 1882 to 1974 similar to SATIRE-T. During the observational period from 1978 to present, however, the two reconstructions contain different decadal trends, e.g. NRLTSI2 shows an increase of 0.05 Wm-2 from the solar cycle minimum in 1986 to that of 1996 whereas SATIRE shows a decline of 0.2 Wm-2. Thus while cycle variability is comparable in these input datasets, their long-term components are not.
It has been decided that the values to be prescribed for the CMIP6 exercise will be the arithmetic mean of the SATIRE and NRLTSI2 datasets.
KEY STRENGTHS for historical reconstructions:
- Internally consistent datasets provide for the needs of climate modellers.
KEY LIMITATIONS for historical reconstructions:
- Lack of a complete physical understanding of the relationship between TSI and other solar activity indicators leaves uncertainty in the deduced multi-decadal trends.
##
Cite this page
Acknowledgement of any material taken from or knowledge gained from this page is appreciated:
Ball, William &, Haigh, Joanna & National Center for Atmospheric Research Staff (Eds). Last modified "The Climate Data Guide: Total Solar Irradiance (TSI) datasets: An overview.” Retrieved from https://climatedataguide.ucar.edu/climate-data/total-solar-irradiance-tsi-datasets-overview on 2026-02-17.
Citation of datasets is separate and should be done according to the data providers' instructions. If known to us, data citation instructions are given in the Data Access section, above.
Acknowledgement of the Climate Data Guide project is also appreciated:
Schneider, D. P., C. Deser, J. Fasullo, and K. E. Trenberth, 2013: Climate Data Guide Spurs Discovery and Understanding. Eos Trans. AGU, 94, 121–122, https://doi.org/10.1002/2013eo130001
Key Figures
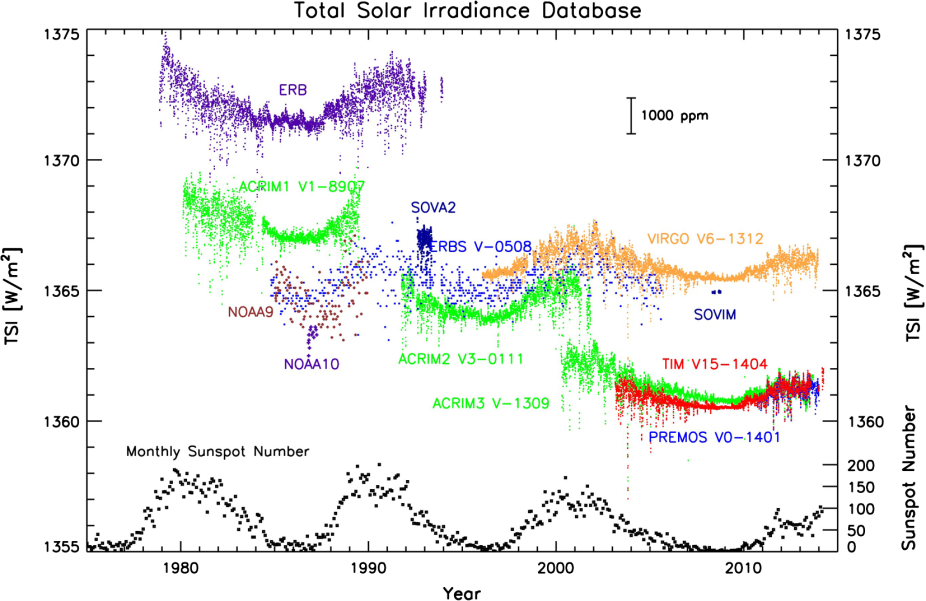
Summary timeseries of satellite-era TSI datasets. From Kopp (2014): http://dx.doi.org/10.1051/swsc/2014012