ERA-20C: ECMWF's atmospheric reanalysis of the 20th century (and comparisons with NOAA's 20CR)
The ECMWF's first atmospheric reanalysis of the 20th Century, ERA-20C, provides a long, gridded dataset of many climate variables, spanning 1900-2010. Observations assimilated include surface pressures from the International Surface Pressure Databank v3.2.6 and ICOADS v 2.5.1, and surface winds over the oceans from ICOADSv2.5.1. Upper-air and satellite data are omitted. Due to the limited observations used, the ERA-20C does not provide the best estimate of the atmospheric state for the better observed period since 1979; users investigating this period have several, more comprehensive reanalyses from which to choose.
Compared to the NOAA 20th-Century Reanalysis (20CR), ERA-20C is shorter, but provides finer horizontal and vertical resolution. Due to subtle differences in the data assimilated and the data assimilation schemes, ERA-20C may perform better than 20CR in relatively well observed regions such as western Europe, while 20CR may take better advantage of sparse observations in regions such as the Southern Hemisphere middle to high latitudes. See the "Expert Guidance" tab for further comparison of the 20CR and ERA-20C. ECMWF has also released an "AMIP style" version of the 20th Century reanalysis, known as ERA-20CM, which includes no data assimilation. ERA-20C and ERA-20CM are forced with the same time-varying SSTs, sea ice concentrations, and radiative forcings.
Key Strengths
Key Limitations
For data via NCAR RDA: European Centre for Medium-Range Weather Forecasts. 2014, updated daily. ERA-20C Project (ECMWF Atmospheric Reanalysis of the 20th Century). Research Data Archive at the National Center for Atmospheric Research, Computational and Information Systems Laboratory. http://dx.doi.org/10.5065/D6VQ30QG. Accessed† dd mmm yyyy.
Expert Developer Guidance
The following was contributed by Dr. Paul Poli at Météo-France, January, 2016:
This post explores the specificities of the two 20th century reanalyses from NOAA and ECMWF, respectively 20CR and ERA-20C.
Similarities and differences
Similar strengths
- The records are gap-free and long (over 100 years), and represent many essential climate variables (multivariate).
- Data are served by more than one data center
- The atmospheric general circulation model is forced by historical time-varying changes in sea-surface temperature and ice fraction, greenhouse gases concentrations (CO2), volcanic aerosol, and solar variations
- Products are supported by supplementary material, the data assimilation observation feedback
Similar limitations
- Products are affected by changes in the observing system
- The analyses assimilated only surface observations, especially pressure from the International Surface Pressure Databank -- ISPD (version 3.2.9 for 20CR vs 3.2.6 for ERA-20C), generally bias-corrected in both systems
- The atmospheric general circulation model is missing some known anthropogenic forcings, such as changes in land use and irrigation
Major differences
- 20CR features a longer record than ERA-20C: years 1851-2014 vs 1900-2010
- 20CR is a 56-member ensemble; ERA-20C is deterministic or single member (however, its production made use of an initial 10-member ensemble production to derive background errors)
- ERA-20C is higher resolution than 20CR: 125 vs 210 km in the horizontal, 91 levels vs 28 levels in the vertical, and typically 3-hourly vs 6-hourly in the temporal domain
- ERA-20C is supported by additional supplementary material, the ERA-20CM dataset, a model integration without data assimilation
Subtle differences
- 20CR caps the growth in the number of surface pressure observations assimilated, using a thinning technique (for example, only about a third of all surface pressure observations are assimilated in 2005).
- 20CR does not correct for biases in surface pressure observations from ships and buoys.
- ERA-20C assimilates marine surface winds from the International Comprehensive Ocean-Atmosphere Data Set (ICOADS) version 2.5.1.
- ERA-20C observation feedback archive includes observation departures not only for assimilated observables (pressure and winds) but also for non-assimilated ones, such as temperatures and humidities measured by ships, buoys, and platforms at sea or on sea-ice.
- 20CR analysis scheme is Ensemble Kalman Filter (EnKF), applied in 6-hour windows; ERA-20C analysis scheme is 24-hour four-dimensional variational (4D-Var).
Consequences regarding data quality
From the similarities
Both reanalyses attempt to fairly represent the evolution of meteorology and climate throughout the 20th century. Like all reanalyses, they provide gridded datasets that cover many variables, and which can be sliced along any dimension of interest, thereby serving potentially many applications.
Neither of these two reanalyses continues in near-real-time. Also, by voluntarily omitting upper-air and satellite observations, neither reanalysis attempts to provide "best estimates" for the years when these observations are available in large numbers, which is approximately since 1957 for in situ upper-air observations, and since 1979 for satellite observations. Consequently users searching "best estimates" for those time periods should turn to more complete reanalyses, such as JRA-55, MERRA, CFSR, or ERA-Interim.
The global changes in observation coverage mean that regional trends suggested by these two reanalyses in the Southern hemisphere are at best to be treated with caution. In the Northern hemisphere, the best-observed areas throughout the record, and the areas downstream of them, are the most likely to feature reliable changes in circulation and precipitation.
The non-assimilation of any humidity observations leaves the analysis free of any increment that would affect the water cycle. Consequently, the trends in precipitation are mostly driven by the changes in forcings and atmospheric circulation, and not by sudden jumps in humidity observation coverage that would correct for biases in the atmospheric general circulation model. This means that the absolute level of precipitations may not be optimal in either of the two reanalysis, but the qualitative changes may be.
From the differences
Although both reanalyses use very similar observation input -- only surface -- the subtle differences in the choices of variables assimilated, the thinning imposed by 20CR, and the quality controls of either data assimilation system means that the coverage in assimilated observations can differ significantly. For example, tropical cyclone bogus observations are largely rejected in ERA-20C because these observations do not fit with the large-scale expected background errors.
The 6-hour EnKF allows for fast-evolving and locally targeted background errors, and helps optimally analyze scarce observations in otherwise largely unobserved areas. This clearly advantages 20CR for the synoptic analysis for most of the record in the Southern hemisphere. In contrast, the 24-hour 4D-Var enables synergetic exploitation of the atmospheric model diurnal cycle and observations reported several times a day by stations or ships. This advantages ERA-20C in well-observed areas such as Western Europe, where the assimilation of winds also assists to better represent synoptic systems.
The availability of multiple analyses (56 ensemble members) from 20CR enables users to "flow" this uncertainty into their application. However, the absolute level of uncertainty may need tuning (e.g., inflating the spread), to match the estimate of uncertainty for the application in question. Such adjustment is not trivial unless the distribution of the ensemble member solutions is reduced to a parametric distribution, which negates the advantages of considering ensemble members separately.
The availability of a model integration dataset, ERA-20CM, to accompany the ERA-20C dataset, is key to assess whether changes in ERA-20C for a variable of interest results from the assimilation of observations.
The assimilation methodology of ERA-20C, compatible with present-day Numerical Weather Prediction ECMWF operations, makes it easier for future repeats of 20th century reanalyses at ECMWF to gradually incorporate additional observing systems such as in situ upper-air and satellite ones. ##
Cite this page
Acknowledgement of any material taken from or knowledge gained from this page is appreciated:
Poli, Paul & National Center for Atmospheric Research Staff (Eds). Last modified "The Climate Data Guide: ERA-20C: ECMWF's atmospheric reanalysis of the 20th century (and comparisons with NOAA's 20CR).” Retrieved from https://climatedataguide.ucar.edu/climate-data/era-20c-ecmwfs-atmospheric-reanalysis-20th-century-and-comparisons-noaas-20cr on 2026-05-12.
Citation of datasets is separate and should be done according to the data providers' instructions. If known to us, data citation instructions are given in the Data Access section, above.
Acknowledgement of the Climate Data Guide project is also appreciated:
Schneider, D. P., C. Deser, J. Fasullo, and K. E. Trenberth, 2013: Climate Data Guide Spurs Discovery and Understanding. Eos Trans. AGU, 94, 121–122, https://doi.org/10.1002/2013eo130001
Key Figures
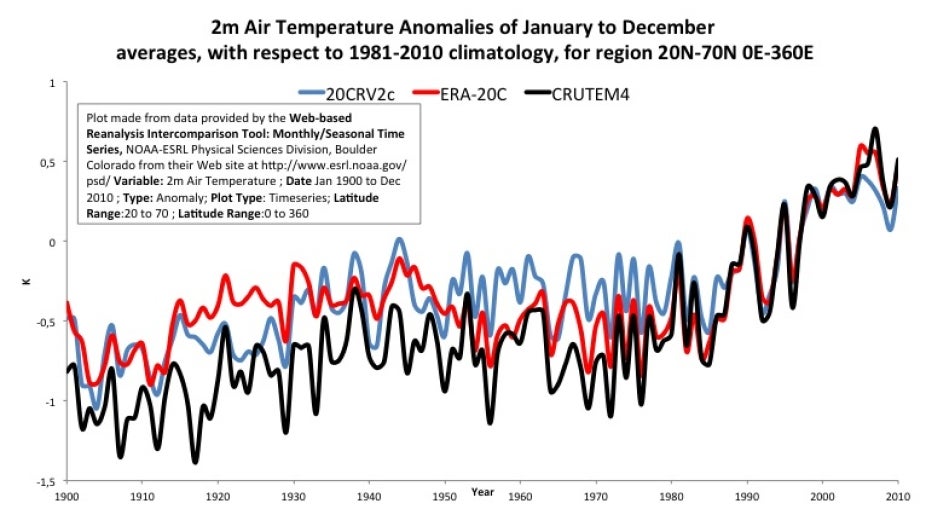
Data show timeseries generated by plotting data served by the WRIT tool for CRUTEM4, 20CRv2c, and ERA-20C (contributed by P Poli) (note: CRUTEM4 is a land-only dataset, whereas the reanlayses data cover ocean and land)
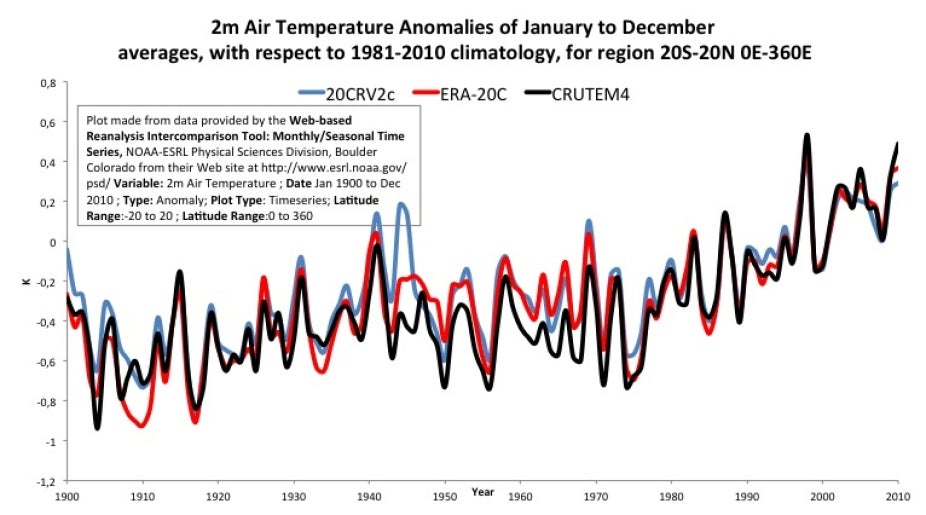
Data show timeseries generated by plotting data served by the WRIT tool for CRUTEM4, 20CRv2c, and ERA-20C (contributed by P Poli) (note: CRUTEM4 is a land-only dataset, whereas the reanlayses data cover ocean and land)
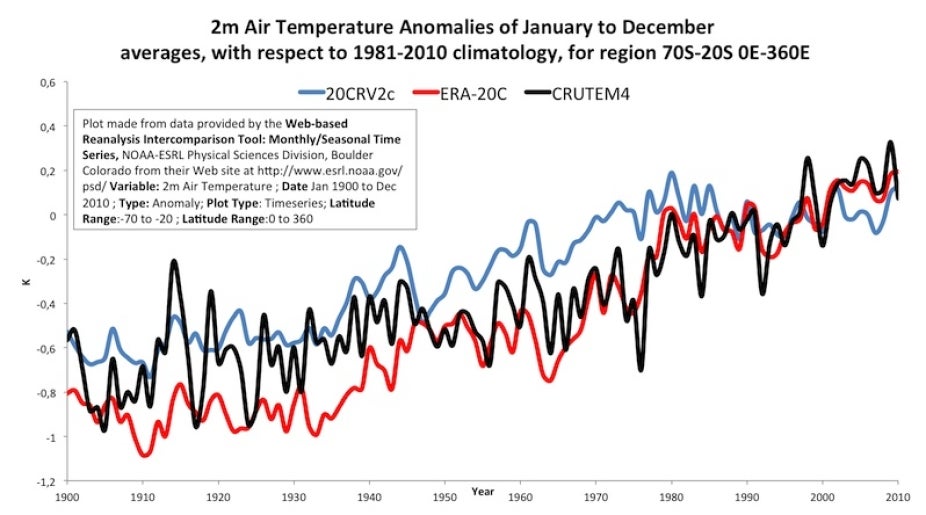
Data show timeseries generated by plotting data served by the WRIT tool for CRUTEM4, 20CRv2c, and ERA-20C (contributed by P Poli)(note: CRUTEM4 is a land-only dataset, whereas the reanlayses data cover ocean and land)
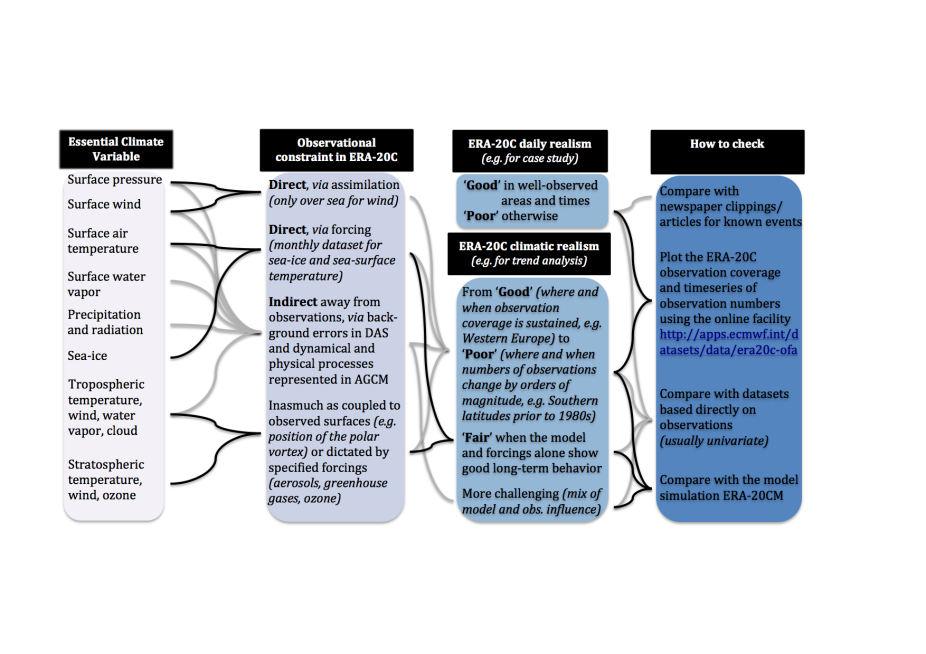
This path diagram suggests relationships to assess the applicability of ERA-20C (contributed by P Poli)

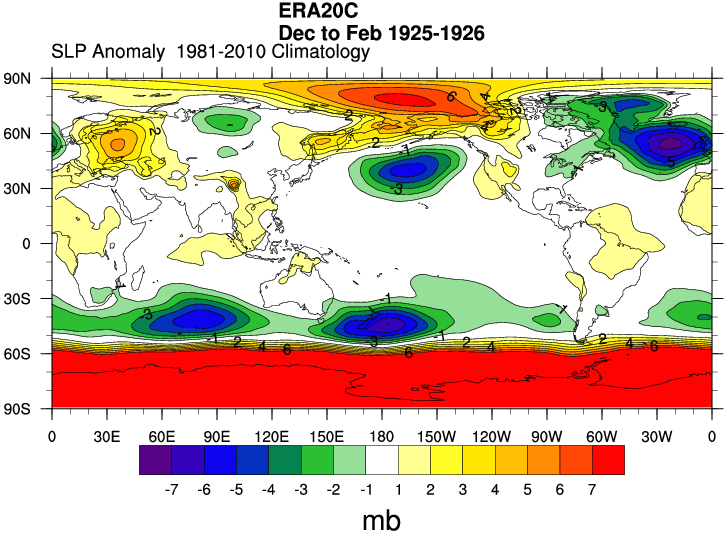
SLP anomaly in DJF 1925-26 in ERA-20C. Created by D. Schneider using NOAA's web-based reanalysis intercomparison tool: http://www.esrl.noaa.gov/psd/data/writ/
Other Information
- ERA Report Series Number 20: Poli, P., H. Hersbach, P. Berrisford, and coauthors, 2015: ERA-20C Deterministic
- ERA Report Series Number 14: The data assimilation system and initial performance evaluation of the ECMWF pilot reanalysis of the 20th-century assimilating surface observations only (ERA-20C)