Atmospheric Reanalysis: Overview & Comparison Tables
Reanalysis a systematic approach to produce data sets for climate monitoring and research. Reanalyses are created via an unchanging ("frozen") data assimilation scheme and model(s) which ingest all available observations every 6-12 hours over the period being analyzed. This unchanging framework provides a dynamically consistent estimate of the climate state at each time step. The one component of this framework which does vary are the sources of the raw input data. This is unavoidable due to the ever changing observational network which includes, but is not limited to, radiosonde, satellite, buoy, aircraft and ship reports. Currently, approximately 7-9 million observations are ingested at each time step. Over the duration of each reanalysis product, the changing observation mix can produce artificial variability and spurious trends. Still, the various reanalysis products have proven to be quite useful when used with appropriate care.
Key Strengths
Global data sets, consistent spatial and temporal resolution over 3 or more decades, hundreds of variables available; model resolution and biases have steadily improved
Reanalyses incorporate millions of observations into a stable data assimilation system that would be nearly impossible for an individual to collect and analyze separately, enabling a number of climate processes to be studied
Reanalysis data sets are relatively straightforward to handle from a processing standpoint (although file sizes can be very large)
Key Limitations
Observational constraints, and therefore reanalysis reliability, can considerably vary depending on the location, time period, and variable considered
The changing mix of observations, and biases in observations and models, can introduce spurious variability and trends into reanalysis output
Diagnostic variables relating to the hydrological cycle, such as precipitation and evaporation, should be used with extreme caution
Varies with the source. Please remember to cite your sources.
Expert User Guidance
The following was contributed by John Fasullo, NCAR, NOV, 2011:
#The use of 'n-th generation reanalysis' to classify different reanalyses [which you will see on the pages linked to in the table below] is based on the incremental advancement of reanalysis techniques. While uniform distinctions between groups of reanalyses are somewhat artificial, the introduction of major advancements in the reanalysis methodologies over time and the opportunity to learn from earlier reanalysis efforts are clear. In this context, our description of reanalysis efforts as 1st-generation (such as the initial reanalysis efforts of NCEP-NCAR and NCEP-DOE) and 2nd-generation (ERA40,JRA25) correspond, in part, to their evolving abilities to assimilate the full suite of available satellite radiances. For example, the NCEP-NCAR and NCEP-DOE reanalyses do not assimilate satellite water vapor channels over ocean while follow-on efforts do. The 3rd-generation efforts, such as ERAI, MERRA, CFSR, used more sophisticted data assimilation approaches (e.g. analysis increments and 4D-Var) and models and, again, addressed issues discovered in the 2nd-generation reanalysis efforts. Nonetheless, the artificial nature of these distinctions is evident in CFSR, which in many ways can be viewed as a 1st generation effort as it is the first reanalysis to include an interactive ocean in its reanalysis forecasts. Other reanalyses, such as the 20th Century reanalysis, further defy this simple classification as in attempting to extend its record back in time to the late 19th century, it intentionally excludes much of the modern observational record.##
The following was contributed by Dennis Shea, NCAR, NOV, 2011:
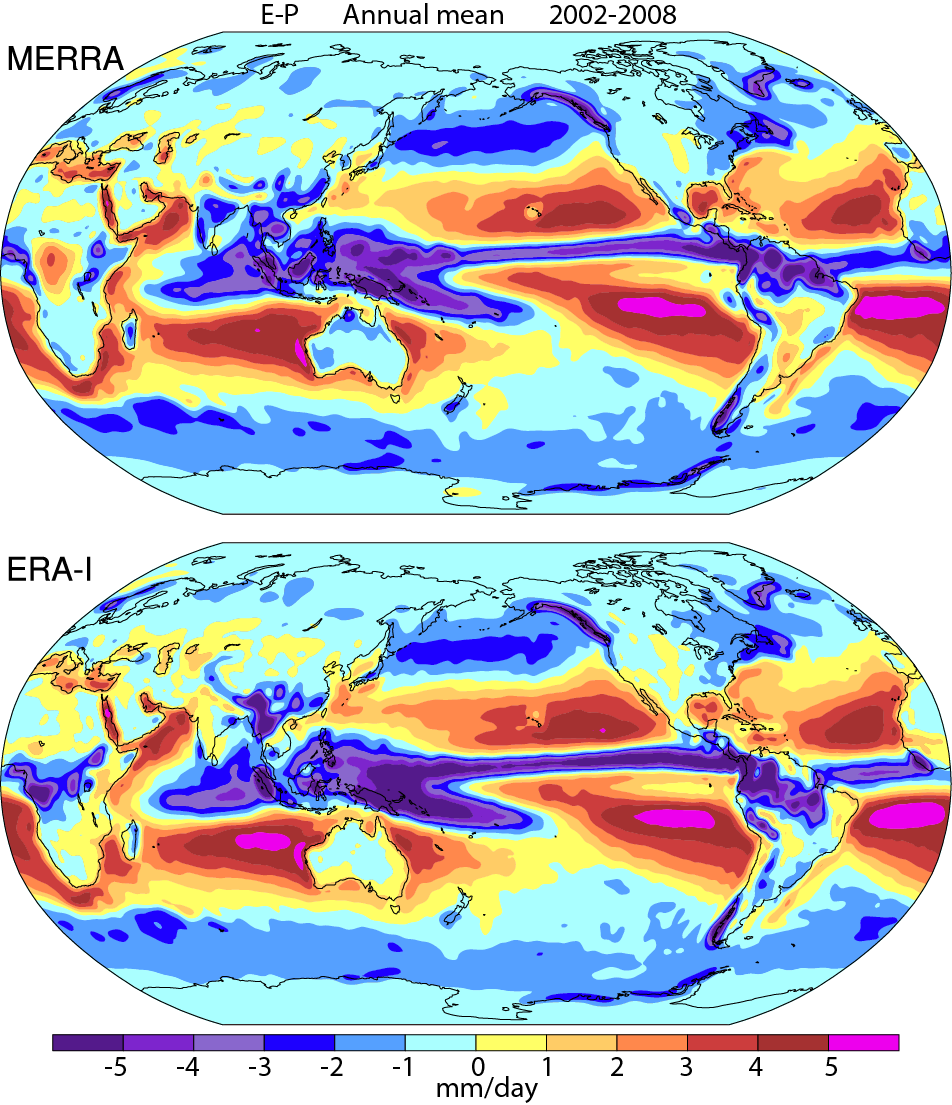
#Generally, users are advised to use third generation reanalysis products (ERA-Interim, MERRA, CFSR). To illustrate "use with appropriate care", the included figure of evaporation minus precipitation (Trenberth et al., 2011 J Clim v24 p4907), shows agreement over much of the globe. However, over Africa the derived estimates are of different sign!
Intercomparisons between similar generation reanalysis products may yield estimates of the uncertainty of some variables and derived quantities. Additionally, reanalyses can serve as focal point for model intercomparisons.##
The following was contributed by Dick Dee, ECMWF, March, 2012 (full contribution on the ERA-Interim page):
# Reanalysis data sets in general
Key strengths:
- The data are multivariate, spatially and temporally complete, and gridded
- The data combine information from many sources (observations and models)
- The data set is physically and dynamically coherent, according to the models used
Key weaknesses:
- Changes in the observing system can cause changes in mean errors
- Mixing observations with models tends to violate conservation properties
- Uncertainties in the reanalysis data are difficult to understand and quantify
...
Reanalysis data are often used to represent the "true state of the atmosphere according to observations." In actual fact, reanalysis combines inaccurate and incomplete observations with imperfect models, using methods and procedures that are technically and scientifically complex. Limitations and caveats of reanalysis data mainly result from:
- Lack of observations. The atmosphere is not now, nor ever has been, fully observed.
- Errors in the observations, and lack of information about those errors.
- Shortcomings in the assimilating model, and lack of information about model errors.
- Shortcomings in data assimilation methodology.
- Technical errors and mistakes.
- Computational limitations (e.g. limitations in spatial and temporal resolution)
Several of these items have to do with a lack of information. They represent fundamental limitations that are not restricted to reanalysis but play a role in any observational data set. (Note: replacing a skillfull forecast model by straightforward spatial interpolation does not solve anything - it is tantamount to removing, not adding, information).
To assess uncertainties in specific variables produced by reanalysis requires answering the following questions:
- How strongly is the variable constrained by observations? Is it directly or indirectly observed?
- What is the spatial and temporal distribution of the observations? How does this change in time?
- How accurately can the model represent the variable? Does the model have skill in extrapolating and/or predicting it?
Users interested in the quality of low-frequency variability and/or trend estimates need to consider these aspects throughout the time period in question. Temporal variation in the observational constraint can produce artificial shifts in the reanalysis time series, especially if the assimilating model has systematic errors. See Section 8 in Dee and Uppala (2008) for a stratospheric example of this problem.
Given the continuous changes in the observing system, and the fact that all models have some systematic errors, users should be cautious when using reanalysis data for climate studies. It is necessary (but not always possible) to verify trend estimates by comparing with independent data sets, e.g. as in Simmons et al (2010).
Most users do not have access to the information needed to answer the difficult questions listed above. On the other hand, producers of reanalysis data do not have the resources (nor the application-specific knowledge) to answer them either. The challenge is to provide better tools and information to support users in making their own uncertainty assessments. In particular, it should be made much easier for a user to get detailed information about the observations used in reanalysis, including the quality assessment and bias adjustments produced by the reanalysis process itself.##
Key Figures
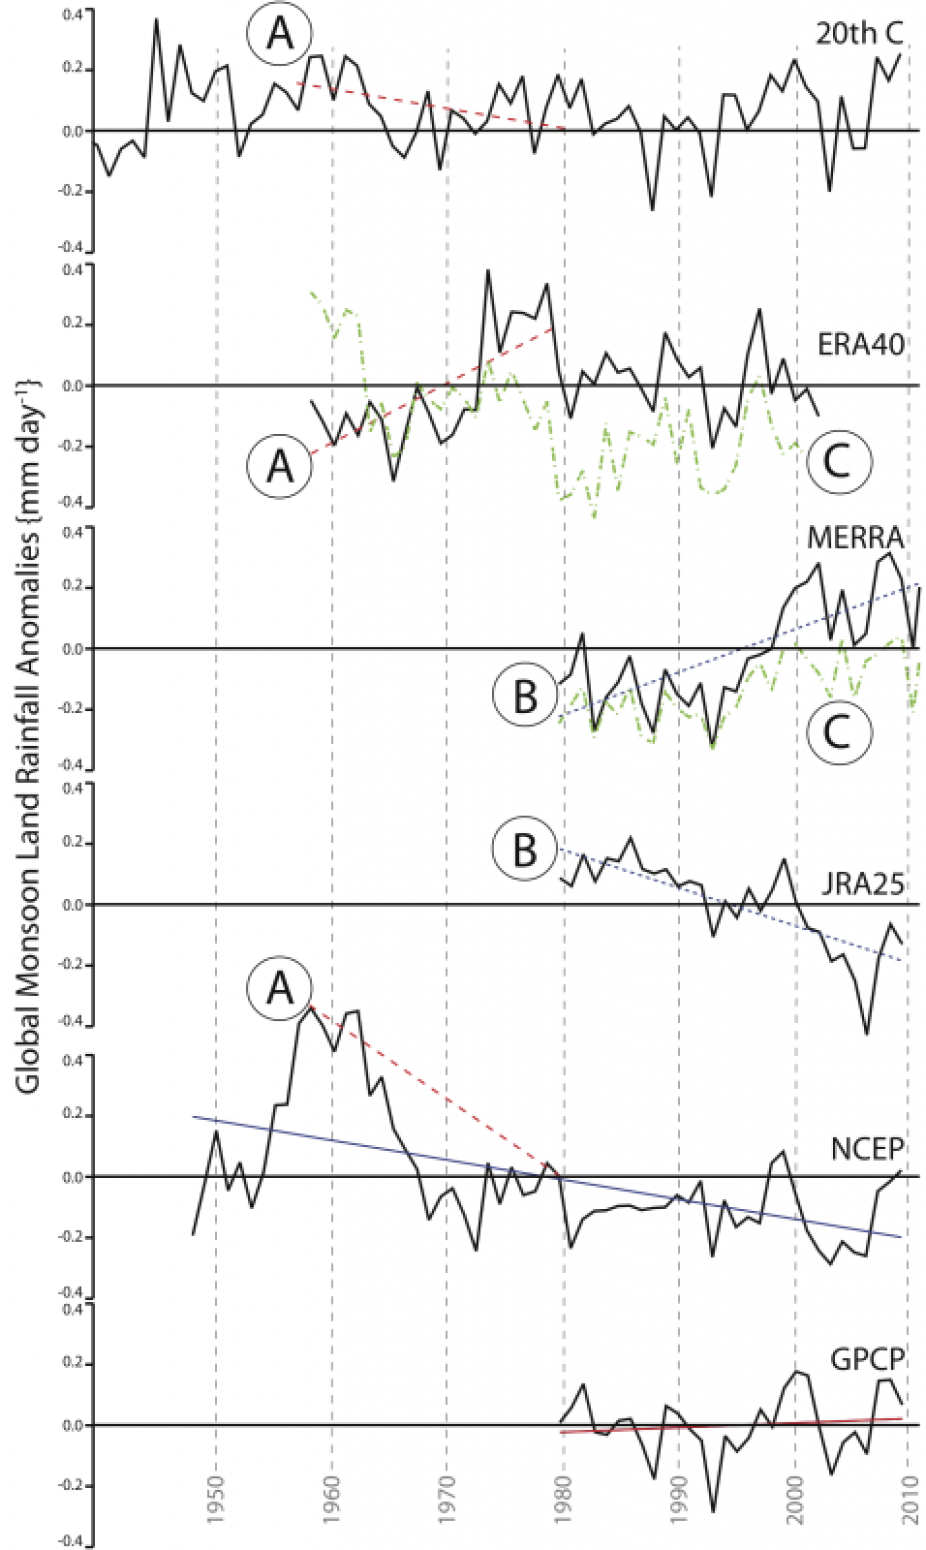
What are the trends in monsoon rainfall? This figure illustrates the evolution of the global monsoon rainfall over land as estimated from various reanalyses and GPCP. Several identifiably spurious features exist including contradictory trends prior to (A) and during the satellite era (B), and inconsistencies with moisture convergence estimated from the mass-corrected atmospheric moisture budget (C). Figure by John Fasullo based on Fasullo 2012 (see Key Publication #5 in the References section).
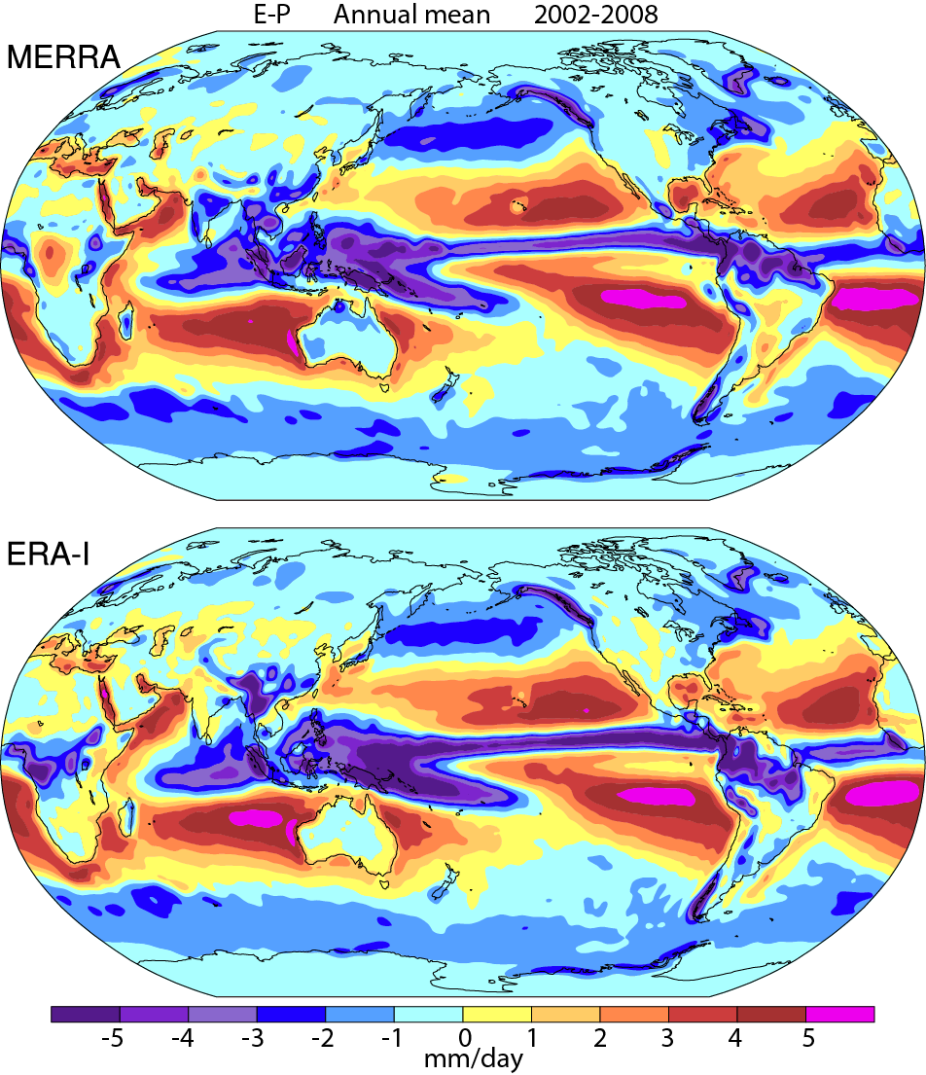
Evaporation minus Precipitation in MERRA (top) and ERA-Interim (bottom) based on Trenberth et al. (2011). (Contributed by J Fasullo)
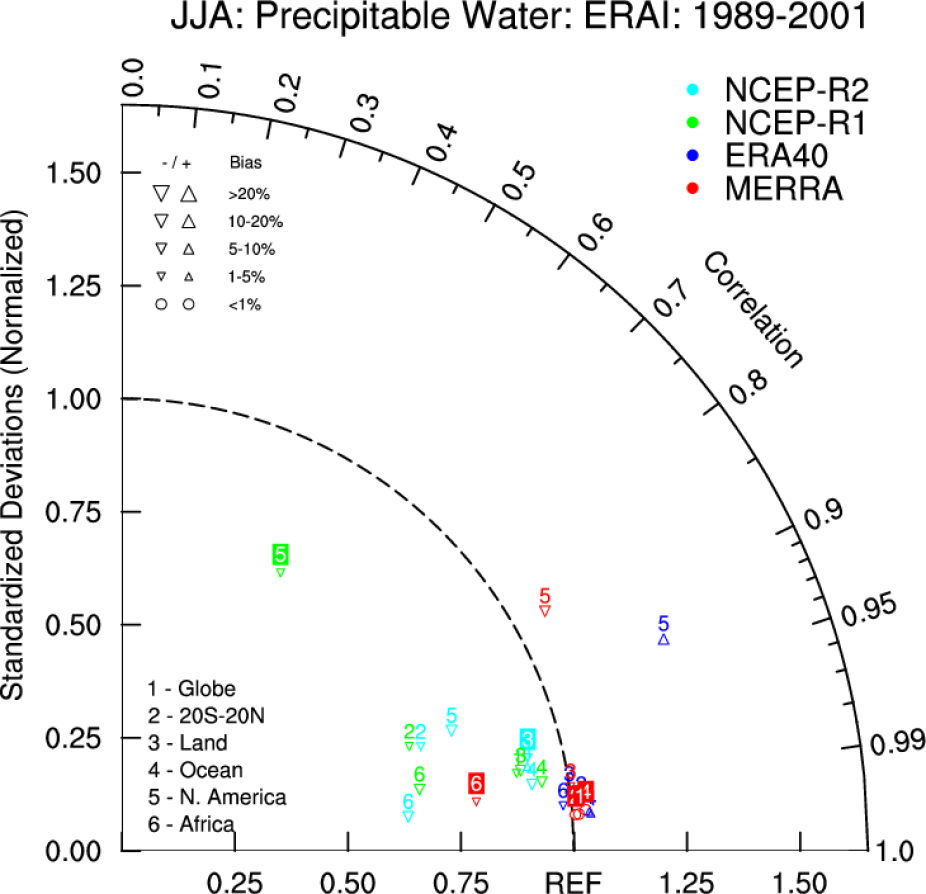
Taylor diagram illustrating pattern similarity and standard deviations for ERA-Interim annual mean precipitable water (1989-2001) compared with other reanalyses. [Climate Data Guide; D. Shea]
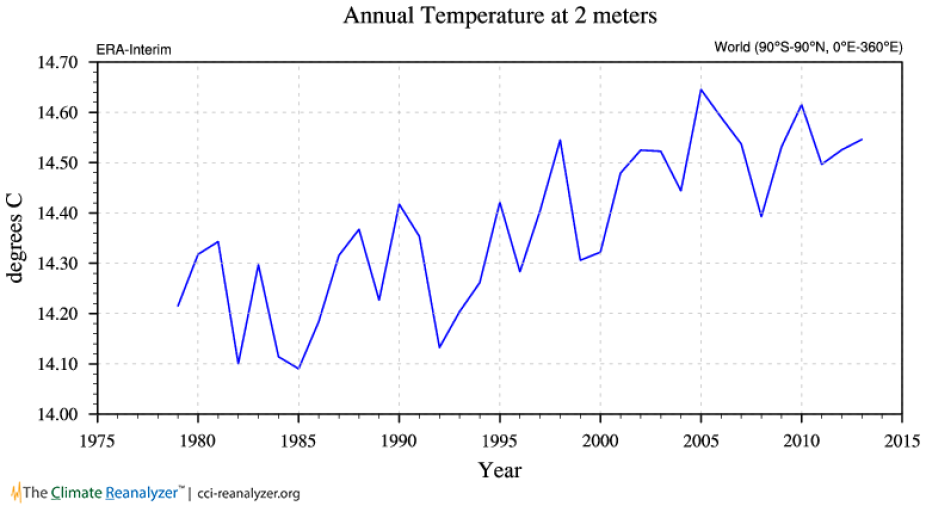
Time series (1979-2013) of ERA-Interim global 2-meter temperatures. Source: http://cci-reanalyzer.org/
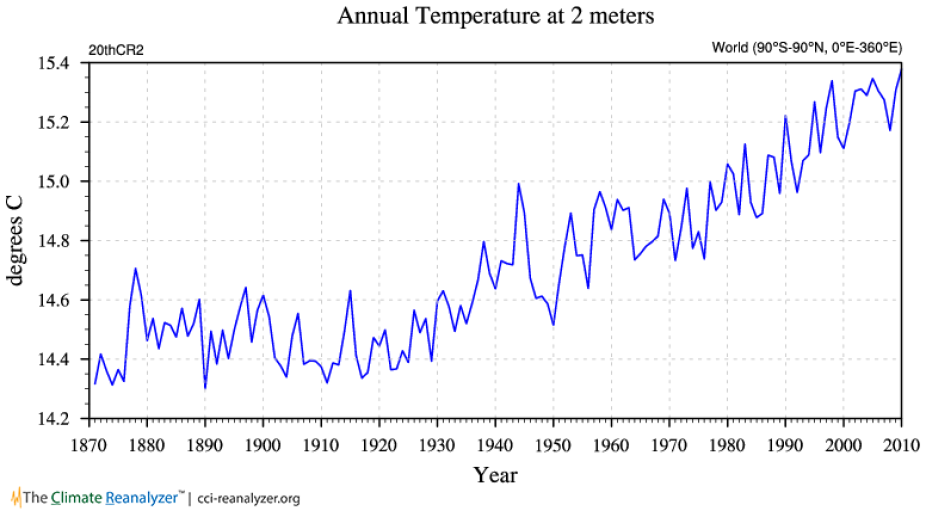
Time series (1870-2013) of 20th-Century Reanalysis global 2-meter temperatures. Source: http://cci-reanalyzer.org/
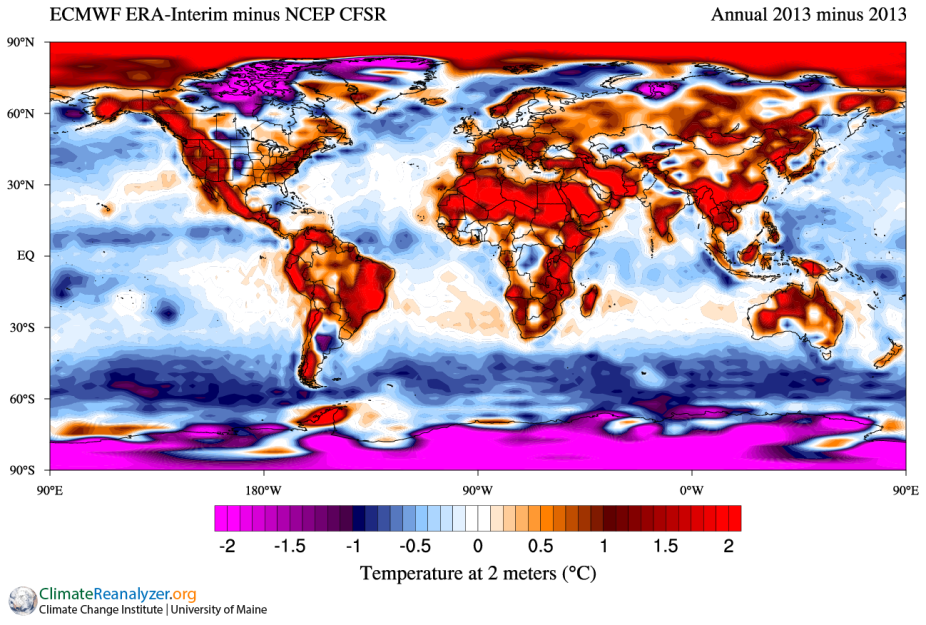
Difference (ERAI-CFSR) between annual mean temperatures for 2013. Source: http://cci-reanalyzer.org/
Other Information
Summary of atmospheric reanalysis products
| Name | Source | Domain | Years of record | Timestep | Spatial Resolution | Formats | Model Resolution | Scheme & Model Vintage |
|---|---|---|---|---|---|---|---|---|
| Arctic System Reanalysis (ASR) | Byrd Polar Research Center, The Ohio State University/ David Bromwich , NCAR , CIRES , U Illinois | Arctic | to | Sub-daily, Monthly | ASR v1; 30 km; 71 levels; 10hPA top , ASR v2; 15 km; 71 levels; 10hPA top | netCDF | 30 km and 15 km |
WRF-VAR |
| CAM6+DART Reanalysis and Surface Forcings | NSF NCAR Data Assimilation Research Testbed (DART), Kevin Raeder | Global | Sub-daily, Weekly | Approx. 1° latitude x 1° longitude | Ensemble Kalman Filter CAM6 (CESM2.1)
|
|||
| CERA-20C: ECMWF's Coupled Ocean-Atmosphere Reanalysis of the 20th Century | ECMWF | Global | to | Sub-daily, Daily, Monthly | ~ 125km; 160 x 320; 91 model levels/ 37 pressure levels / 16 potential temperature levels, and the 2 PVU potential vorticity level | netCDF, GRIB | 4DVAR 2016 |
|
| Climate Forecast System Reanalysis (CFSR) | NCEP | Global | to | Sub-daily, Monthly | .5°x.5° & 2.5°x2.5°, 0.266 hPA top | GRIB | T382 x 64 levels |
3DVAR 2009 |
| ERA-20C: ECMWF's atmospheric reanalysis of the 20th century (and comparisons with NOAA's 20CR) | ECMWF | Global | to | Sub-daily, Daily, Monthly | ~ 125km; 160 x 320; 91 model levels/ 37 pressure levels / 16 potential temperature levels, and the 2 PVU potential vorticity level | netCDF, GRIB | 4DVAR 2012 |
|
| ERA5 atmospheric reanalysis | ECMWF | Global | to | Sub-daily, Daily, Monthly | ~31 km, 137 levels to 1 Pa | GRIB, netCDF | 4DVAR 2016; IFS release 41r2 |
|
| JRA-3Q Atmospheric Reanalysis | Y. Kosaka, Japanese Meteorological Agency (JMA) | Global | Sub-daily, Daily, Monthly | 0.375° and 1.25° | netCDF | TL479 (~40 km)
|
4DVAR The JMA operational system as of 12/2018
|
|
| NASA's MERRA2 reanalysis | NASA Global Modeling and Assimilation Office | Global | to | Sub-daily, Daily, Monthly | ½° latitude by ⅝° longitude by 72 model levels (also interpolated to 42 pressure levels) | netCDF | Cubed sphere grid, stored at ½° latitude by ⅝° longitude by 72 model levels (also interpolated to 42 pressure levels) |
3DVAR 2014 |
| NOAA 20th-Century Reanalysis, Version 2 and 2c | NOAA ESRL , CIRES CDC / Gil Compo | Global | to | Sub-daily, Daily, Monthly | 2°x2°, 28 levels 10 hPA top | netCDF, GRIB | T62 28 levels |
Ensemble Kalman Filter 2009 |