JRA-55C (reanalysis using conventional observations)
JRA-55C is a fixed observing system atmospheric reanalysis that uses the same model and data assimilation scheme as JRA-55. The observations assimilated include surface station data, radiosondes, tropical cyclone retrievals and wind profilers. No satellite observations are included. JRA-55C spans November, 1972 thru December, 2012 but may be extended back to 1958 by combing it with JRA-55 for the pre-satellite era 1958- October 1972. JRA-55C is intended for detecting the impacts of observing system changes on JRA-55, and for studies of climate variability and change.
Key Strengths
Provides a more temporally homogeneous record than is available from a full observing system reanalysis
Allows for the detection of artificial trends caused by changes in the observing system
Key Limitations
Does not provide the best estimate of the atmospheric state for the data-rich period since ~1979
Large uncertainties over data sparse regions such as the oceans, Southern Hemisphere high latitudes and upper stratosphere
Some large biases exist, including a dry bias in the upper and middle troposphere, and a warm bias in the upper troposphere
Expert Developer Guidance
The following was contributed by Chiaki Kobayashi, Japan Meterological Agency and Meterological Research Institute, December, 2015:
The Japanese 55-year Reanalysis Conventional (JRA-55C; C. Kobayashi et al. 2014) is an atmospheric reanalysis assimilating conventional observations only. This reanalysis dataset was created without assimilating satellite observations by using the same data assimilation system as JRA-55 (S. Kobayashi et al. 2015) in order to investigate the impact of observing system changes on the JRA-55 product and to provide more homogeneous meteorological variables for studies of long-term trends and multi-decadal variability. The conventional observations assimilated here are surface observations, radiosondes, tropical cyclone retrievals and wind-profilers. The JRA-55C reanalysis covers the period from January 1958 to December 2012, including the pre-satellite era (January 1958 to October 1972) from the JRA-55 reanalysis; the data assimilation of JRA-55C was performed only for the period after November 1972 during which satellite observations were assimilated in JRA-55.
What are the key strengths of this dataset?
- First fixed-observing-system reanalysis using radiosondes observations.
- Free from satellite observing system changes.
- Temporally homogeneous throughout the reanalysis period
What are the key limitations of this dataset?
- Dry bias in the upper and middle troposphere
- Unrealistic weakening trends of analyzed tropical cyclone strength
- Warm bias in the upper troposphere
- Large precipitation and large outgoing longwave radiation (OLR) over the tropics
Along with these key limitations, the product has large uncertainties in areas where conventional observations are sparse, e.g. over oceans, in the Southern Hemisphere high latitudes and in the upper stratosphere.
What are the typical research applications of these data? What are examples from your work?
- Climate system and climate variability
- Synoptic and planetary scale phenomena
- Verification of general circulation models
- Detection of artificial changes caused by changes in observing systems
What are some common mistakes that users encounter when processing or interpreting these data?
There are large uncertainties in model diagnostic variables such as precipitation, evaporation, radiation flux and cloud cover. This is the case with all reanalyses, (see Expert Guidance of JRA -55).
What are the likely spurious (non-climatic) features, if any, of time series derived from these data?
- Spurious shift over Africa around the year 1998 (intensifying convergence in the upper troposphere, increasing OLR)
- Unrealistic weakening trends of analyzed tropical cyclone strength
What corrections were applied to account for changes in observing systems, sampling methods or density, and satellite drift or degradation?
The bias correction method for radiosonde temperatures adopted by JRA-55 is applied to JRA-55C (see Subsection 2.2.a in S. Kobayashi et al., 2015).##
Cite this page
Acknowledgement of any material taken from or knowledge gained from this page is appreciated:
Kobayashi, Chiaki & National Center for Atmospheric Research Staff (Eds). Last modified "The Climate Data Guide: JRA-55C (reanalysis using conventional observations).” Retrieved from https://climatedataguide.ucar.edu/climate-data/jra-55c-reanalysis-using-conventional-observations on 2026-06-06.
Citation of datasets is separate and should be done according to the data providers' instructions. If known to us, data citation instructions are given in the Data Access section, above.
Acknowledgement of the Climate Data Guide project is also appreciated:
Schneider, D. P., C. Deser, J. Fasullo, and K. E. Trenberth, 2013: Climate Data Guide Spurs Discovery and Understanding. Eos Trans. AGU, 94, 121–122, https://doi.org/10.1002/2013eo130001
Key Figures
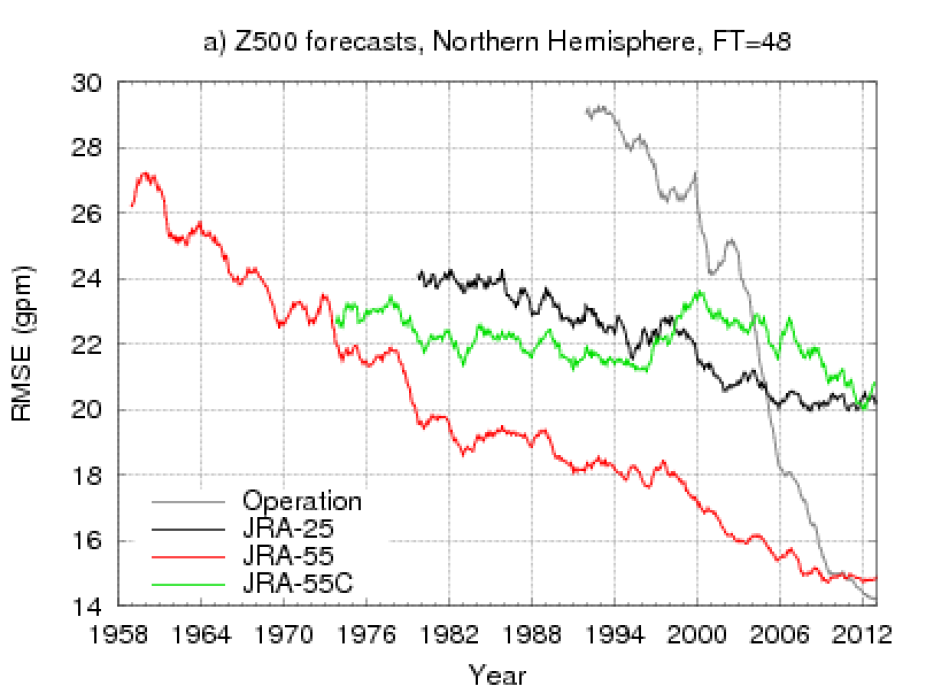
Time series of the RMSE of 2-day forecasts of geopotential height at 500 hPa verified against the corresponding analysis for the NH (20°N−90°N). Units are geopotential meters (gpm). A 12-month running mean was applied for smoothing. “Operation” indicates the JMA operational forecast started from the JMA operational analysis at the indicated time. Each forecast is started from the data produced by the corresponding reanalysis. Adapted and updated from C. Kobayashi et al. (2014, Fig. 3) (Contributed by C. Kobayashi)
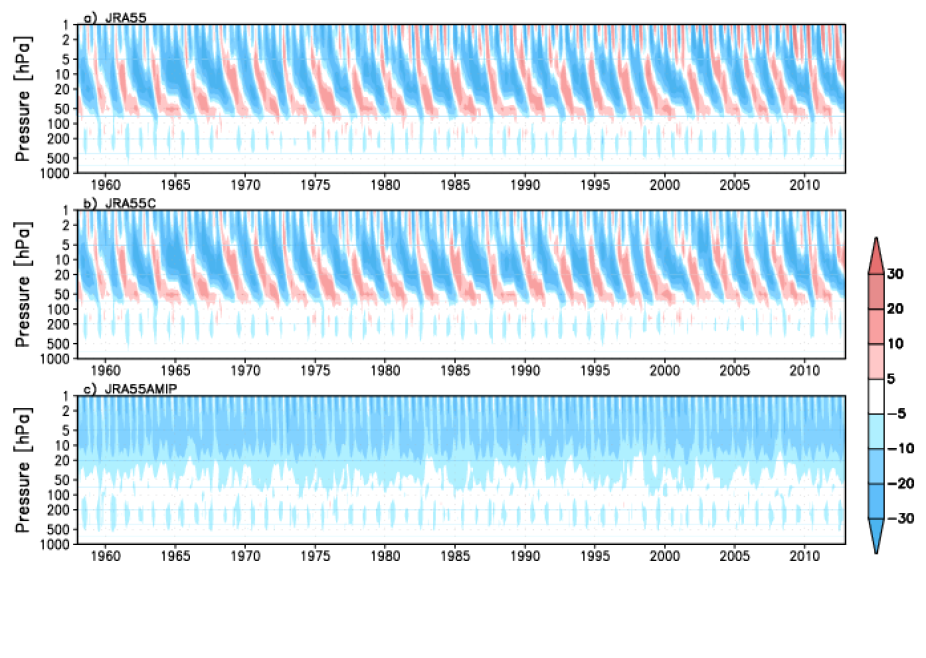
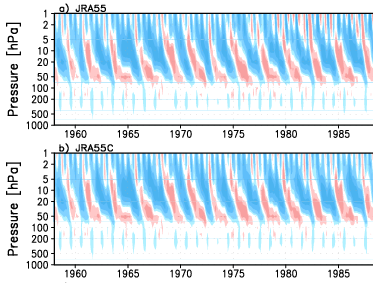
Time-height cross section of equatorial (5°S−5°N) zonal mean U wind component from 1958 to 2012 shown in a) JRA-55, b) JRA-55C and c) JRA-55AMIP (Atmospheric Model Intercomparison Project (AMIP)-type simulation using the same numerical weather prediction system as JRA-55 without assimilating observations). Units are m s−1. Adapted and updated from C. Kobayashi et al. (2014, Fig. 7) (Contributed by C. Kobayahshi)