JRA-55
Note: JRA-55 has been superseded by JRA-3Q
Spanning 1958-present, JRA-55 is the longest third-generation reanalysis that uses the full observing system (in contrast, products like ERA-20C and NOAA 20CR assimilate a very limited set of observations while NCEP R1 uses an antiquated model and assimilation scheme). Compared to the previous generation Japanese Meteorological Agency (JMA) reanalysis, JRA-25, JRA-55 uses a more advanced data assimilation scheme (4Dvar vs 3Dvar), increased model resolution (T319L60 with a reduced Gaussian grid system vs T106L40 in JRA25), a new variational bias correction for satellite data, and several additional observational data sources. Among the improvements in the product are reduced biases in stratospheric temperature and Amazonian rainfall, and greater temporal consistency of the temperature analysis. Some notable biases persist, including a dry bias in the upper and middle troposphere, and a warm bias in the upper troposphere. The impacts of changes in the observing system on the forecast error are generally more evident in the Southern Hemisphere than the Northern Hemisphere. Two companion datasets are available that allow users to address the impact of data assimilation: JRA-55C using conventional observations only and JRA55-AMIP using no data assimilation.
JMA's latest reanalysis in production is JRA-3Q, Japanese Reanalysis for Three-Quarters of a Century, which will span 1947 to the near present.
Key Strengths
Longest-running full observing system reanalysis with 4DVar
Incorporation of several new observational datasets, new radiation scheme, and variational bias correction results in many improvements over JRA-25
Two companion datasets are available that allow users to address the impact of data assimilation: JRA-55C using conventional observations only and JRA55-AMIP using no data assimilation
Key Limitations
As with most reanalyses, diagnostic variables including precipitation and evaporation should be used with extreme caution
Dry bias in upper and middle troposphere and in regions of deep convection
Time-varying warm bias in the upper troposphere
Japan Meteorological Agency/Japan. 2013. JRA-55: Japanese 55-year Reanalysis, Daily 3-Hourly and 6-Hourly Data. Research Data Archive at the National Center for Atmospheric Research, Computational and Information Systems Laboratory.
Expert Developer Guidance
The following was contributed by Shinya Kobayashi, Japan Meteorological Agency, December, 2015:
The Japanese 55-year Reanalysis (JRA-55, S. Kobayashi et al. 2015) is a comprehensive climate dataset covering the period from 1958, when regular radiosonde observations began on a global basis, to the present. JRA-55 is the first comprehensive reanalysis to cover the last half-century since the European Centre for Medium-Range Weather Forecasts 45-year Reanalysis (ERA-40, Uppala et al. 2005), and is also the first to apply four-dimensional variational analysis (4D-Var) to this period. The main objectives of JRA-55 were to address issues found in previous reanalyses and provide a comprehensive atmospheric dataset suitable for the study of multidecadal variability and long-term trends.
JRA-55 has been produced with the TL319 version of the Japan Meteorological Agency (JMA) operational data assimilation system (as of December 2009), which features numerous improvements made since the Japanese 25-year Reanalysis (JRA-25, Onogi et al. 2007). These include a revised longwave radiation scheme, 4D-Var and variational bias correction for satellite radiances. It also incorporates several newly available observational datasets produced as a result of ongoing efforts to improve quality of past observations, including homogenization of radiosonde temperature observations (Haimberger et al. 2008, 2012) and reprocessing of satellite data at major meteorological satellite centers. These improvements have made JRA-55 products considerably better than JRA-25 products.
What are the key strengths of this data set?
- Two major problems of JRA-25 have been addressed. A cold bias in the lower stratosphere has been diminished, and a dry bias in the Amazon basin has been mitigated.
- The temporal consistency of temperature analysis is improved considerably over that of previous reanalyses.
- It is the first full-observing-system reanalysis to apply 4D-Var to the last half-century.
- With the same numerical weather prediction (NWP) system as that used for JRA-55, the JRA-55C reanalysis assimilating conventional observations only (C. Kobayashi et al. 2014) and JRA-55AMIP Atmospheric Model Intercomparison Project (AMIP)-type simulation have been produced. These are provided along with JRA-55 products to form the JRA-55 family.
What are the key limitations of this data set?
- A dry bias is observed in the upper and middle troposphere and in regions of deep convection.
- Unrealistic weakening trends are observed in analyzed tropical cyclone strength.
- A warm bias in the upper troposphere and a cold bias in the lower troposphere are observed.
- Excessive precipitation is observed over the tropics.
What are the typical research applications of these data? What are examples from your work?
Reanalyses have been used widely for research into the mechanisms of the earth’s climate system, the study of predictability, and climate monitoring. Reanalysis has made especially great contributions to research on synoptic and planetary scale phenomena such as storm tracks, blocking, the Madden-Julian oscillation, the El Niño/Southern Oscillation and the quasi-biennial oscillation, and verification of reproducibility of these phenomena in forecast models. Reanalyses also provide initial conditions and reference data for hindcasts of seasonal forecast systems as well as forcing fields for ocean models and chemistry-transport models.
What are the likely spurious (non-climatic) features, if any, of time series derived from these data?
- JRA-55 exhibits a dry bias in the upper and middle troposphere. The bias tends to diminish slightly as the number of observations from satellite water vapor channels increases.
- Tropical cyclone strength analyzed in JRA-55 exhibits unrealistic trends. This is most likely associated with the artificial weakening trend of wind profile retrievals surrounding tropical cyclones (TCRs) assimilated in JRA-55.
- JRA-55 exhibits a warm bias in the upper troposphere, which gradually decreases as the observing system is improved. The impact of changes in observing systems is particularly apparent for July 2006, when Global Navigation Satellite System-Radio Occultation (GNSS-RO) refractivity data were introduced into JRA-55.
What corrections were applied to account for changes in observing systems, sampling methods or density, and satellite drift or degradation?
In JRA-55, bias correction is applied to radiosonde temperatures and satellite radiances. Further details are provided in S. Kobayashi et al. (2015) Subsection 2.2.a for radiosonde temperatures and Subsection 3.1.a for satellite radiances.
General guidance on processing and interpreting the data
Reanalysis can produce datasets for numerous types of meteorological variables, including those for which observations are sparse, in a physically consistent, spatiotemporally regular manner. However, the reliability of these variables depends on how tightly they are constrained by observations. Considerable uncertainty is especially observed in model diagnostic variables such as precipitation, evaporation, cloud amount and diabatic heating compared with analyzed variables. Great caution is needed when these model diagnostics are used because they are based on model prediction rather than analysis.
In data assimilation systems, products are created via the following analysis cycle: First, forecast models are provided with initial condition data from the most recent analysis in order to generate the background and atmospheric forcing fields necessary for analysis. Next, based on these fields and observations, analysis fields are generated to form the most plausible state of the atmosphere. These fields are then used as initial conditions for the next forecast. Due to the practice of observational correction for forecasts (also known as analysis increment), the energy balance is not exactly preserved in reanalysis. The introduction of analysis increment also creates an artificial sink or source in the water budget, which in turn leads to spin-up issues (in which precipitation is insufficient immediately after the start of forecasts and then gradually increases) or spin-down issues (the reverse) with the hydrological cycle. Great caution is needed when hydrological variables from reanalyses are used, especially for model diagnostic variables such as precipitation and evaporation (Bosilovich et al. 2011; Trenberth et al. 2011).
General strategies for comparison of the data with model output
Some of the numerous meteorological variables included in JRA-55 products (JMA 2013, 2014) are not necessarily of sufficient quality for model evaluation purposes. Users are encouraged to read the JRA-55 comprehensive report (S. Kobayashi et al. 2015) and the works it references to determine whether variables of interest are of sufficient quality for the intended application. In some cases, the use of analysis fields as input for users’ own simulators may be a viable option for generating diagnostic variables with a level of accuracy higher than those of reanalyses.
What are some comparable data sets, if any? Why use this data set instead of another?
Reanalysis efforts are continually undertaken at major NWP centers and meteorological research institutes (a detailed list is available at http://www.reanalyses.org). The quality of recent reanalyses has markedly improved, and new classes of reanalysis currently available include atmosphere-ocean coupled reanalysis and 20th century reanalysis based on data from fixed observing systems. JRA-55 is a full-observing-system reanalysis covering the last half-century. It is designed for high instantaneous accuracy based on the use of as many observations as possible while allowing for the impacts of changes in observing systems.
JRA-55 family
To aid further study of the reproducibilities of low-frequency variability and trends in JRA-55, as well as the impacts of model biases and changes of observing systems, the Meteorological Research Institute has produced a reanalysis assimilating conventional observations only, called JRA-55C, and an AMIP-type simulation, called JRA-55AMIP. These are produced with the same NWP system as used for JRA-55, and they are made available together with JRA-55 products as the JRA-55 family. ##
Cite this page
Acknowledgement of any material taken from or knowledge gained from this page is appreciated:
Kobayashi, Shinya & National Center for Atmospheric Research Staff (Eds). Last modified "The Climate Data Guide: JRA-55.” Retrieved from https://climatedataguide.ucar.edu/climate-data/jra-55 on 2026-07-07.
Citation of datasets is separate and should be done according to the data providers' instructions. If known to us, data citation instructions are given in the Data Access section, above.
Acknowledgement of the Climate Data Guide project is also appreciated:
Schneider, D. P., C. Deser, J. Fasullo, and K. E. Trenberth, 2013: Climate Data Guide Spurs Discovery and Understanding. Eos Trans. AGU, 94, 121–122, https://doi.org/10.1002/2013eo130001
Key Figures
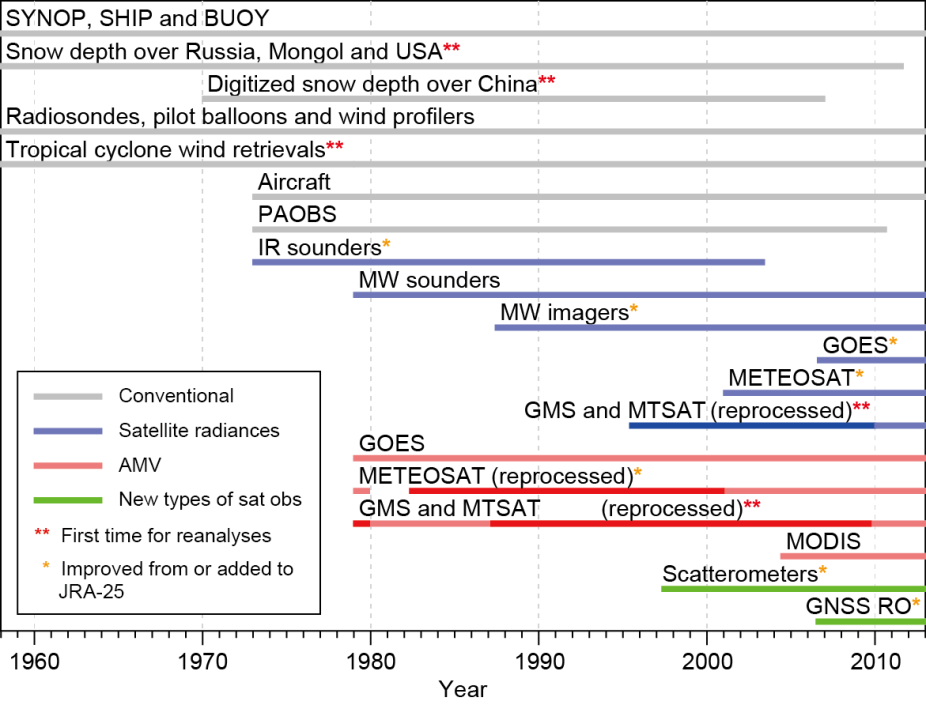
Chronology of observation types assimilated in JRA-55. Adapted and updated from Ebita et al. (2011, Fig. 1) (contributed by S. Kobayashi)
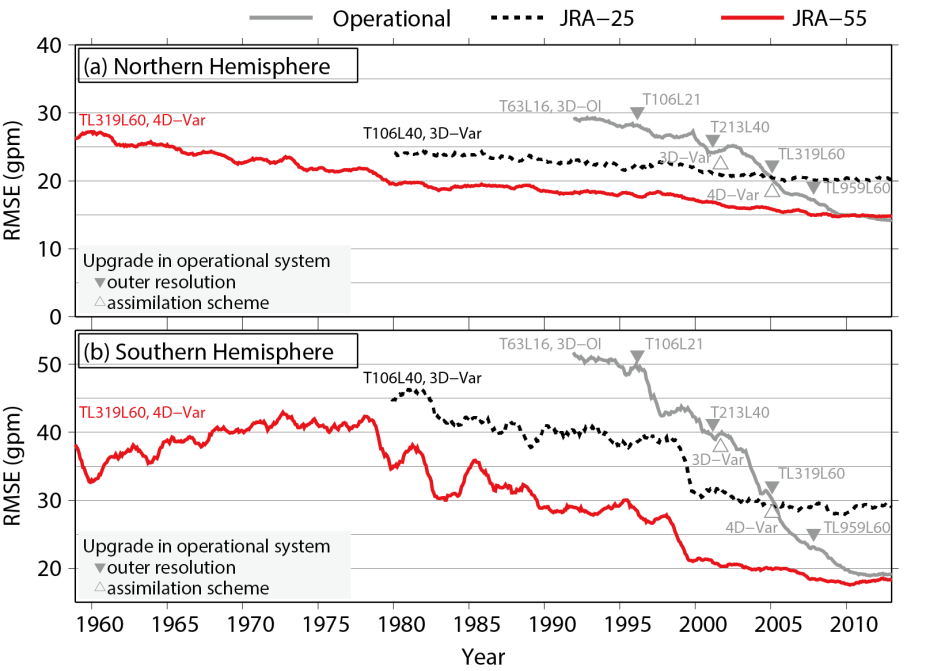
RMS errors of 2-day forecasts of the geopotential height at 500 hPa averaged over the extratropics of the (a) Northern and (b) Southern Hemispheres from JRA-25, JRA-55 and JMA operational system, verified against their own analyses. Changes in the assimilation scheme and resolution of the outer model are also noted. Each value represents the average for the last 12 months. Source: S. Kobayashi et al. (2015, Fig. 12) (contributed by S Kobayashi)

Twelve-month running mean temperature anomalies for the (a) lower stratosphere, (b) upper troposphere, (c) middle troposphere and (d) lower troposphere averaged over 82.5°N to 82.5°S. Time series from RSS V3.3 represents measurements by the MSU channel 4, 3 and 2, and the lower tropospheric extrapolations, whereas those from HadAT2, the NCEP/NCAR reanalysis, ERA-40, JRA-25 and JRA-55 are MSU equivalent brightness temperatures. Anomalies for each dataset were defined relative to their own climatological monthly means over 1979–1998. Source: S. Kobayashi et al. (2015, Fig. 14) (contributed by S Kobayashi)
Other Information
- Kobayashi, S. et al (2015): The JRA-55 Reanalysis: General Specifications and Basic Characteristics
- Ebita, A. et al (2011): JRA 55 Interim Report. Sci. Online Lett. on the Atmos., 7, 149-152
- Chen, G., T. Iwasaki, H. Qin, and W. Sha, 2014: Evaluation of the Warm-Season Diurnal Variability over East Asia in Recent Reanalyses JRA-55, ERA-Interim, NCEP CFSR, and NASA MERRA. J. Climate, 27(14), 5517-5537
- Bosilovich, M. G. et al., 2011: J. Climate, 24, 5721-5739.
- Haimberger, L. et al., 2008: J. Climate, 21, 4587-4606.
- Haimberger, L. et al., 2012: J. Climate, 25, 8108-8131.
- JMA, 2013: JRA-55 product users’ handbook: 1.25-degree latitude/longitude grid data. JMA, Japan, 22 pp.
- JMA, 2014: JRA-55 product users’ handbook: Model grid data. JMA, Japan, 31 pp.
- Kobayashi, C. et al., 2014: Preliminary results of the JRA-55C. SOLA, 10, 78-82.
- Onogi, K. et al. 2007: J. Meteor. Soc. Japan, 85, 369-432.
- Trenberth, K. E. et al., 2011: J. Climate, 24, 4907-4924.
- Uppala, S. M. et al., 2005: Quart. J. Roy. Meteor. Soc., 131, 2961-3012.