Atmospheric Rivers: The Atmospheric River Tracking Method Intercomparison Project (ARTMIP)
ARTMIP is the Atmospheric River Tracking Method Intercomparison Project. The goal of ARTMIP is to provide the community with the data necessary to quantify Atmospheric River (AR) uncertainty due to how ARs are defined or identified in gridded datasets.
Atmospheric rivers (ARs) are dynamically driven, filamentary structures that account for ~90% of poleward water vapor transport outside of the tropics, despite occupying only ~10% of the available longitude (Zhu and Newell 1998). They are often associated with extreme winter storms and heavy precipitation along the western coasts of mid-latitude continents and have the ability to produce major flooding events and/or relieve droughts.
ARTMIP provides a large set (10+) of historical AR catalogues, each created with a unique AR detection tool (ARDT). These catalogues are designed to be compared; metrics such as frequency, duration, and footprint can be consistently quantified across ARDTs using the same exact dataset. ARTMIP is divided into “Tier 1” and “Tier 2” where Tier 1 is the baseline control and consists of AR catalogues created using ARTMIP-computed AR tracking data generated from MERRA-2. Tier 2 includes a wide variety of sensitivity datasets and currently includes catalogues created using source data from: (1) ERA5, (2) JRA55 and JRA55-C, (3) 25km climate model output from CAM5 historical and RCP8.5 scenario simulations, (4) select CMIP5/6 historical and high emissions scenario simulations, (5) CESM2 paleoclimate data for low CO2 (mean state), (5) CESM2 paleoclimate data for variations on orbital parameters (seasonality). ARTMIP is currently curating ARDT catalogues designed to examine differences in Polar regions which will be released soon.
Key Strengths
ARTMIP provides data from numerous independent AR detection tools (ARDT), each applied to the same atmospheric reanalysis data
All data are hosted on the NCAR Research Data Archive (RDA) in a generally common format (note issues with longitude discussed in the expert guidance). The repository will be updated as more ARDTs are added.
The large number of ARDT catalogues allow for quantification uncertainty due to detection method by applying analyses to a suite of ARDTs.
Key Limitations
Catalogues are only available for the specific datasets and experiments used by ARTMIP
Information on ARs is limited to binary flags that indicate the presence or absence of an AR at each grid point and each timeslice. 0 indicates no AR and 1 indicates the presence of an AR. Not all datasets provide spatial footprints globally. No lagrangian tracking information is available (i.e. AR paths, similar to TC tracks). Note that some of this information may be available by individual groups, but is not collected as a part of ARTMIP.
There is some missing data and errata as the data collection develops. See the ARTMIP RDA webpages for up-to-date information.
All papers using ARTMIP data or analysis should cite the GMD paper (Shields et al. 2018) and Tier 1 overview paper (Rutz et al. 2019).
All papers using ARTMIP catalogues should cite the DOI numbers for catalogues and source data.
- Data Access Information on the ARTMIP Webpage
- NCAR RDA Page: Tier 1 (MERRA2, Jan 1980-Jun 2017)
- NCAR RDA Page: Tier 2 catalogues for CMIP5/6 subtopics
- NCAR RDA Page: Tier 2 catalogues for High Resolution Climate Change
- NCAR RDA Page: Tier 2 catalogues for Reanalysis Intercomarison
- NCAR RDA Page: Tier 2 catalogues for Paloeclimate
Expert User Guidance
What are the typical research applications of this data set?
AR metrics computation and uncertainty quantification, either globally or regionally (where available). Metrics include information such as frequency of occurrence, duration, spatial footprint (where applicable), seasonality, etc. See Figure 1 below for an example time step.
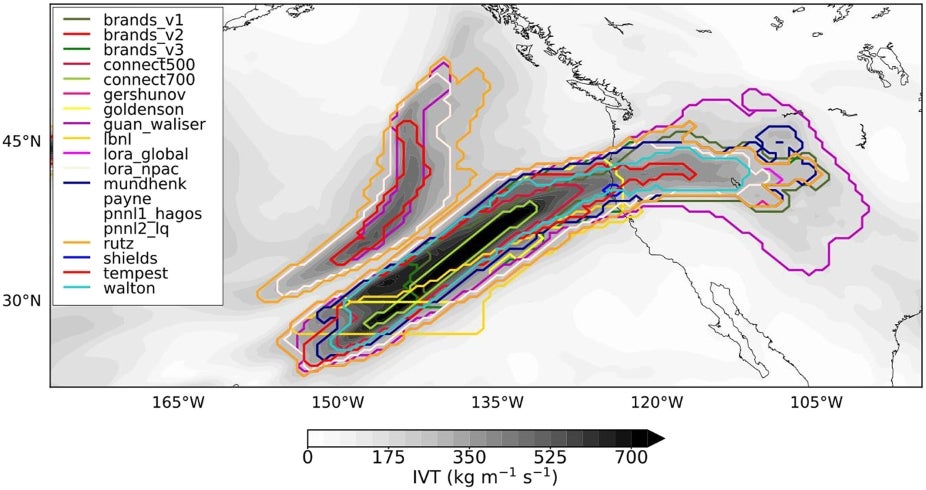
Figure 1: A single time slice of MERRA2 with 19 ARDTs applied. The greyscale field shows Integrated Vapor Transport (IVT), a metric of moisture transport. The colored lines show regions in which ARs have been identified by the various ARDTs.
Rutz et al. (2019) with permission by C. Shields
What are the most common mistakes that users encounter when processing or interpreting these data?
Catalogues adopt metadata information from their source data, i.e. MERRA-2 IVT data, CAM5 data, etc. Each source data has different conventions, so different experiments will sometimes have different meta data. One common mistake when comparing across datasets is having “flipped” longitudes (i.e. -180 to +180 vs 0 to 360).
Unfortunately, not all of the Tier catalogue data adhered to ARTMIP formatting standards when it was submitted to the project, so not all catalogues have the same longitude and latitude conventions. It is up to the user to make sure each ARDT lat/lon conventions match those they are being compared against. This is noted in the errata.
What are some comparable data sets, if any?
There are no comparable datasets documenting atmospheric rivers.
How is uncertainty characterized in these data?
By its nature, the wide choice of ARDT catalogues created from a common dataset allows for researchers to compare their own ARDTs, or understand uncertainty in AR metrics for a given science/sensitivity question.
Were corrections made to account for changes in observing systems or practices, sampling density, satellite drift, or similar issues?
For Tier 2 Paleo, we applied a standardization across submitted catalogues, so this is the easiest dataset to compare across all ARDTs. ARTMIP is a volunteer effort, and we have not been able to retroactively standardize other datasets.
How useful are these data for characterizing means as well as extremes?
Full distributions can be computed because we provide sub-daily, multi decadal catalogue timeseries, i.e. mean, median, consensus, standard deviation, and extremes can be computed for each dataset.
How does one best compare these data with model output?
We provide both reanalysis- and model-derived datasets of Atmospheric Rivers. If users want to compare their simulations with ARTMIP, they can run their desired ARDT on their dataset to create their unique AR catalogues, then compare with ARTMIP spread for context.
How do I access these data?
RDA, link on ARTMIP webpage https://ncar.github.io/ARTMIP/policies.html
How frequently are the data updated?
Periodically, we have updated Tier 1 MERRA-2 data, as well as added new experiments. In general, for Tier 2 experiments, once published, datasets are not updated.
Is there any publicly available code that illustrates how to access and analyze these data? If so, where?
We will be linking Github pages from ARDT developers to the ARTMIP webpage, but this is pending. However, one current tool available now is described in Dong et al. (2025).
Cite this page
Acknowledgement of any material taken from or knowledge gained from this page is appreciated:
National Center for Atmospheric Research Staff (Eds). Last modified "The Climate Data Guide: Atmospheric Rivers: The Atmospheric River Tracking Method Intercomparison Project (ARTMIP).” Retrieved from https://climatedataguide.ucar.edu/climate-data/atmospheric-rivers-atmospheric-river-tracking-method-intercomparison-project-artmip on 2026-07-21.
Citation of datasets is separate and should be done according to the data providers' instructions. If known to us, data citation instructions are given in the Data Access section, above.
Acknowledgement of the Climate Data Guide project is also appreciated:
Schneider, D. P., C. Deser, J. Fasullo, and K. E. Trenberth, 2013: Climate Data Guide Spurs Discovery and Understanding. Eos Trans. AGU, 94, 121–122, https://doi.org/10.1002/2013eo130001