CCMP: Cross-Calibrated Multi-Platform wind vector analysis
The CCMP wind analysis is a near-global, high spatial and temporal resolution gridded dataset of surface wind vectors spanning 1987-present. The input data are a combination of inter-calibrated satellite data from numerous radiometers and scatterometers and in-situ data from moored buoys. An algorithm finds a best-fit solution to all of the available observations, using the ERA-Interim reanalysis winds as a first guess. The temporal record is relatively stable, and the data are recommended for studies of daily to interannual variability. The analysis generally performs poorly in rain and under high wind conditions, and is not well suited for studies of global wind trends. Please see more details in the "Expert Guidance" tab.
Key Strengths
Key Limitations
Wentz, F.J., J. Scott, R. Hoffman, M. Leidner, R. Atlas, J. Ardizzone, 2015: Remote Sensing Systems Cross-Calibrated Multi-Platform (CCMP) 6-hourly ocean vector wind analysis product on 0.25 deg grid, Version 2.0, [indicate date subset, if used]. Remote Sensing Systems, Santa Rosa, CA. Available online at www.remss.com/measurements/ccmp. [Accessed dd mmm yyyy]. *Insert the appropriate information in the brackets.
Expert Developer Guidance
The following was contributed by Lucrezia Ricciardulli of Remote Sensing Systems, May, 2016:
Brief Overview of CCMP Wind Analysis
The Cross-Calibrated Multi-Platform (CCMP) is a gridded wind vector analysis dataset produced by using satellite and buoy wind measurements, and a background model wind field all integrated into 6-hourly global maps at 0.25 deg resolution. The focus of this wind analysis is to provide users with satellite-based consistent and gap-free surface wind over the globe at high spatial and temporal resolution. This dataset starts in 1987, and is well suited for model comparisons.
The original dataset CCMP V1.1 was developed by Robert Atlas and his team. It incorporates microwave satellite observations processed at Remote Sensing Systems, in situ observations from moored buoys, and the ECMWF operational model wind as a background, by using a Variational Analysis Method (VAM). The method is described in detail in Atlas et al, 1996, Hoffman et al, 2003, and Atlas et al, 2011. The original V1.1 CCMP product was processed incrementally, over a number of years, in small batches using the satellite data available at the time of processing, and therefore, assimilated inconsistently-processed satellite winds. Funding for the original CCMP ended in 2012, and the last processed winds refer to December 2011. Motivated by the considerable demand for the continuation of this widely used dataset, in 2015 the processing code was transferred to Remote Sensing Systems with the objective of producing an updated, improved, and consistently reprocessed version of the vector wind analysis, CCMP V2.0 [Scott et al, 2016].
CCMP V2.0 Product details
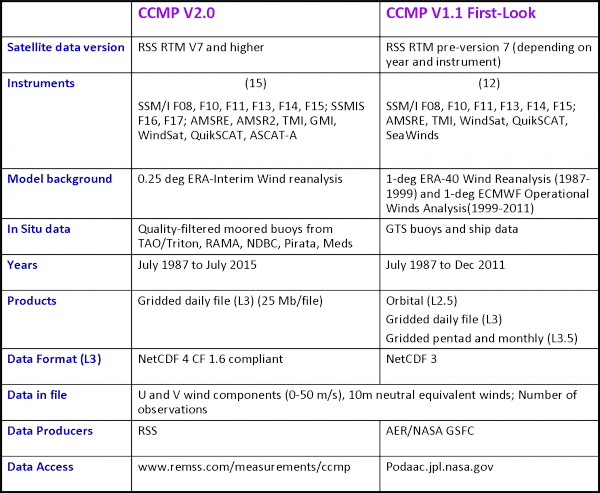
The datasets used as input in the CCMP V2.0 are listed in Table 1. The satellite data include active instruments (Scatterometers, QuikSCAT and ASCAT) and passive microwave sensors (Radiometers, SSM/I, SSMIS, TMI, GMI, AMSR2, AMSRE, WindSat). The radiometers and scatterometer data have all been intercalibrated to a high level of consistency, using the Remote Sensing Systems Radiative Transfer Model (RTM) V7 or higher as intercalibration target [Ricciardulli et al, 2012; Wentz, 2013; Wentz, 2015; Ricciardulli and Wentz, 2015; Ricciardulli, 2016; Wentz, 2016;]. In situ data include quality-controlled global moored buoys from different sources. The CCMP methodology finds a solution that best fits all the observations using the model-based background wind as a first-guess. The original CCMP used ECMWF 1 deg winds. The new CCMP V2.0 uses the 0.25 deg, 6-hourly Era-Interim as background.
An in-depth description on the CCMP V2.0 dataset and access to the data files can be found at http://www.remss.com/measurements/ccmp
Uncertainties and Stability of the Data Record
A measure of the uncertainties associated with the CCMP V2.0 Wind vector analysis has been established by comparing it with each satellite data source individually. At the hourly and 0.25 deg scale, the CCMP is practically unbiased versus each satellite datasets for winds lower than 15 m/s. At higher wind speeds, CCMP V2.0 data are lower than satellite observations by about 3-4%. At those wind speeds, the ERA-Interim used as background field is known to underestimate winds compared to satellites. Since the VAM assimilation method integrates both the satellite and background field, at high winds the wind analysis will often result in a wind field lower than the satellite-only estimates. In this first reprocessed version V2.0, no correction has been applied to any of the datasets, including the Era-Interim. In a future CCMP reprocessing, an adjustment will be applied to the Era-Interim background field at high winds in order to make them consistent with satellite data. The standard deviation between CCMP and satellite winds is on average of the order of 0.5-0.7 m/s, and higher for higher winds (1.5 m/s for 25 m/s wind speeds).
At monthly-averaged global scales, the uncertainties are very small, of the order of 0.1 m/s, and the timeseries is very stable. Figure 3 displays the timeseries of the differences between CCMP V2.0 and ASCAT data, for each 0.25 deg gridpoint interpolated at the time of the ASCAT observation, and then averaged over a month in the latitude range between 55NS (red line). The timeseries of the differences is very stable, with values within 0.05 m/s. For comparison, the figure also shows the timeseries of differences between ASCAT and QuikSCAT (blue), WindSat (green) and the NCEP GDAS winds (thin black line). All the satellite data are consistent with each other within 0.1 m/s, and stable over time. The comparison between ASCAT and NCEP GDAS highlights a spurious jump at the end of 2009 due to the change in assimilated observations in the NCEP at the end of the QuikSCAT mission. The aim of this figure is to illustrate that CCMP is well-suited for studies of temporal variability at interannual time scales, while other model analysis datasets, like NCEP GDAS, suffer from spurious trends and should be used with caution for climate variability studies.
Key Strengths
- Data continuity, no gaps, 1987-2015.
- Global coverage 78NS
- Satellite-based, based on recently intercalibrated satellite data.
- Stability of the temporal record
- Gridded, high spatial and temporal resolution: 0.25 deg, 6-hourly.
- Well established and documented methodology
- Timeseries being produced past 2015. Unless CCMP version gets changed, the most current processed data are just added to the collection.
- NetCDF files
- Well-suited for analysis of high frequency (daily) to interannual variability, ENSO events, both at global and regional scale.
Limitations and warnings
- Data latency: Processed with a data latency of 6-12 months, due to periodical buoy update.
- Future reprocessing: Version V2.0 methodology was kept very similar to V1.1. A new version is planned for 2017, including some adjustments of the model background winds at high wind speed to make them more consistent with satellite data.
- Global Trends: At this time, it is not advised to use CCMP V2.0 for analysis of global wind trends, as the actual trend signal is extremely small. This dataset is not well suited for such studies because the ERA-interim background wind field does include some small spurious biases that occur when the new observing systems are added.
- High winds: Caution is advised for data in high winds (greater than 15 m/s).
- Observations in rain: Satellite observations are not incorporated in the presence of rain, because rain often contaminates the satellite wind measurements. Under rainy conditions, the CCMP wind analysis is therefore mostly driven by the ERA-Interim background field and any available in situ observations.
- Version 2.0 is different from V1.1. Users should not mix the two datasets.
- Data not available in the Polar Regions poleward of about 78 deg because the satellite data do not observe winds over sea ice.
##
Cite this page
Acknowledgement of any material taken from or knowledge gained from this page is appreciated:
Ricciardulli, Lucrezia & National Center for Atmospheric Research Staff (Eds). Last modified "The Climate Data Guide: CCMP: Cross-Calibrated Multi-Platform wind vector analysis.” Retrieved from https://climatedataguide.ucar.edu/climate-data/ccmp-cross-calibrated-multi-platform-wind-vector-analysis on 2026-04-30.
Citation of datasets is separate and should be done according to the data providers' instructions. If known to us, data citation instructions are given in the Data Access section, above.
Acknowledgement of the Climate Data Guide project is also appreciated:
Schneider, D. P., C. Deser, J. Fasullo, and K. E. Trenberth, 2013: Climate Data Guide Spurs Discovery and Understanding. Eos Trans. AGU, 94, 121–122, https://doi.org/10.1002/2013eo130001
Key Figures
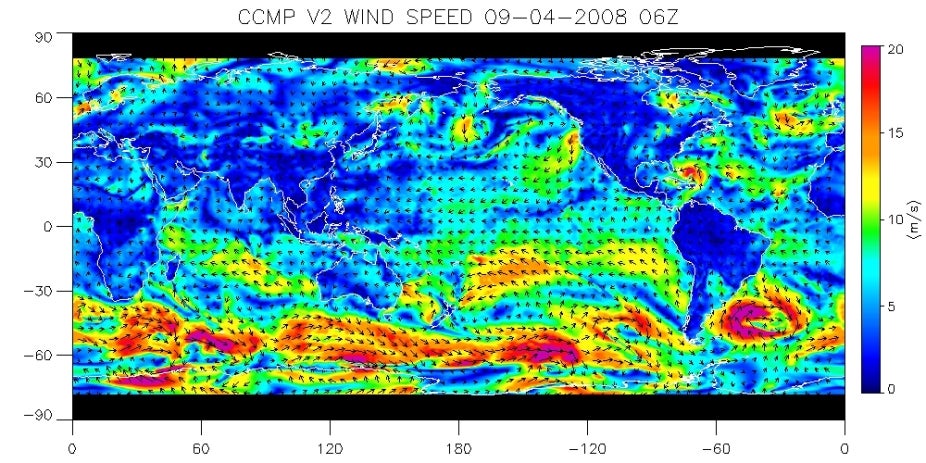
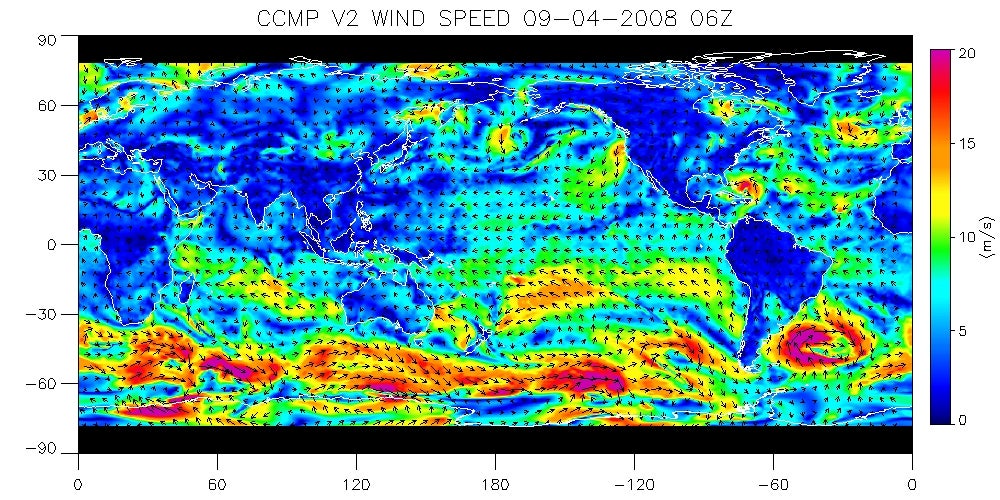
Figure 1 displays a sample CCMP ocean vector wind map from a 6-hourly gridded V2.0 file, for September 4, 2008, 18:00 UTC. Hurricane Ike is visible in the Caribbean. (contributed by L. Ricciardulli)
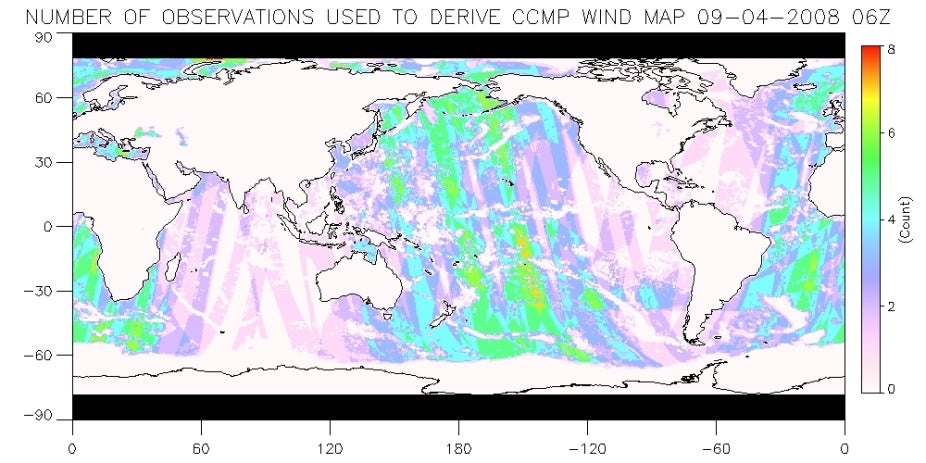
Figure 2 illustrates how many satellite datasets from different instruments were considered in the analysis at each 0.25 deg gridpoint for the map displayed in Figure 1 (Sep 4, 2008, 18 UTC). The satellites included for the date in Figure 1, and their local time of observation at the equator, are: ASCAT (9:30 am/pm) , QuikSCAT (6 am/pm), WindSat (6 am/pm), SSMI 13 (6 am/pm), SSMIS F16 (8 am/pm), SSMIS F17 (6 am/pm), AMSRE (1:30 am/pm), TMI (variable time, non-sun-synchronous satellite). (contributed by L. Ricciardulli)
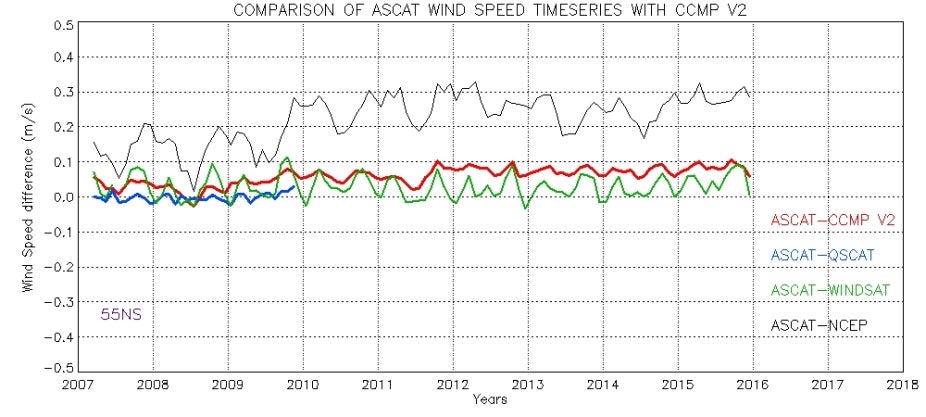
Comparison of ASCAT wind speed timeseries with CCMPv2 (contributed by L. Ricciardulli)
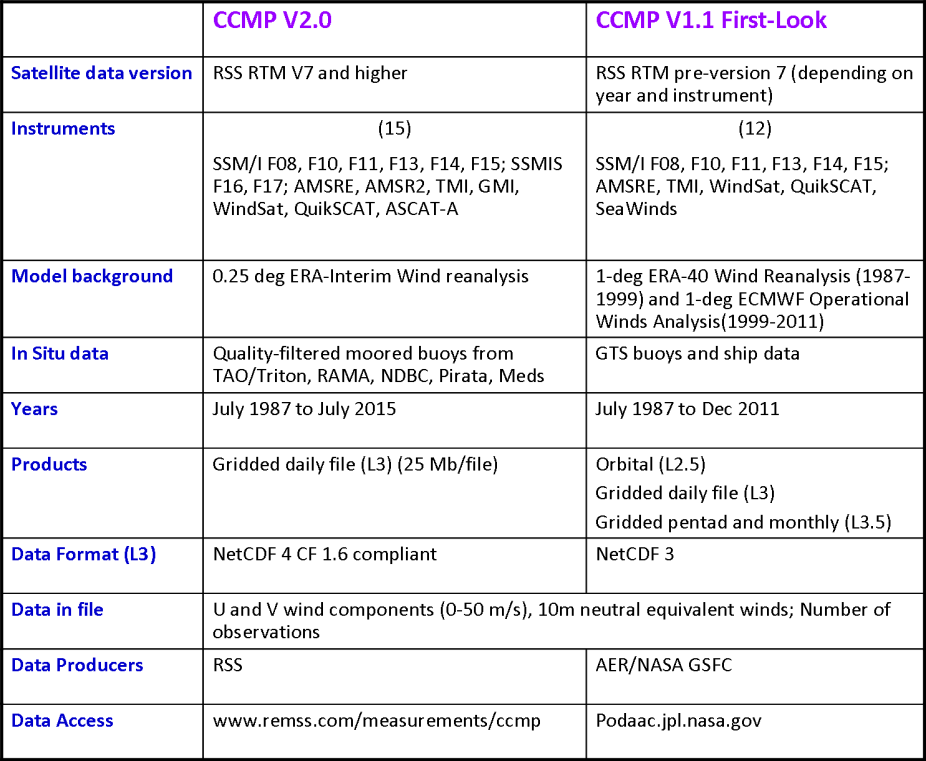
Table 1: Details and comparison of the CCMPv2.0 and CCMP V.1.1 (contributed by L. Ricciardulli)