CERA-20C: ECMWF's Coupled Ocean-Atmosphere Reanalysis of the 20th Century

The CERA-20C is a global, coupled reanalysis spanning 1901-2010 with a focus on low-frequency climate variability. Similar to ERA-20C, the surface observations assimilated include surface pressures from the International Surface Pressure Databank v3.2.6 and ICOADS v 2.5.1, and surface winds over the oceans from ICOADSv2.5.1. Upper-air and satellite data are omitted. In contrast to ERA-20C, CERA-20C makes uses of a newer assimilation system that simultaneously ingests atmospheric and ocean observations (temperature and salinity from EN4) into a coupled Earth system model. The air-sea coupling leads to a more balanced system, without the spurious trends in surface heat fluxes evident in products like ORA-20C and ERA-20C.
In addition, CERA-20C is based on the Ensemble of Data Assimilation (EDA) technique which runs an ensemble of ten independent and perturbed assimilation systems to explicitly account for errors in the observations and in the forecast model. The information from the ten members is used during the assimilation to compute a flow-dependent background error, which determines how to spread the information from observations in space. The ensemble technique also aims to provide an indication of the confidence in the data. Finally, CERA-20C uses an updated model forecast system (vintage 2016) compared to ERA-20C (vintage 2012).
Together, the improved error estimation, coupling, and updated model lead to a marked improvement in CERA-20C's forecast skill score over ERA-20C. Still, the CERA-20C does not provide the "best estimate" of the atmospheric and oceanic states during the modern period (post ~1979) when more comprehensive observations are available.
Key Strengths
Key Limitations
Laloyaux, P., Balmaseda, M., Dee, D., Mogensen, K. and Janssen, P. (2016), A coupled data assimilation system for climate reanalysis. Q.J.R. Meteorol. Soc., 142: 65-78. doi:10.1002/qj.2629
Expert Developer Guidance
The following was contributed by Dr. Patrick Laloyaux at ECMWF, March, 2017:
This page explores the specifics of the two 20th century reanalyses produced at ECMWF, namely ERA-20C and CERA-20C.
Similar strengths
- The records are gap-free, long (over 100 years), and represent many essential climate variables (multivariate) with the same resolution (210 km in the horizontal, 91 vertical levels).
- The atmospheric general circulation model is forced by historical time-varying changes in greenhouse gases concentrations (CO2), volcanic aerosol, and solar variations
- Products are supported by supplementary material, the data assimilation observation feedback
Similar limitations
- Neither of these two reanalyses continues in near-real-time.
- By voluntarily omitting upper-air and satellite observations, neither reanalysis attempts to provide "best estimates" for the years when these observations are available in large numbers
- Products are affected by changes in the observing system which means that regional trends suggested by these two reanalyses in the Southern hemisphere are at best to be treated with caution
- A significant fraction of tropical cyclones are missed during the first part of the century where the observing system is really sparse
- The atmospheric general circulation model is missing some known anthropogenic forcings, such as changes in land use and irrigation
Major differences
CERA-20C includes an ocean and sea-ice model to provide dynamical feedback to the atmosphere during the assimilation and to deliver more climate variables.
ERA-20C is based on the IFS cycle 38r1 (implemented on 19 June 2012) while CERA-20C is based on the IFS cycle 41r2 (implemented on 8 March 2016).
The use of the Ensemble of Data Assimilation (EDA) technique in CERA-20C provides a flow-dependent background error which should be better and more consistent than the one used in ERA-20C. The ensemble technique also aims to provide an indication of the confidence in the data.
The observation error over the 20th century has been reviewed based on the experience gained from ERA-20C to introduce a time-varying error in CERA-20C compared to a constant error in ERA-20C. This should be more realistic and reflect the larger uncertainties in observation timing and location in the early part of the century.
Biases in surface pressure and mean sea level pressure observations are taken into account differently. In CERA-20C, the bias parameters are updated variationally in the 4D-Var assimilation, as additional degrees of freedom, part of the analysis control vector. The approach used in ERA-20C was slightly different as the bias computation was performed before 4D-Var assimilation. This alternative aims to avoid any interaction with the model background and to have a better control on the response time to breaks in bias characteristics.
Quality control (QC) of observations has been improved in CERA-20C based on the experience gained from ERA-20C. A new blacklist has been derived to automatically reject spurious observation timeseries identified from the ERA-20C observation feedback.
Consequences regarding data quality
Although ERA-20C and CERA-20C assimilate the same atmospheric observations (surface pressures and surface winds over the ocean from ISPD v3.2.6 and ICOADS v 2.5.1), the forecast skill scores have been significantly improved thanks to the more recent IFS cycle, the use of the EDA technique and the ocean coupling implemented in the CERA-20C reanalysis (Figure 1).
The better specification of the background and observation errors in CERA-20C produce more realistic mean sea level pressure trend over Antarctica without the spurious drift present in ERA-20C and 20CR. However the trend in CERA-20C is affected by the assimilation of wrong measurements which produce systematic positive increments and an increase in the mean sea level pressure around 1950 (Figure 2).
The ocean coupling implemented in CERA-20C allows to represent Tropical Instability Waves (TIWs) and the atmosphere is responding accordingly with the surface wind stress sensitive to the ocean TIWs (Figure 3).##
Cite this page
Acknowledgement of any material taken from or knowledge gained from this page is appreciated:
Laloyaux, Patrick & National Center for Atmospheric Research Staff (Eds). Last modified "The Climate Data Guide: CERA-20C: ECMWF's Coupled Ocean-Atmosphere Reanalysis of the 20th Century.” Retrieved from https://climatedataguide.ucar.edu/climate-data/cera-20c-ecmwfs-coupled-ocean-atmosphere-reanalysis-20th-century on 2026-02-07.
Citation of datasets is separate and should be done according to the data providers' instructions. If known to us, data citation instructions are given in the Data Access section, above.
Acknowledgement of the Climate Data Guide project is also appreciated:
Schneider, D. P., C. Deser, J. Fasullo, and K. E. Trenberth, 2013: Climate Data Guide Spurs Discovery and Understanding. Eos Trans. AGU, 94, 121–122, https://doi.org/10.1002/2013eo130001
Key Figures
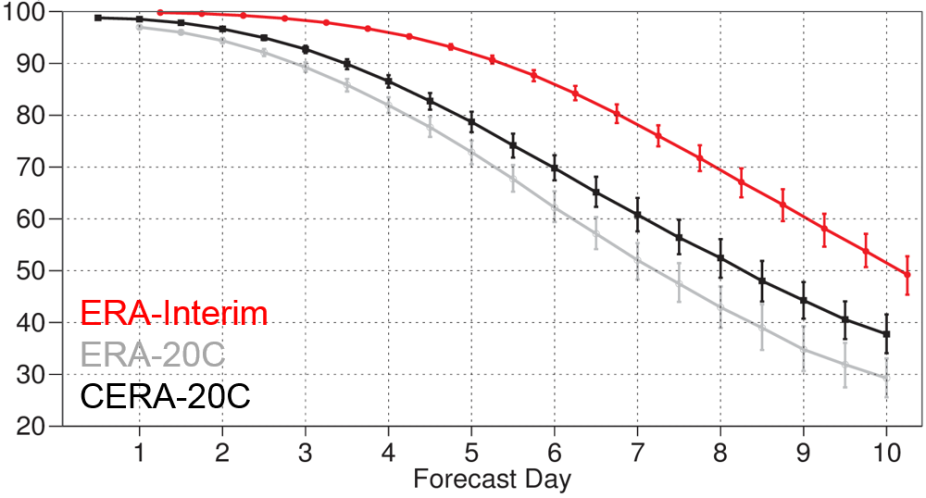
Figure 1 Anomaly correlation coefficient (ACC) of Northern hemisphere 500 hPa geopotential height in ERA-Interim, ERA-20C and CERA-20C. Scores are aggregated over 1st March 2010 to 1st June 2010 and the ECMWF operational analysis is used as reference. ERA-interim has the highest ACC as the full observing system including upper-air and satellite observations is assimilated. CERA-20C scores have been improved by at least 0.5 day compared to ERA-20C thanks to the use of a more recent IFS cycle and the EDA technique. (contributed by P. Laloyaux)
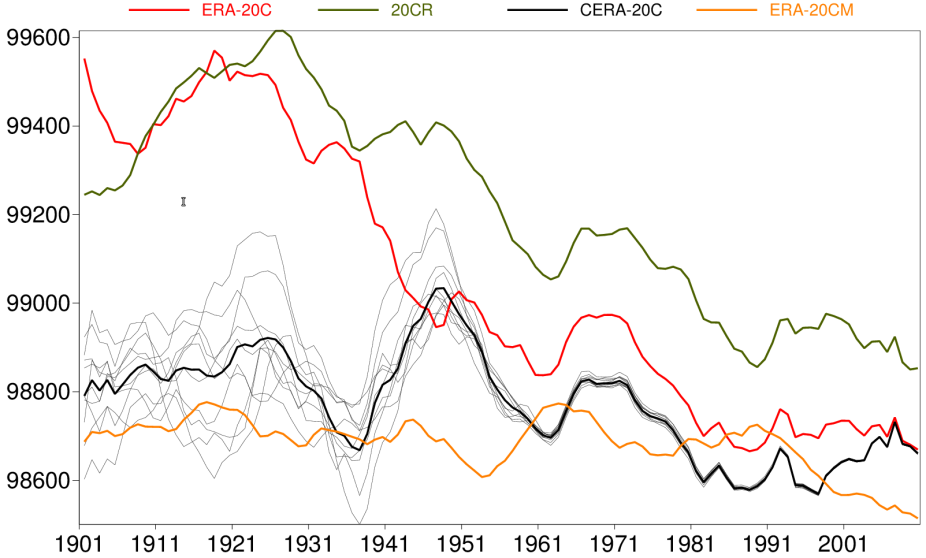
Figure 2 Time series of mean sea level pressure (MSLP) for the latitudes 90°S–60°S averaged over the period September-November each year in one model integration (ERA-20CM) and various reanalyses (ERA-20C, NOAA 20CR, CERA-20C). The trend in CERA-20C looks more realistic without the spurious drift present in ERA-20C and 20CR. This has been linked to the better specification of background and observation errors in CERA-20C. (contributed by P. Laloyaux)
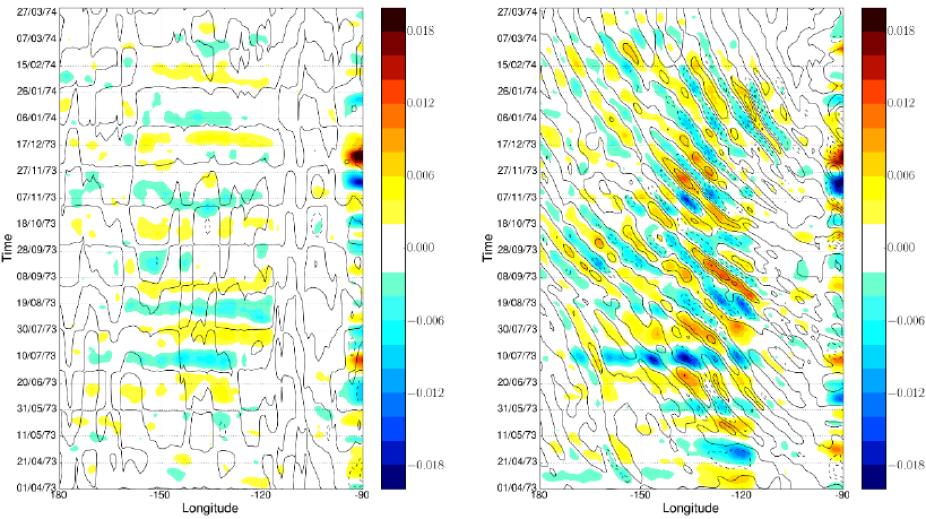
Figure 3 Spatially high-pass filtered wind stress (shading) and sea-surface temperature (contours) for ERA-20C (left) and CERA-20C (right) over the period 01/04/73 to 27/03/74. CERA-20C represents the Tropical Instability Waves (TIWs) thanks to the ocean dynamics and the atmosphere is responding accordingly with the surface wind stress sensitive to the ocean TIWs. In ERA-20C, there is no TIWs and wind stress signals. (contributed by E. de Boisseson)
Other Information
- Laloyaux, P., Balmaseda, M., Dee, D., Mogensen, K. and Janssen, P. (2016), A coupled data assimilation system for climate reanalysis. Q.J.R. Meteorol. Soc., 142: 65-78. doi:10.1002/qj.2629
- Laloyaux, P., de Boisséson, E., Dahlgren, P. (2016), CERA-20C: An Earth system approach to climate reanalysis. ECMWF newsletter, 150: 25-30. doi:10.21957/ffs36birj2