Extended Edited Synoptic Cloud Reports Archive (EECRA) from Ships and Land Stations Over the Globe
"The Extended Edited Synoptic Cloud Reports Archive makes use of routine synoptic observations made by humans on ships over the ocean and at weather stations over land. Following the synoptic code (WMO, 1974), observers report the fraction of sky dome covered by all clouds, the fraction of sky dome covered by clouds in the lowest layer, the cloud type at low, mid, and high levels, the height of cloud base, and the present weather condition. The EECRA developers applied quality control to raw reports obtained from several sources and compiled them into a single collection (Hahn et al., 2009). Coincident measurements of sea level pressure, wind speed and direction, air temperature, dew point depression, and sea surface temperature (over ocean) are included so the user can analyze surface meteorological conditions associated with the reported clouds." -from Expert User Guidance by Dr. Joel Norris.
Key Strengths
Key Limitations
Expert User Guidance
The following was contributed by Joel Norris (Scripps Institution of Oceanography), September, 2013:
Complete List of Strengths and Limitations:
Key Strengths
- Longest global record of cloud properties over land and ocean available
- Low-level clouds are observed without obscuration by higher clouds
- Quasi-global coverage, resolved diurnal cycle
- Identification of morphological cloud types qualitatively describes atmospheric state
- Coincident surface meteorological measurements included
Key Weaknesses
- Unidentified temporal inhomogeneities in cloud record over ocean and some land regions
- Mid-level and high-level clouds are often obscured by lower clouds
- A large fraction of tropical ocean, southern ocean, and tropical land are sparsely sampled
- No quantitative information on cloud optical properties
- Sky-dome cover is reported, not horizontal cloud fraction
Guidance:
The Extended Edited Synoptic Cloud Reports Archive makes use of routine synoptic observations made by humans on ships over the ocean and at weather stations over land. Following the synoptic code (WMO, 1974), observers report the fraction of sky dome covered by all clouds, the fraction of sky dome covered by clouds in the lowest layer, the cloud type at low, mid, and high levels, the height of cloud base, and the present weather condition. The EECRA developers applied quality control to raw reports obtained from several sources and compiled them into a single collection (Hahn et al., 2009). Coincident measurements of sea level pressure, wind speed and direction, air temperature, dew point depression, and sea surface temperature (over ocean) are included so the user can analyze surface meteorological conditions associated with the reported clouds.
Surface observers report sky dome cover in oktas (eighths). Because sky dome cover includes cloud sides, it is typically larger than true horizontal cloud fraction when cumulus clouds are present. Unlike the case for satellite retrievals, surface observers see low-level clouds without obscuration. Their view of mid- and high-level clouds is blocked, however, when low-level cloudiness is extensive. Total cloud cover and cloud cover of the lowest layer are directly reported, but cloud cover of higher layers are not. If only two cloud types are present, then coverage by the higher layer can be obtained from total and lowest-layer cover via an overlap assumption (usually random). The EECRA provides estimated cloud cover by mid-level and high-level clouds when it is possible to calculate it.
Low cloud types include nine categories of cumulus, stratocumulus, stratus, and/or fog as well as cumulonimbus, which is classified as a low cloud in the synoptic code even though it may have a high cloud top. Middle cloud types include nine categories of altocumulus, altostratus, and/or nimbostratus. High cloud types include nine categories of cirrus, cirrocumulus, and/or cirrostratus. The morphological identification of cloud type by human observers provides a qualitative description of small-scale atmospheric structure and processes that is often not available from satellite datasets and reanalyses (e.g., Norris, 1998). Comparison of coincident cloud observations from EECRA and the International Satellite Cloud Climatology Project indicates that satellites cannot reliably distinguish cumulus/stratocumulus/stratus and cumulonimbus/nimbostratus/thick altostratus using only the distribution of optical thickness and brightness temperature (Hahn et al., 2001).
Because the EECRA is constructed from visual observations, no quantitative information is available on cloud optical thickness, cloud albedo, cloud temperature, cloud phase, cloud particle size and other properties often provided by satellite datasets. The EECRA does include the height of the lowest cloud base according to several broad vertical range intervals. The present weather report in EECRA provides a qualitative description of the type and magnitude of precipitation (if any) that occurred at the time of observation.
Typical observing times for synoptic cloud reports are 0, 3, 6, 9, 12, 15, 18, 21 GMT for land and 0, 6, 12, 18 GMT for ocean, enabling the user to investigate the diurnal cycle of cloudiness. It is important to note that surface observers have difficulty correctly identifying clouds on nights with insufficient lunar illumination (Hahn et al., 1995). These data are flagged in the EECRA so that the user can exclude them if desired.
The EECRA is a non-gridded collection of individual cloud reports from ships and land stations, and the user must apply any desired spatial and temporal averaging. Land stations are irregularly distributed spatially with the greatest density at northern middle latitudes and large gaps at low latitudes. Land stations generally observe clouds regularly every three hours, though many of them do not have records that extend over the entire EECRA time period (1971-2009). Some previous studies (e.g., Hahn et al., 2007) have used a 5°´5° averaging grid for global land data (with gaps in some tropical regions). Ocean cloud observations come from ships and thus are irregularly distributed in space and time. The greatest sampling density occurs at northern middle latitudes with poor sampling over large areas of the tropical and southern ocean except along shipping routes. Some previous studies have used a a 5°´5° averaging grid for climatological analyses of global ocean data and a 10°´10° averaging grid for interannual analyses. Due to sparse temporal sampling, an averaging period over a full season is often required for interannual analyses, and even this may be insufficient in many areas of the southern hemisphere ocean.
It appears that spurious multidecadal cloud variability is present in the ocean component of the EECRA (Bajuk and Leovy, 1998; Norris, 1999; Eastman et al., 2011). The cause of these apparent artifacts has not been identified. Multidecadal cloud variability in the land component of the EECRA appears more reliable, with the exception of spurious changes in cloud type over Russia (Eastman and Warren, 2013). The user should exercise caution in the interpretation of long-term changes in cloudiness over ocean.##
Cite this page
Acknowledgement of any material taken from or knowledge gained from this page is appreciated:
Norris, Joel & National Center for Atmospheric Research Staff (Eds). Last modified "The Climate Data Guide: Extended Edited Synoptic Cloud Reports Archive (EECRA) from Ships and Land Stations Over the Globe.” Retrieved from https://climatedataguide.ucar.edu/climate-data/extended-edited-synoptic-cloud-reports-archive-eecra-ships-and-land-stations-over-globe on 2026-06-07.
Citation of datasets is separate and should be done according to the data providers' instructions. If known to us, data citation instructions are given in the Data Access section, above.
Acknowledgement of the Climate Data Guide project is also appreciated:
Schneider, D. P., C. Deser, J. Fasullo, and K. E. Trenberth, 2013: Climate Data Guide Spurs Discovery and Understanding. Eos Trans. AGU, 94, 121–122, https://doi.org/10.1002/2013eo130001
Key Figures
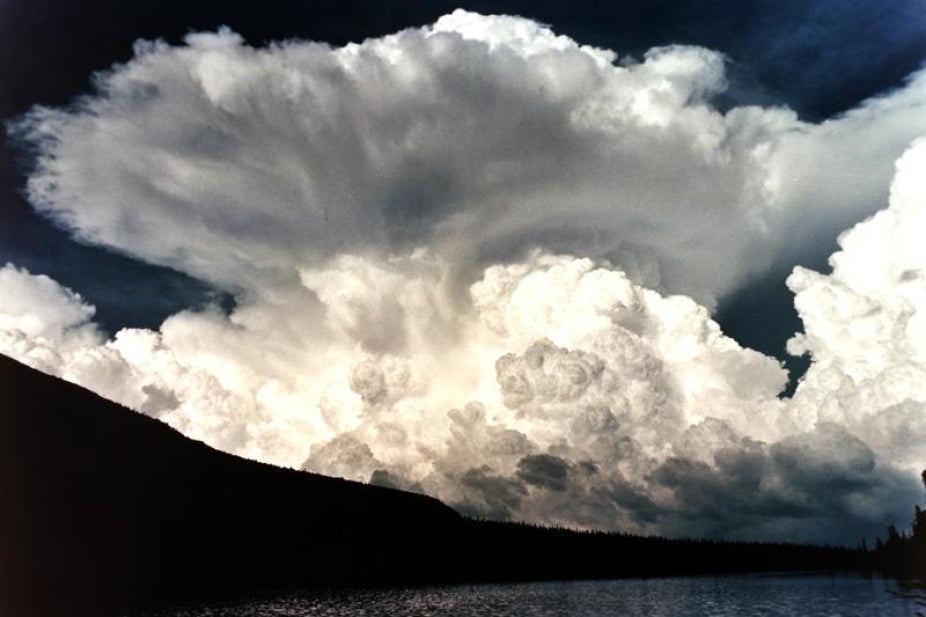
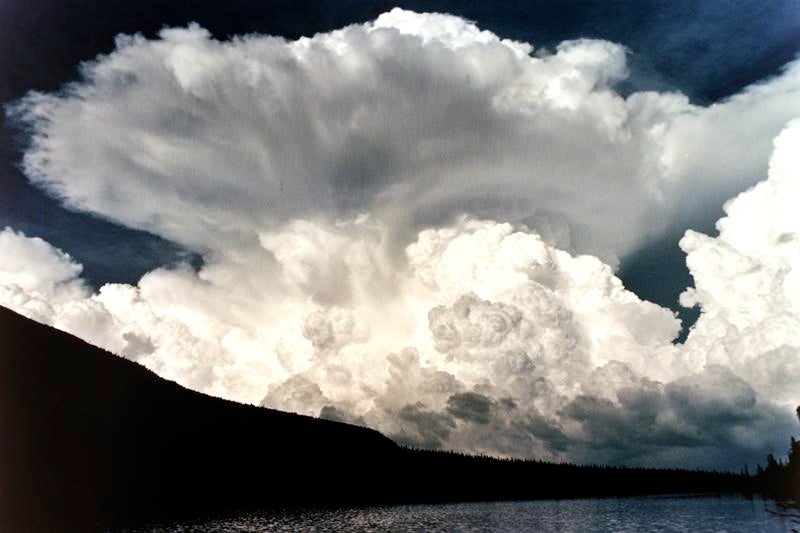
Cumulonimbus over Mitchell Lake on the day of the Big Thompson flood, 1976. [copyright University Corporation for Atmospheric Research, photo by Bob Maddox ]