Landscape surface freeze/thaw status based on passive microwave remote sensing

Key Strengths
Key Limitations
Kim, Y., J.S. Kimball, K.C. McDonald, and J. Glassy, 2011. Developing a global data record of daily landscape freeze/thaw status using satellite passive microwave remote sensing. IEEE Transactions on Geoscience and Remote Sensing, 49(3), 949-960.
Expert Developer Guidance
The following was contributed by John S. Kimball (U. Montana), August, 2012:
A global data record of daily landscape Freeze/Thaw (FT) status was developed through temporal change classification of satellite passive microwave remote sensing brightness temperature retrievals. The FT state parameter derived from satellite microwave remote sensing quantifies the predominant frozen or non-frozen state of the landscape and is closely linked to surface energy budget and hydrologic activity, seasonal dynamics of vegetation growth, terrestrial carbon budgets and land-atmosphere trace gas exchange. Satellite microwave remote sensing is well suited for global FT monitoring due to its relative insensitivity to atmospheric contamination, its independence from solar illumination, and its strong sensitivity to changes in landscape dielectric properties between frozen and thawed conditions. The current FT earth system data record (FT-ESDR) is derived using daily radiometric brightness temperature (Tb) measurement time series at 37GHz (V-pol) frequency from the Scanning Multichannel Microwave Radiometer (SMMR) and the Special Sensor Microwave Imager (SSM/I). The resulting FT-ESDR represents a consistent, daily FT global record that extends from 1979 to 2010, ensuring cross-sensor consistency through pixel-wise adjustment of the SMMR Tb record based on empirical analyses of overlapping SMMR and SSM/I measurements (Kim et al. 2012). The FT-ESDR records are intended for quantifying FT state dynamics over vegetated land areas within a global domain where seasonally frozen temperatures are a major constraint to ecological processes. A detailed description of the FT-ESDR product, methods development and validation scheme is provided by Kim et al. (2011, 2012). These data will be periodically updated to reflect potential algorithm changes and additional years of record. The data are provided in several file format options, including HDF5 and GeoTIFF, with file conversion software designed to enhance data usability. The FT-ESDR data are available for public access via FTP download through the FT-ESDR project web site (http://freezethaw.ntsg.umt.edu) and through the NASA National Snow and Ice Data Center (NSIDC) DAAC.
The FT-ESDR is intended to have sufficient accuracy, resolution, and coverage to resolve physical processes linking Earth’s water, energy and carbon cycles. The product is designed to determine the FT status of the composite landscape vegetation-snow-soil medium to a sufficient level to characterize the frozen temperature constraints to surface water mobility, vegetation productivity, ecosystem respiration and land-atmosphere CO2 fluxes. The FT-ESDR record has been verified against global weather station records and other biophysical data including satellite vegetation greenness and tower CO2 flux measurement networks (Kim et al. 2012). The FT-ESDR product accuracy was assessed in relation to daily maximum and minimum air temperature measurements from approximately 3207 global WMO weather stations; mean annual FT spatial classification accuracies were approximately 91.4 and 84.2 percent for respective PM and AM retrievals over the global domain and long-term record. The FT classification accuracy shows strong seasonal and annual variability and is reduced during active FT transition periods when spatial heterogeneity in landscape FT processes is maximized in relation to the relatively coarse (~25-km) satellite footprint. Additional data quality (QA/QC) metrics were developed and provide more spatially explicit accuracy information, including potential negative impacts of temporal gaps in sensor data time series, precipitation, open water, terrain and land cover heterogeneity effects, and uncertainty associated with use of global reanalysis temperature data to define per grid-cell frozen and non-frozen reference state thresholds for the seasonal threshold algorithm (STA) based FT classifications. The resulting database provides a consistent and continuous, multi-year record of daily (AM and PM) FT dynamics for the global biosphere. The QA maps represent a discrete measure of relative data quality ranging from low (estimated accuracy 70%) to best (accuracy > 90%) quality categories.
The FT-ESDR involves a daily binary FT state classification on a grid cell-by-cell basis, posted to a regular Earth grid. The FT classification algorithm uses a temporal change detection of radiometric Tb time-series that identify FT transition sequences by exploiting the dynamic temporal Tb response to differences in the aggregate landscape dielectric constant that occur as the landscape transitions between predominantly frozen and nonfrozen conditions. Satellite ascending and descending orbital data time series are processed separately to produce information on AM, PM and composite daily FT conditions (CO). Additional variables distinguished by the FT-ESDR include transitional (AM frozen and PM thawed) or inverse transitional (AM thawed and PM frozen) conditions. The global FT-ESDR domain encompasses unmasked vegetated land areas where low temperatures are a significant constraint to annual vegetation productivity as defined from climatological reanalysis data. Masked areas include permanent ice and snow, barren land, open water and regions unconstrained by freezing temperatures. The FT-ESDR map projection is defined in terms of a global cylindrical Equal-Area Scalable Earth (EASE) grid and 25 km spatial resolution.
Cite this page
Acknowledgement of any material taken from or knowledge gained from this page is appreciated:
Kimball, John & National Center for Atmospheric Research Staff (Eds). Last modified "The Climate Data Guide: Landscape surface freeze/thaw status based on passive microwave remote sensing.” Retrieved from https://climatedataguide.ucar.edu/climate-data/landscape-surface-freezethaw-status-based-passive-microwave-remote-sensing on 2026-05-15.
Citation of datasets is separate and should be done according to the data providers' instructions. If known to us, data citation instructions are given in the Data Access section, above.
Acknowledgement of the Climate Data Guide project is also appreciated:
Schneider, D. P., C. Deser, J. Fasullo, and K. E. Trenberth, 2013: Climate Data Guide Spurs Discovery and Understanding. Eos Trans. AGU, 94, 121–122, https://doi.org/10.1002/2013eo130001
Key Figures
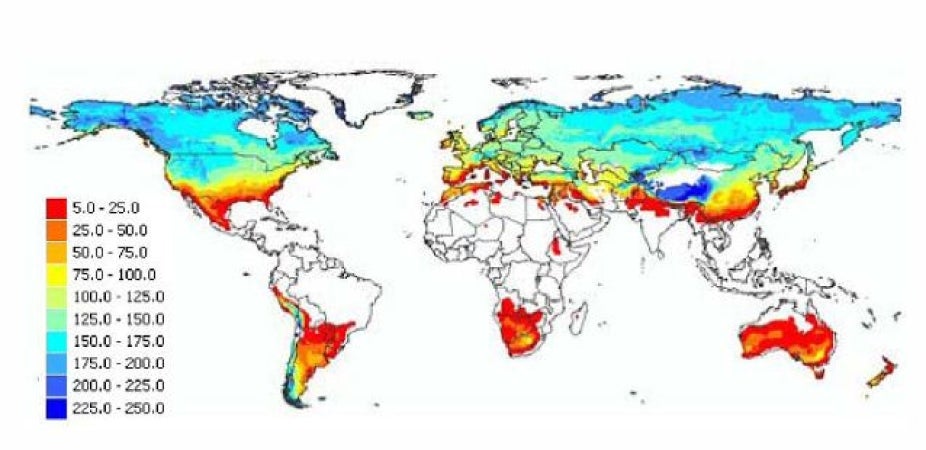
Global FT_ESDR domain defined from a CCI (days yr−1) andGMAO model reanalysis based daily Tmn over a seven-year (2000–2006) period. The FT_ESDR domain includes all vegetated land areas where the CCI ≥ 5 days yr−1 (Kim et al. 2011). (Contributed by J S Kindall)
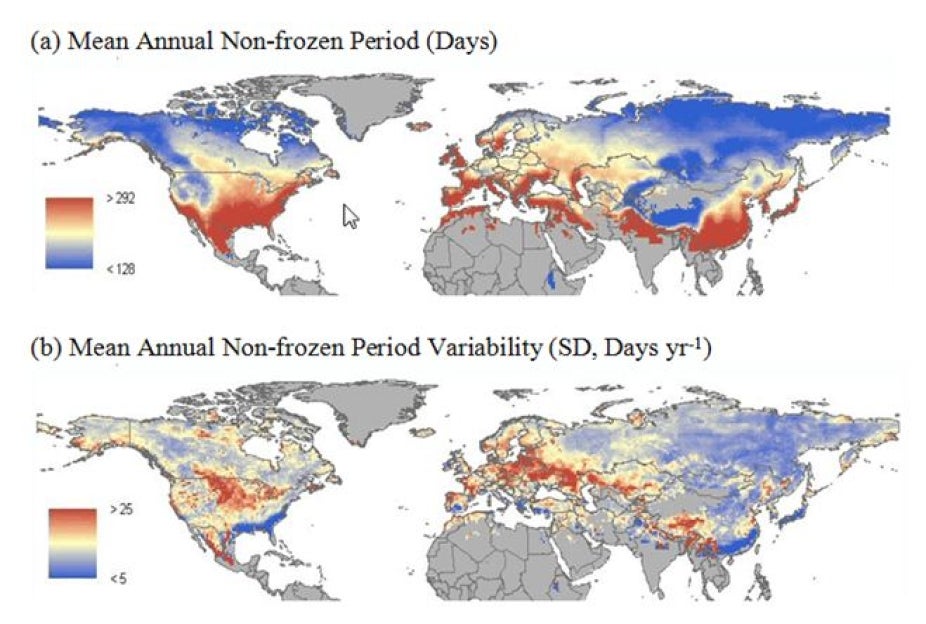
(a) Mean annual non-frozen period (days) and (b) non-frozen period annual variability (SD, days yr-1) derived from the FT-ESDR (1979-2008) record. (Kim et al. 2012). (contributed by J S Kimball)

NH mean annual non-frozen period trend derived from the FT-ESDR relative to the mean annual surface air temperature (Tav) trend from global reanalysis (grey shading denotes Tav uncertainty range). The mean non-frozen season is lengthening (p
Other Information
- Kim, Y., J.S. Kimball, K. Zhang, and K.C. McDonald, 2012. Satellite detection of increasing northern hemisphere non-frozen seasons from 1979 to 2008: Implications for regional vegetation growth. Remote Sensing of Environment 121, 472-487.
- Kim, Y., J.S. Kimball, K.C. McDonald, and J. Glassy, 2011. Developing a global data record of daily landscape freeze/thaw status using satellite passive microwave remote sensing. IEEE Transactions on Geoscience and Remote Sensing, 49(3), 949-960.
- Kim, Y., J.S. Kimball, and K.C. McDonald, 2010. MEaSUREs Global Record of Daily Landscape Freeze/Thaw Status, Version 01 [1988 to 2007]. Boulder Colorado USA: National Snow and Ice Data Center. Digital media (http://nsidc.org/data/nsidc-0477.html ).