MJO: Madden-Julian Oscillation Diagnostics

The US-CLIVAR MJO working group has developed diagnostics for objectively evaluating the MJO. Two WWW sites demonstrate the diagnostics: http://www.ncl.ucar.edu/Applications/mjoclivar.shtml and http://climate.snu.ac.kr/mjo_diagnostics/index.htm. Operational centers monitor the MJO and indicies are available at: http://cawcr.gov.au/staff/mwheeler/maproom/RMM/ and http://www.cpc.ncep.noaa.gov/products/precip/CWlink/daily_mjo_index/mjo_...
Cite this page
Acknowledgement of any material taken from or knowledge gained from this page is appreciated:
National Center for Atmospheric Research Staff (Eds). Last modified "The Climate Data Guide: MJO: Madden-Julian Oscillation Diagnostics.” Retrieved from https://climatedataguide.ucar.edu/climate-data/mjo-madden-julian-oscillation-diagnostics on 2026-02-18.
Citation of datasets is separate and should be done according to the data providers' instructions. If known to us, data citation instructions are given in the Data Access section, above.
Acknowledgement of the Climate Data Guide project is also appreciated:
Schneider, D. P., C. Deser, J. Fasullo, and K. E. Trenberth, 2013: Climate Data Guide Spurs Discovery and Understanding. Eos Trans. AGU, 94, 121–122, https://doi.org/10.1002/2013eo130001
Key Figures
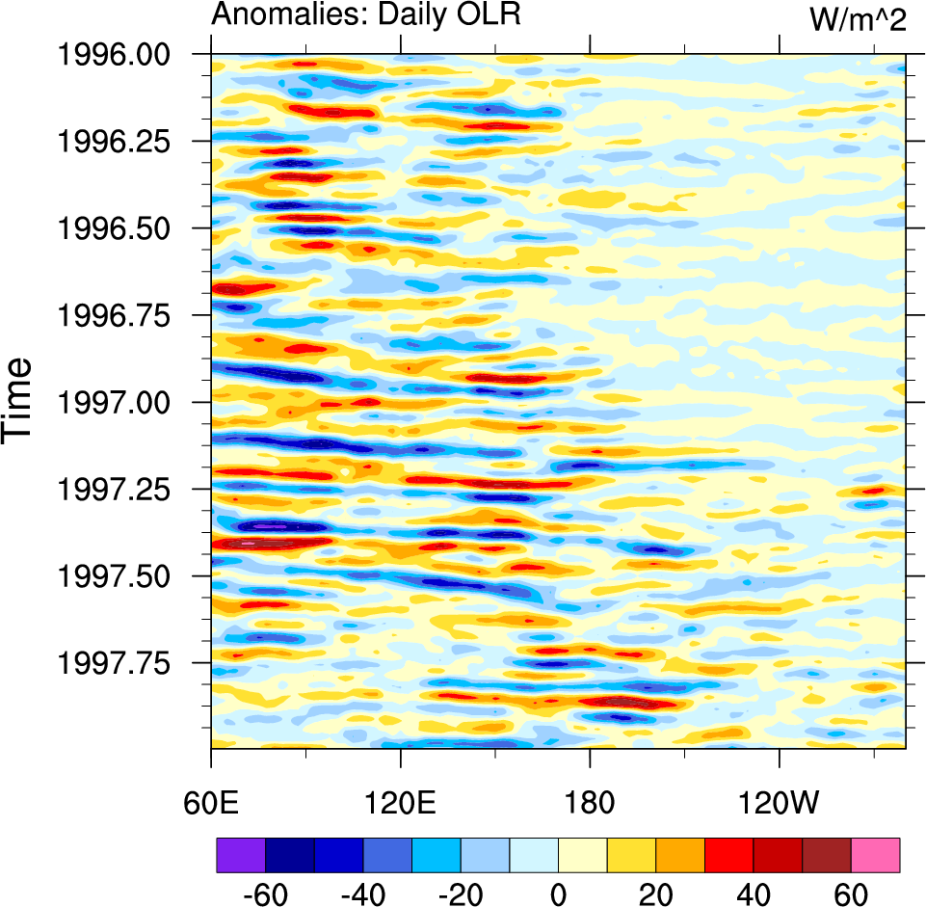
Hovmuller diagram (time vs longitude) for an active MJO two-year period (1996-1997). (Climate Data Guide; D. Shea)
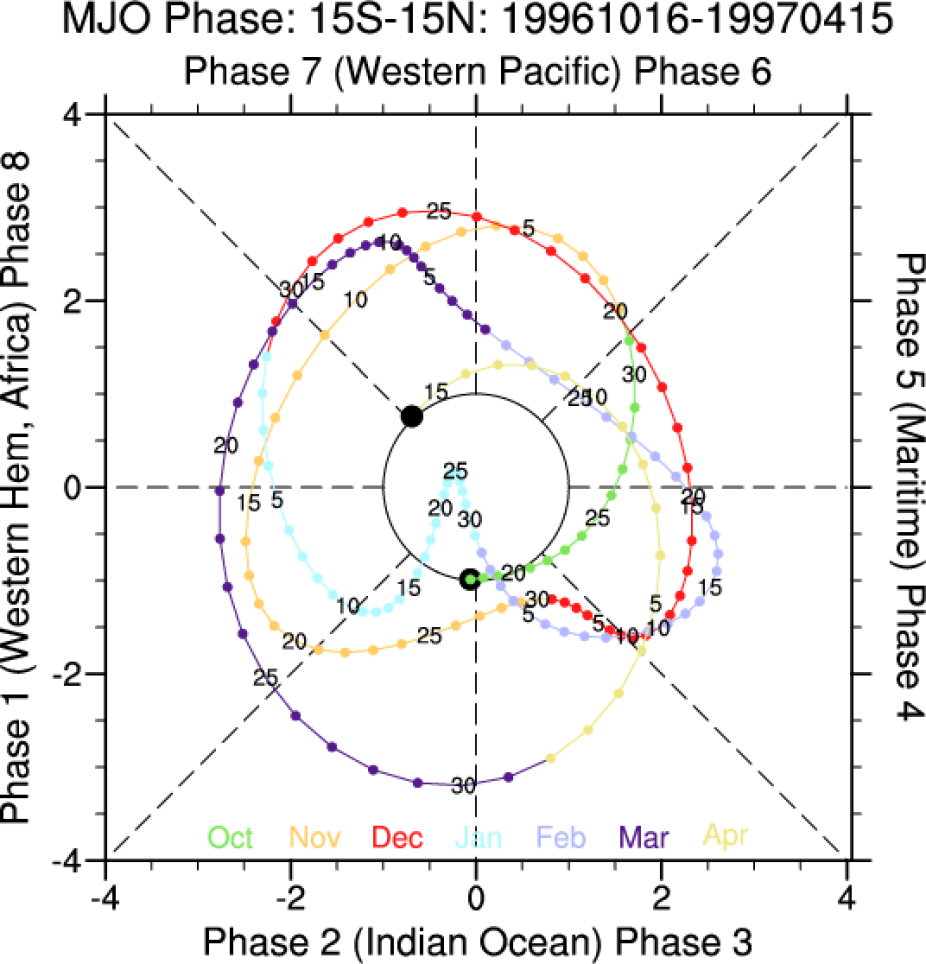
MJO phase diagram for period 10/16/1996 to 4/15/1997. (Climate Data Guide; D. Shea)
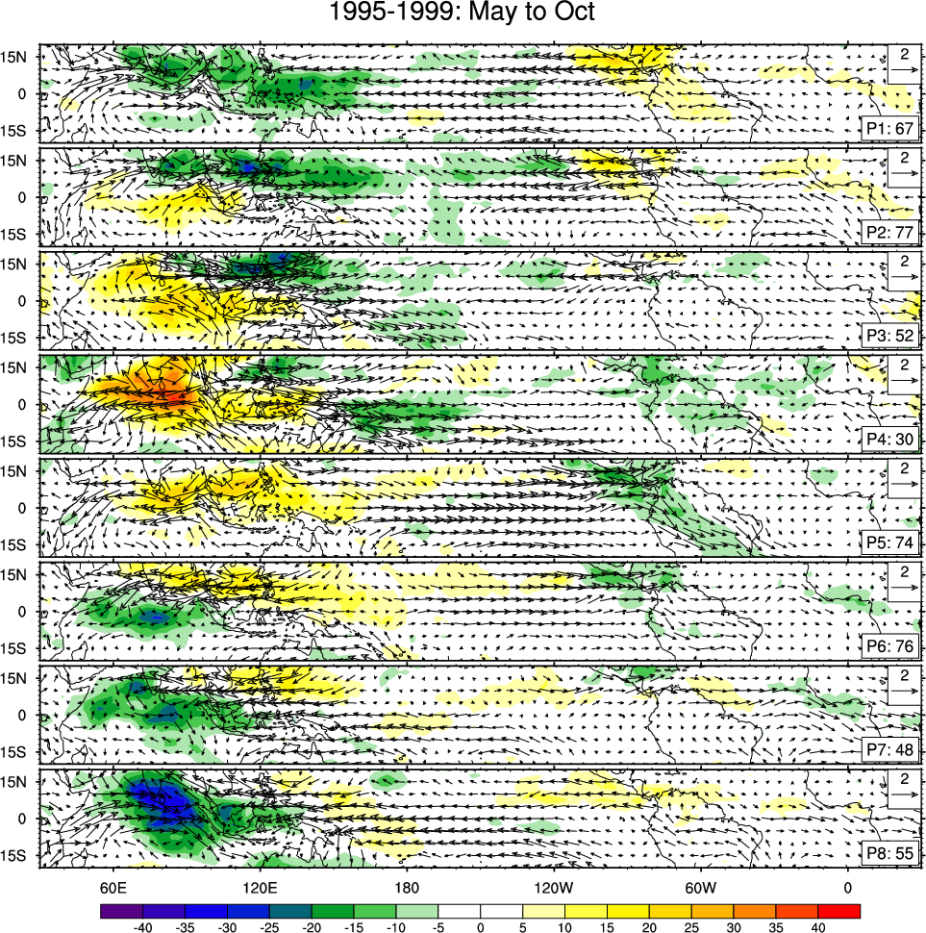
Composite life cycle of 20-100 day band passed filtered anomaly OLR, U850, V850 for the years 1995-1999. The phase (eg P3, means "Phase 3") and the number of days used to create the composite are at the lower right. (Climate Data Guide; D. Shea)
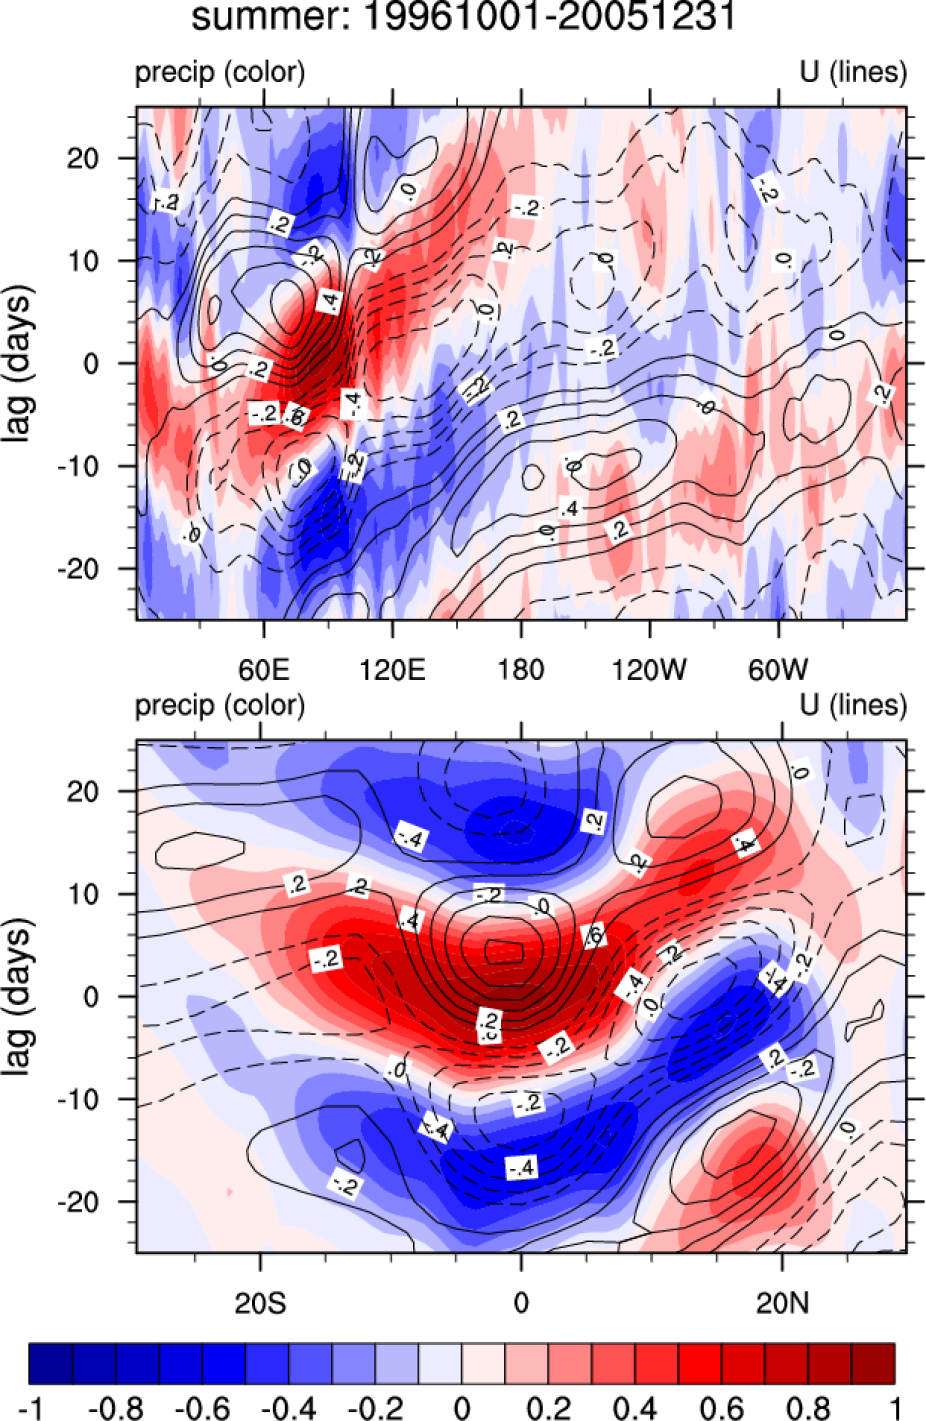
Climatological cross correlations spanning the period Oct 1996 - Dec 2005 using 20-100 band pass filtered data. The reference time series is the central Indian Ocean regional precipitation time series. This is correlated with precipitation and zonal wind anomalies. (Climate Data Guide; D. Shea)