Climate data guide content with tag Climate Indices
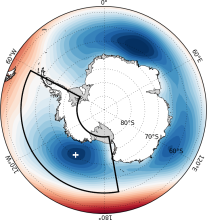 Amundsen Sea Low indices
Years of record
- to
The Amundsen Sea Low (ASL) is a climatological low pressure center located over the extreme southern Pacific Ocean, off the coast of West Antarctica. Atmospheric variability in this region is larger than anywhere else in the Southern Hemisphere, and exhibits significant correlations with both the Southern Annular Mode (SAM) and ENSO. Given its linkages to…
-
Timestep
- Monthly, Seasonal, Annual
-
Collections
- N/A
Experts contributing reviews
- Hosking, Scott
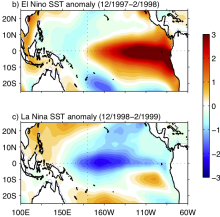 Asymmetry and Diversity in the pattern, amplitude and duration of El Niño and La Niña
Years of record
- N/A
El Niño and La Niña, the two phases of ENSO, are sometimes described as opposites. However, there are asymmetries in their spatial structure, amplitude, duration and seasonal evolution. This leads to differing teleconnections and global impacts, as well as implications for ENSO predictability. The 'Expert Guidance' section of this post summarizes the metrics used to…
-
Formats
- N/A
-
Timestep
- N/A
-
Domain
- Tropics
-
Collections
- N/A
Experts contributing reviews
- Santoso, Agus
 Atlantic Multi-decadal Oscillation (AMO) and Atlantic Multidecadal Variability (AMV)
Years of record
- to
The Atlantic Multi-decadal Oscillation (AMO) has been identified as a coherent mode of natural variability occurring in the North Atlantic Ocean with an estimated period of 60-80 years. It is based upon the average anomalies of sea surface temperatures (SST) in the North Atlantic basin, typically over 0-80N. To remove the signal of long-term change from the AMO…
-
Timestep
- Monthly, Decadal
-
Collections
- Climate Analysis Section (CAS) Data Catalog
Experts contributing reviews
- Trenberth, Kevin, Zhang, Rong
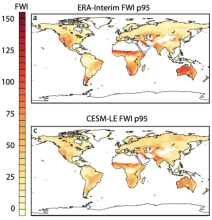 Canadian Forest Fire Weather Index (FWI)
Years of record
- N/A
Fire weather indices are used to quantify the meteorological conditions that can lead to fire ignition and spread. They are used to communicate fire danger levels to emergency and fire fighting management, as well as the public on short time scales, and also for understanding long-term changes in fire regimes or wildfire risk. Several fire weather indices exist, each…
Main variables and Earth System components
Atmosphere-
Formats
- N/A
-
Timestep
- N/A
-
Domain
- N/A
-
Collections
- N/A
Experts contributing reviews
- Touma, Danielle
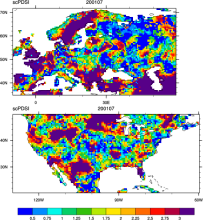 CRU sc-PDSI (self-calibrating PDSI) over Europe & North America
Years of record
- to
Maps of the monthly self-calibrating Palmer drought severity index (SCPDSI) have been calculated for the period 1901–2002 for the contiguous United States (20°–50°N and 130°–60°W) and Europe (35°–70°N, 10°W–60°E) with a spatial resolution of 0.5° × 0.5°
-
Formats
- ascii
-
Timestep
- Monthly
-
Domain
- Europe, North America
-
Collections
- N/A
Experts contributing reviews
- N/A
 Drought atlases from tree rings
Years of record
- to
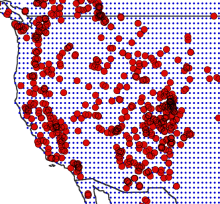
Tree-ring drought atlases provide a paleoclimate analog to modern drought indices, most commonly the Palmer Drought Severity Index (PDSI). Produced on a regular lat-lon grid for regions such as North America, Europe, and Australia, these centuries-long datasets are convenient for comparisons with climate model experiments and historical data on human populations…
-
Timestep
- Annual
-
Domain
- North America
-
Collections
- N/A
Experts contributing reviews
- Cook, Edward
 GHCNDEX: Gridded Temperature and Precipitation Climate Extremes Indices (CLIMDEX data)
Years of record
- to
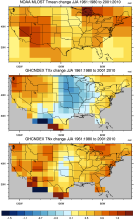
GHCNDEX provides gridded, station-based indices of temperature- and precipitation- related climate extremes. It is intended for detection and attribution studies, climate model evaluation, and operational monitoring of extreme climatic events. Twenty-six indices, including daily maximum and minimum temperatures, number of frost days, maximum 1-day precipitation, and…
Main variables and Earth System components
Atmosphere Maximum Air Temperature Minimum Air Temperature Land Freeze/ThawExperts contributing reviews
- N/A
 HadEX2: Gridded Temperature and Precipitation Climate Extremes Indices (CLIMDEX data)
Years of record
- to
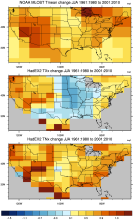
Note: HadEX2 has been superseded by HadEX3. HadEX2 provides gridded, station-based indices of temperature- and precipitation- related climate extremes. It is intended for detection and attribution studies and climate model evaluation. Twenty-nine indices, including daily maximum and minimum temperatures, number of frost days, maximum 1-day precipitation, and growing…
Main variables and Earth System components
Atmosphere Maximum Air Temperature Minimum Air Temperature Land Freeze/ThawExperts contributing reviews
- N/A
 HadEX3: Gridded Temperature and Precipitation Climate Extremes Indices (CLIMDEX data)
Years of record
- to
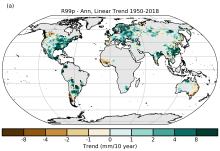
HadEX3 provides gridded, station-based indices of temperature- and precipitation- related climate extremes and supersedes HadEX2. It is intended for global and continental climate monitoring, detection and attribution studies and climate model evaluation. Twenty-nine indices, including daily maximum and minimum temperatures, number of frost days, maximum 1-day…
Main variables and Earth System components
Atmosphere Air Temperature at 2m Maximum Air Temperature Minimum Air Temperature Land Freeze/ThawExperts contributing reviews
- Dunn, Robert
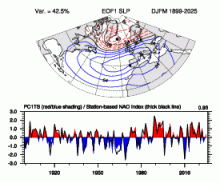 Hurrell North Atlantic Oscillation (NAO) Index (PC-based)
Years of record
- to
The principal component (PC)-based indices of the North Atlantic Oscillation (NAO) are the time series of the leading Empirical Orthogonal Function (EOF) of SLP anomalies over the Atlantic sector, 20°-80°N, 90°W-40°E. These indices are used to measure the NAO throughout the year, tracking the seasonal movements of the Icelandic low and Azores high. These movements…
-
Formats
- ascii
-
Timestep
- Monthly, Seasonal, Annual
-
Domain
- Atlantic Ocean
-
Collections
- Climate Analysis Section (CAS) Data Catalog
Experts contributing reviews
- Hurrell, James, Phillips, Adam
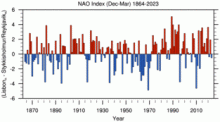 Hurrell North Atlantic Oscillation (NAO) Index (station-based)
Years of record
- to
The winter (December thru March) station-based index of the NAO is based on the difference of normalized sea level pressure (SLP) between Lisbon, Portugal and Stykkisholmur/Reykjavik, Iceland since 1864. Positive values of the NAO index are typically associated with stronger-than-average westerlies over the middle latitudes, more intense weather systems over…
-
Formats
- ascii
-
Timestep
- Monthly, Seasonal, Annual
-
Domain
- Atlantic Ocean
-
Collections
- Climate Analysis Section (CAS) Data Catalog
Experts contributing reviews
- Hurrell, James, Phillips, Adam
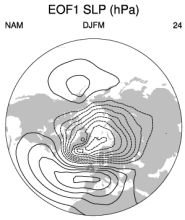 Hurrell wintertime SLP-based Northern Annular Mode (NAM) Index
Years of record
- to
The NAM (or Arctic Oscillation) is defined as the first EOF of NH (20°-90°N) winter SLP data. It explains 23% of the extended winter mean (December-March) variance, and it is clearly dominated by the NAO structure in the Atlantic sector. Although there are some subtle differences from the NAO regional pattern over the Atlantic and Arctic (see Figure 1 below), the main…
-
Formats
- ascii
-
Timestep
- Seasonal
-
Collections
- N/A
Experts contributing reviews
- Phillips, Adam
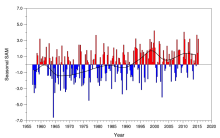 Marshall Southern Annular Mode (SAM) Index (Station-based)
Years of record
- to
The station-based index of the Southern Annular Mode (SAM) is based on the zonal pressure difference between the latitudes of 40S and 65S. As such, the SAM index measures a "see-saw" of atmospheric mass between the middle and high latitudes of the Southern Hemisphere. Positive values of the SAM index correspond with stronger-than-average westerlies over the…
-
Formats
- ascii
-
Timestep
- N/A
-
Collections
- N/A
Experts contributing reviews
- Marshall, Gareth
 Meridional Modes and their indices
Years of record
- N/A
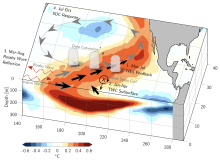
In each of the world’s tropical ocean basins, year-to-year climate variability is primarily governed by fluctuations in the zonal sea surface temperature (SST) gradient and zonal surface winds. These variations consist of recognizable climate modes, such as the El Niño-Southern Oscillation (ENSO) in the tropical Pacific and Atlantic Niño in the tropical Atlantic. While…
-
Formats
- N/A
-
Timestep
- N/A
-
Domain
- Atlantic Ocean, Pacific Ocean
-
Collections
- N/A
Experts contributing reviews
- Amaya, Dillon
 MJO: Madden-Julian Oscillation Diagnostics
Years of record
- N/A
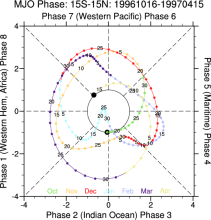
"The Madden–Julian oscillation (MJO) is the largest element of the intraseasonal (30–90 days) variability in the tropical atmosphere. It is a large-scale coupling between atmospheric circulation and tropical deep convection.[1][2] Rather than being a standing pattern (like ENSO) it is a traveling pattern, propagating eastwards at approximately 4 to 8 m/s, through the…
Main variables and Earth System components
N/A-
Formats
- N/A
-
Timestep
- N/A
-
Domain
- N/A
-
Collections
- N/A
Experts contributing reviews
- N/A
 Multivariate ENSO Index
Years of record
- to
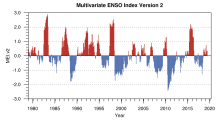
The Multivariate ENSO Index (MEI) is said to capture a more holistic representation of the atmospheric and oceanic anomalies that occur during ENSO events than do single-variables timeseries like the NinoSST indices. The MEIv2 is based on five variables from the tropical Pacific. These five variables are: sea-level pressure (P), zonal (U) and meridional (V) components…
Main variables and Earth System components
N/A-
Formats
- ascii
-
Timestep
- Monthly
-
Domain
- Pacific Ocean
-
Collections
- Climate Analysis Section (CAS) Data Catalog
Experts contributing reviews
- N/A
 Nino SST Indices (Nino 1+2, 3, 3.4, 4; ONI and TNI)
Years of record
- to
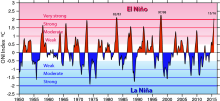
There are several indices used to monitor the tropical Pacific, all of which are based on sea surface temperature (SST) anomalies averaged across a given region. Usually the anomalies are computed relative to a base period of 30 years. The Niño 3.4 index and the Oceanic Niño Index (ONI) are the most commonly used indices to define El Niño and La…
-
Formats
- ascii
-
Timestep
- Monthly
-
Domain
- Pacific Ocean, Tropics
-
Collections
- Climate Analysis Section (CAS) Data Catalog
Experts contributing reviews
- Trenberth, Kevin
 NOAA ThreadEx Long-term Station Extremes for America
Years of record
- to
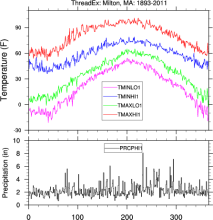
ThreadEx is a data set of extreme daily temperature and precipitation values for 270 locations in the United States. For each day of the year at each station, ThreadEx provides the top 3 record high and low daily maximum temperatures, the top 3 record high and low daily minimum temperatures, the top 3 daily precipitation totals, along with the years the records were set…
Main variables and Earth System components
Atmosphere Air Temperature Maximum Air Temperature Minimum Air Temperature Precipitation-
Formats
- ascii
-
Timestep
- Daily
-
Domain
- North America
-
Collections
- N/A
Experts contributing reviews
- N/A
 North Pacific (NP) Index by Trenberth and Hurrell; monthly and winter
Years of record
- to
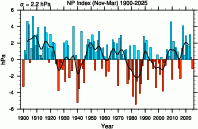
The North Pacific Index (NP index or NPI) is the area-weighted sea level pressure over the region 30°N-65°N, 160°E-140°W. The NP index is defined to measure interannual to decadal variations in the atmospheric circulation. The dominant atmosphere-ocean relation in the North Pacific is one where atmospheric changes lead changes in sea surface temperatures by one to two…
-
Formats
- ascii
-
Timestep
- Monthly, Seasonal
-
Collections
- Climate Analysis Section (CAS) Data Catalog
Experts contributing reviews
- Hurrell, James, Phillips, Adam
 NSIDC Sea Ice Index
Years of record
- to
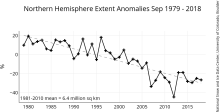
The NSIDC Sea Ice Index is a suite of easy-to-use sea ice analyses to track changes in Arctic and Antarctic sea ice. The product is produced and supported by the NOAA at NSIDC group and consists of browse imagery and data text files (CSV or Excel format). The input data is from two sources distributed by the NASA NSIDC Distributed Active Archive Center (DAAC): (1) Sea…
Experts contributing reviews
- Meier, Walter
 Overview: Climate Indices
Years of record
- N/A
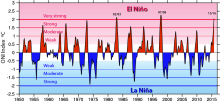
A climate index is a simple diagnostic quantity that is used to characterize an aspect of a geophysical system such as a circulation pattern. A variety of methods have been used to derive assorted indices. Classically, selected station, grid point or regional average data have been used (eg., Southern Oscillation Index, Nino 3.4). Other indices are based upon empirical…
-
Formats
- N/A
-
Timestep
- N/A
-
Domain
- N/A
-
Collections
- Overview / Comparison page
Experts contributing reviews
- N/A
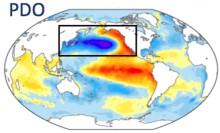 Pacific Decadal Oscillation (PDO): Definition and Indices
Years of record
- to
The Pacific Decadal Oscillation (PDO) is defined by the leading pattern (EOF) of sea surface temperature (SST) anomalies in the North Pacific basin (typically, polewards of 20°N). The SST anomalies are obtained by removing both the climatological annual cycle and the global-mean SST anomaly from the data at each gridpoint. Positive values of the PDO index…
-
Formats
- ascii
-
Timestep
- Monthly
-
Domain
- Pacific Ocean
-
Collections
- N/A
Experts contributing reviews
- Deser, Clara, Trenberth, Kevin
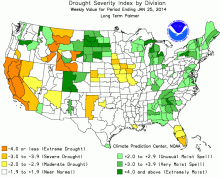 Palmer Drought Severity Index (PDSI)
Years of record
- N/A
The Palmer Drought Severity Index (PDSI) uses readily available temperature and precipitation data to estimate relative dryness. It is a standardized index that generally spans -10 (dry) to +10 (wet). Maps of operational agencies like NOAA typically show a range of -4 to +4, but more extreme values are possible. The PDSI has been reasonably successful at quantifying…
-
Timestep
- Monthly
-
Domain
- Global
-
Collections
- Climate Analysis Section (CAS) Data Catalog
Experts contributing reviews
- Dai, Aiguo, Bui, Sang, Lenssen, Nathan
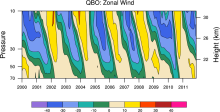 QBO: Quasi-Biennial Oscillation
Years of record
- to
The quasi-biennial oscillation (QBO) is a quasi-periodic oscillation of the equatorial zonal wind between easterlies and westerlies in the tropical stratosphere with a mean period of 28 to 29 months. The alternating wind regimes develop at the top of the lower stratosphere and propagate downwards at about 1 km (0.6 mi) per month until they are dissipated at the tropical…
Experts contributing reviews
- N/A
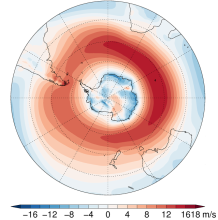 Southern Hemisphere westerly jet strength and position
Years of record
- to
The dynamics of the Southern Hemisphere westerly jet are described in terms of two indices, jet strength and jet latitude. Here, these indices are defined using the ERA-Interim reanalysis, although other datasets, including climate models, could be used. Although closely linked with the Southern Annular Mode (SAM) Index, these indices more precisely capture…
-
Formats
- ascii
-
Timestep
- Seasonal, Annual
-
Collections
- N/A
Experts contributing reviews
- Bracegirdle, Thomas J.
 Southern Oscillation Indices: Signal, Noise and Tahiti/Darwin SLP (SOI)
Years of record
- to
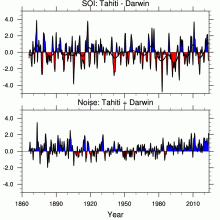
The Southern Oscillation Index (SOI) is a time series used to characterize the large scale sea level pressure (SLP) patterns in the tropical Pacific. Monthly mean SLP at Tahiti [T] and Darwin [D] are used. An optimal SOI can be constructed. It consists of [T-D] which is a measure of the large scale phenomena while [T+D] is a measure of small scale and/or…
-
Timestep
- Monthly
-
Domain
- Australia, Pacific Ocean, Tropics
-
Collections
- Climate Analysis Section (CAS) Data Catalog
Experts contributing reviews
- Trenberth, Kevin
 Standardized Precipitation Evapotranspiration Index (SPEI)
Years of record
- to
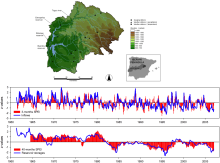
The Standardized Precipitation Evapotranspiration Index (SPEI) is an extension of the widely used Standardized Precipitation Index (SPI). The SPEI is designed to take into account both precipitation and potential evapotranspiration (PET) in determining drought. Thus, unlike the SPI, the SPEI captures the main impact of increased temperatures on water demand. Like the…
Main variables and Earth System components
N/AExperts contributing reviews
- Vicente-Serrano, Sergio M.
 Standardized Precipitation Index (SPI)
Years of record
- to
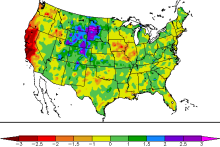
The Standardized Precipitation Index (SPI) is a widely used index to characterize meteorological drought on a range of timescales. On short timescales, the SPI is closely related to soil moisture, while at longer timescales, the SPI can be related to groundwater and reservoir storage. The SPI can be compared across regions with markedly different climates. It quantifies…
-
Formats
- N/A
-
Timestep
- Monthly
-
Domain
- N/A
-
Collections
- N/A
Experts contributing reviews
- Keyantash, John
 U.S. Climate Extremes Index (CEI)
Years of record
- to
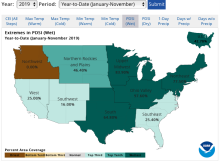
The U.S. Climate Extremes Index (CEI) was first presented in 1995 as a framework for quantifying observed changes in climate within the contiguous United States. At present, the CEI evaluates the percent area of extremes in the distribution of much above/below average (top/bottom 10% of occurrence) temperatures, precipitation, drought, and tropical cyclone wind…
Main variables and Earth System components
Atmosphere Air Temperature Maximum Air Temperature Minimum Air Temperature Precipitation Wind Land Drought-
Formats
- ascii
-
Timestep
- Monthly, Seasonal, Annual
-
Domain
- North America
-
Collections
- N/A
Experts contributing reviews
- Gleason, Karin