MSU/AMSU Atmospheric Temperature Climate Data Record, Remote Sensing Systems (RSS)

A long (30-year+) data set of atmospheric temperatures for 4 tropopsheric and lower stratopsheric layers has been derived from brightness temperatures measured by the Microwave Sounding Unit (MSU) and Advanced Microwave Sounding Unit (AMSU). This page describes the data sets developed by Remote Sensing Systems (RSS); other options exist for comparisons. One of the most important adjustments to the original brightness temperatures is accounting for changes in the measurement time of day as the orbit of the satellite drifts. Model comparisons should include calculations of synthetic brightness temperatures from the model output.
Key Strengths
Long data set of atmospheric temperatures extending greater than 30 years
Can be used to study long-term trends and spatial patterns
Well-documented data sets with comprehensive error estimates
Key Limitations
Long-term trends depend on adjustments for changing local measurement times; errors in these adjustments could lead to long-term uncertainty
Not useful for absolute temperature measurements
Mears, CA, FJ Wentz, 2009, Construction of the Remote Sensing Systems V3.2 atmospheric temperature records from the MSU and AMSU microwave sounders, Journal of Atmospheric and Oceanic Technology, 26, 1040-1056.
Mears, CA, FJ Wentz, 2009, Construction of the RSS V3.2 lower tropospheric dataset from the MSU and AMSU microwave sounders, Journal of Atmospheric and Oceanic Technology, 26, 1493-1509.
Users are requested to reference RSS, and notify RSS if a paper is published
Expert Developer Guidance
#The following is by Carl Mears (Remote Sensing Systems), February 2012:
Key Strengths: Datasets are stable and well documented. Comprehensive error estimates are available. Dataset extends for more than 30 years, so long-term trend analyses are possible.
Key Weaknesses: Long-term trends depend on adjustments for changing local measurement times due to drifts in each satellites orbits. Possible errors in these adjustments cause long-term uncertainty.
Strategies for Comparing to Models: As these are brightness temperatures, synthetic brightness temperatures must be calculated from model output in order to do a comparison. For the tropospheric channels, the synthetic brightness temperatures contain contributions from surface emission (and thus changing sea ice), water vapor and clouds in addition to the dominant atmospheric temperature contribution.
What corrections/adjustments are applied to the operational data from NOAA/NASA?: The two most important adjustments are:
1. Adjustment made to account for changes in the local measurement time as the orbit of each satellite drifts, thus aliasing the diurnal cycle into the long term record.
2. Adjustments for calibration drifts that occur as the temperature of the hot calibration target changes.
There are also adjustments for Earth incidence angle/satellite height that are particularly important for the lower tropospheric channel, TLT. Without these adjustments, the decay of orbital height over time leads to an artificial cooling signal in the data.
These data can be used to calculate long-term trends, but the user should be aware that there is substantial uncertainty in the trends that are obtained which should be accounted for when comparing to other datasets or model output. The internal uncertainty in the dataset has been estimated using a Monte-Carlo technique, which resulted in 400 realizations of each dataset that can be interrogated by users to determine the uncertainty in their application. The Monte-Carlo analysis found that uncertainty in long term trends is dominated by uncertainty in the local measurement time adjustment applied. The data over the ocean are more reliable than trends over land because the diurnal/measurement time adjustment is typically smaller over the ocean.
The uncertainty in the overall absolute brightness temperature is probably quite large, possibly as large as 1.0K. These data should not be used to diagnose absolute temperature, but only temperature changes and spatial patterns.
There are comparable datasets available from NOAA/STAR and from the University of Alabama, Huntsville (UAH). ##
Cite this page
Acknowledgement of any material taken from or knowledge gained from this page is appreciated:
Mears, Carl & National Center for Atmospheric Research Staff (Eds). Last modified "The Climate Data Guide: MSU/AMSU Atmospheric Temperature Climate Data Record, Remote Sensing Systems (RSS).” Retrieved from https://climatedataguide.ucar.edu/climate-data/msuamsu-atmospheric-temperature-climate-data-record-remote-sensing-systems-rss on 2026-05-30.
Citation of datasets is separate and should be done according to the data providers' instructions. If known to us, data citation instructions are given in the Data Access section, above.
Acknowledgement of the Climate Data Guide project is also appreciated:
Schneider, D. P., C. Deser, J. Fasullo, and K. E. Trenberth, 2013: Climate Data Guide Spurs Discovery and Understanding. Eos Trans. AGU, 94, 121–122, https://doi.org/10.1002/2013eo130001
Key Figures
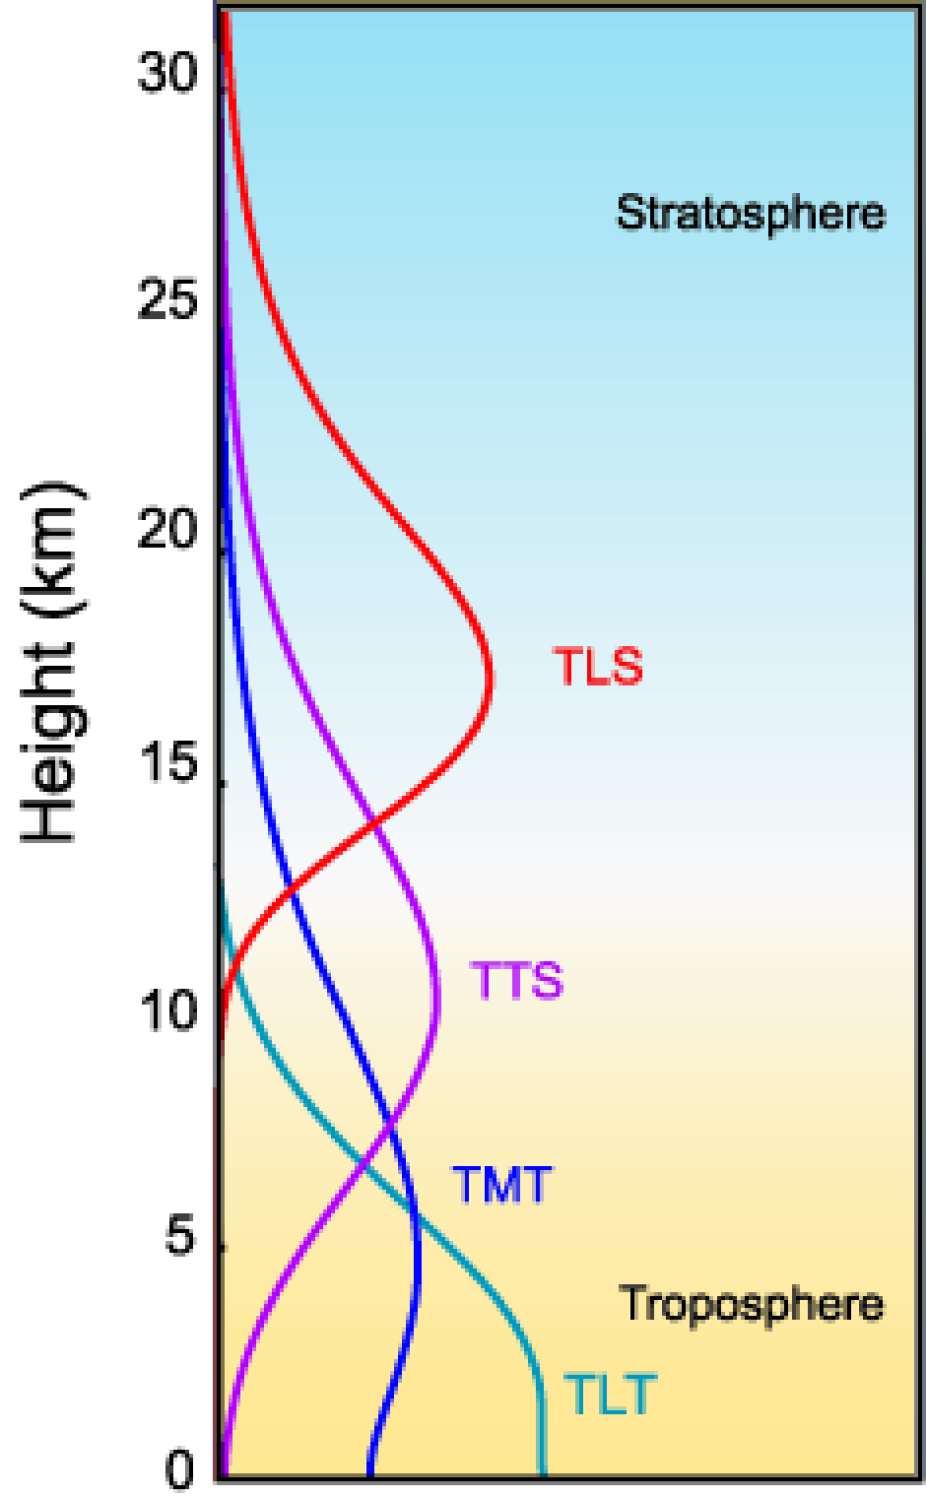
Weighting function for each channel. (contributed by C Mears)

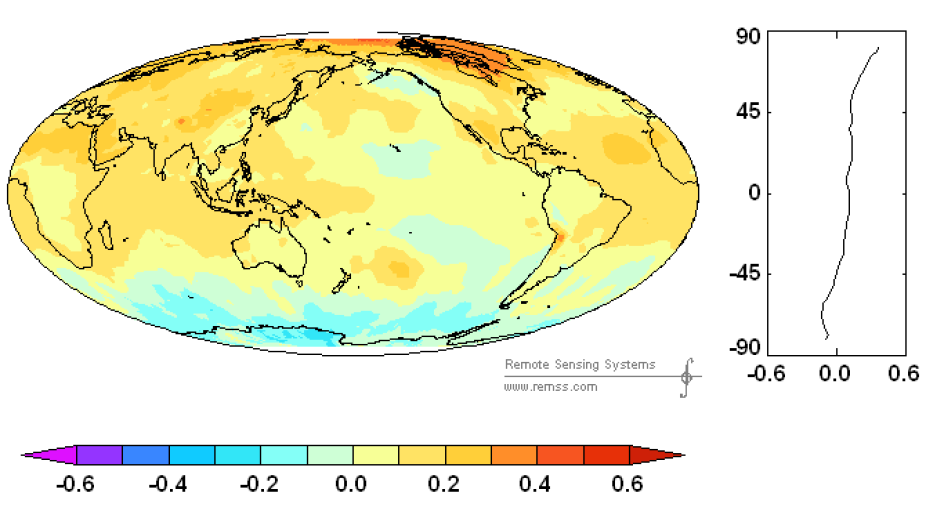
Trend in lower tropospheric temperature, 1979-2011. (contributed by C Mears)
Trend in middle tropospheric temperature, 1979-2011. (contributed by C Mears)

Trend in lower stratospheric temperature, 1979-2011. (contributed by C Mears)
Other Information
- Mears, CA, FJ Wentz, 2009, Construction of the Remote Sensing Systems V3.2 atmospheric temperature records from the MSU and AMSU microwave sounders, Journal of Atmospheric and Oceanic Technology, 26, 1040-1056.
- Mears, CA, FJ Wentz, 2009, Construction of the RSS V3.2 lower tropospheric dataset from the MSU and AMSU microwave sounders, Journal of Atmospheric and Oceanic Technology, 26, 1493-1509.
- Mears, CA, FJ Wentz, P Thorne and others, 2011, Assessing uncertainty in estimates of atmospheric temperature changes from MSU and AMSU using a Monte-Carlo estimation technique, Journal of Geophysical Research, 116, D08112, doi:10.1029/2010JD014954.