World Ocean Atlas 2013 (WOA13)
The World Ocean Atlas (WOA) is a set of climatological mean, gridded fields of oceanographic variables based on in-situ measurements from a wide variety of sources. Global, decadal averages of temperature, salinity, oxygen and nutrients are provided at monthly, seasonal and annual averaging periods on 102 standard depth levels from 0 to 5500m, and at 0.25° (temperature, salinity) and 1 ° (all variables) horizontal resolutions. These fields are widely used for ocean model initialization and validation, climate studies, and operational forecasting. Regional climatologies of temperature and salinity are available at 1/10 ° for select regions of the global ocean with good data coverage. The WOA is often referred to simply as "Levitus" or the "Levitus Climatology" after its pioneering creator, Sydney Levitus. The WOA generally represents large-scale features of the global ocean quite well but coverage can be inadequate for meaningful gradient and trend calculations in some regions and depths.
Key Strengths
Global coverage of temperature, salinity, dissolved oxygen and nutrients gridded at various horizontal resolutions (1 degree to 1/4 degree) and 102 depth levels
Based on direct, in-situ measurements. No satellite data or model used
Useful as initial or boundary conditions for models, studies of climate variability and change, or validation of satellite retrievals
Key Limitations
Fields are based on limited data in some regions such as the Southern Ocean and at deeper levels
Limited observations in some regions and depths could render some computations, such as horizontal gradients, meaningless
Inconsistent sampling in a given region through time could contribute to spurious features in the temporal record
Expert Developer Guidance
The following was contributed by Alexey Mishonov, October, 2016:
The World Ocean Atlas (WOA) series consists of long-term climatological mean and objectively analyzed fields of oceanographic variables derived from in situ profile data arranged at discrete depths and time intervals (annual, seasonal, monthly). The fields can be used in a wide spectrum of oceanographic applications (e.g., initial and/or boundary conditions for models, base mean fields for climate variability and change studies, quality control tools for in situ measurements, etc.). The most recent version of the World Ocean Atlas (WOA13, published in 2013) includes mean and objectively analyzed fields for six decades (1955-64, 1965-74, 1975-84, 1985-94, 1995-2004, and 2005-2012) for temperature and salinity with one- and quarter-degree resolution as well as a six decadal averaged field (termed ‘decav’, 1955-2012). Additionally, all-data fields of dissolved oxygen, nitrate, phosphate, and silicate with one-degree resolution are also included in the release of WOA13. The ‘decav’ and individual decadal fields provide a unique oceanographic foundation for the exploration of climate variability over the second half of the 20th century and the beginning of the 21st century on a global scale. The higher resolution quarter-degree fields of decadal temperature and salinity offer a more detailed view of the World Ocean over the time span of almost 60 years. WOA13 contains 102 depth levels between the surface and 5500 m depth, which provides a far better approximation of the mean and analyzed fields when compared to the 33 depth levels in all earlier editions of WOA. Based on WOA, several Regional Climatologies were developed for different regions of the World Ocean where data coverage is sufficient, providing even more detailed temperature and salinity fields. Data and analyses with higher vertical resolution than was previously available are proved to be very useful for better documenting of the ocean variability, including improving diagnostics, understanding, and modeling of the physics of the global ocean.
The oceanographic analyses described by the WOA13 atlas series expands on earlier works (e.g., World Ocean Atlas 2009 (WOA09), World Ocean Atlas 2005 (WOA05), World Ocean Atlas 2001 (WOA01), World Ocean Atlas 1998 (WOA98), World Ocean Atlas 1994 (WOA94), and Climatological Atlas of the World Ocean (Levitus, 1982)). Previously published oceanographic objective analyses have proven to be highly useful for the oceanographic, climate research, geophysical, and operational environmental forecasting communities. Some of the usages of these data can be in the form of "sea truth" for validation of satellite measurements, for computation of nutrient fluxes by Ekman transport, and for planning oceanographic expeditions among others (Locarnini et al., 2013).
The WOA13 represents the ocean state variables of temperature and salinity with more detail and less uncertainty than previous iterations of the World Ocean Atlas series due to large increases in data holdings and better temporal and spatial coverage coupled with refined analysis and quality control techniques (see Figure 1). WOA13 expanded on previous releases with increased vertical resolution (3x in the upper ocean, 2x below 1500 m.), increased spatial resolution (16x), and the release of the decadal climatologies, which were used to calculate the final 1955-2012 long-term climatological mean fields. In order to further improve the initial release of WOA13, an update, WOA13 version 2 (WOA13v2) has been prepared, which addresses some methodology and quality control concerns surfaced since the initial release of WOA13. Those augments has some effect on the resultant fields from local to global. (Boyer et al., 2015).
Access to WOA13v2 is provided via https://www.nodc.noaa.gov/OC5/woa13/.
A few regions of the World Ocean have significantly better data coverage historically than others, thus opening a possibility to generate regional ocean climatologies on even finer than quarter-degree spatial grids. Therefore, in 2011 the National Oceanographic Data Center (now part of National Centers for Environmental Information) began development of the Regional Climatology Atlases for such regions by generating fields of temperature and salinity on one-, quarter-, and tenths-degree spatial resolution grids with more detailed local quality control procedures than those applied to the World Ocean in all WOA editions. Currently, there are six Regional Climatology (RC) Atlases that have been created and published:
- Gulf of Mexico RC - To provide physical oceanography foundation for assessment of the Gulf of Mexico (GoM) ocean climate state, a regional climatology of the GoM was compiled as a set of mean fields at one-degree, quarter-degree, and tenth-degree resolution for temperature, salinity, oxygen and other essential oceanographic parameters from the World Ocean Database. The GoM regional climatology serves as physical oceanography foundation for NOAA Gulf of Mexico Data Atlas.
- East Asian Seas RC - is a set of objectively analyzed climatological fields of temperature and salinity at standard depth levels in the East Asian Marginal Seas. These fields were calculated for annual, seasonal, and monthly time periods on one-degree, quarter-degree, and tenth-degree latitude-longitude grids and are based on 1.2 million temperature profiles and 0.6 million salinity profiles.
- Arctic RC - The Arctic Ocean is an area of intense activity both for environmental and commercial interests. This region has seen the largest increase in ocean temperatures and continued loss of summer sea ice extent. Oil and mineral exploration and exploitation are becoming increasable common in the Arctic. To facilitate study of the region, a new set of high-resolution long-term mean surface/subsurface temperature and salinity fields has been developed. These mean fields incorporate a great deal of data not previously available.
- Greenland, Iceland and Norwegian Seas (GINS) RC - the gateways for water exchange between the North Atlantic Ocean and the Arctic, which plays a key role in the entire high-latitudinal ocean climate formation and change. The magnitude of fisheries, oil and other material resources and climatic importance of GINS has spurred intensive observation and research programs in the region. To provide an improved oceanographic foundation and reference for multi-disciplinary studies of the GINS a new set of high-resolution quality-controlled long-term annual, seasonal and monthly mean temperature and salinity fields on different depth levels has been developed.
- Northwest Atlantic RC – The Northwest Atlantic (NWA) plays a crucial role in long-term earth and ocean variability and trends. The Gulf Stream and North Atlantic Current System are the key elements of northward heat transport and Meridional Overturning Circulation in the Atlantic Ocean. The NWA is a resource-rich coastal zone with abundant fisheries and other material resources. Its economic significance and climatic importance called forth intensive observational and research programs spanning over many decades. To provide an improved oceanographic foundation and reference for multi-disciplinary studies of the NWA, a new set of high-resolution quality-controlled long-term annual, seasonal and monthly mean temperature and salinity fields on different depth levels has been developed. The NWA RC is the most detailed regional climatology with monthly fields of temperature and salinity for six decades since 1955 on three spatial grids with one-, quarter and one-tenth of the degree resolutions on 102 levels of depths (see Figures below).
- Northern North Pacific RC - The Northern North Pacific (NNP) plays a critical role in long-term earth and ocean variability and change. The NNP is a resource-reach coastal zone with abundant fisheries and other material resources. To provide an improved oceanographic foundation and reference for multi-disciplinary studies of the NNP, NCEI Regional Climatology Team developed a new set of high-resolution quality-controlled long-term annual, seasonal and monthly mean temperature and salinity fields on different depth levels.
Access to Regional Climatology Atlases is provided via https://www.nodc.noaa.gov/OC5/regional_climate/.
REFERENCES:
Pioneering paper:
- Levitus, S., Climatological Atlas of the World Ocean, NOAA/ERL GFDL. Professional Paper 13, Princeton, N.J., 173 pp. (NTIS PB83-184093), 1982.
Following documents are available online at http://www.nodc.noaa.gov/OC5/indprod.html.
World Ocean Atlas 2013 and Regional Climatologies series:
- Boyer, T., R.A. Locarnini, M.M. Zweng, A.V. Mishonov, J.R. Reagan, J.I. Antonov, H.E. Garcia, O.K. Baranova, D.R. Johnson, D. Seidov, M.M. Biddle, M. Hamilton, 2015. Changes to calculations of the World Ocean Atlas 2013 for version 2. http://data.nodc.noaa.gov/woa/WOA13/DOC/woa13v2_changes.pdf.
- Locarnini, R.A., A.V. Mishonov, J.I. Antonov, T.P. Boyer, H.E. Garcia, O.K. Baranova, M.M. Zweng, C.R. Paver, J.R. Reagan, D.R. Johnson, M. Hamilton, and D. Seidov, 2013. World Ocean Atlas 2013, Volume 1: Temperature. S. Levitus, Ed., A. Mishonov Technical Ed.; NOAA Atlas NESDIS 73, 40 pp.
- Zweng, M.M, J.R. Reagan, J.I. Antonov, R.A. Locarnini, A.V. Mishonov, T.P. Boyer, H.E. Garcia, O.K. Baranova, D.R. Johnson, D. Seidov, M.M. Biddle, 2013. World Ocean Atlas 2013, Volume 2: Salinity. S. Levitus, Ed., A. Mishonov Technical Ed.; NOAA Atlas NESDIS 74, 39 pp.
- Garcia, H.E., R.A. Locarnini, T.P. Boyer, J.I. Antonov, O.K. Baranova, M.M. Zweng, J.R. Reagan, D.R. Johnson, 2014. World Ocean Atlas 2013, Volume 3: Dissolved Oxygen, Apparent Oxygen Utilization, and Oxygen Saturation. S. Levitus, Ed., A. Mishonov Technical Ed.; NOAA Atlas NESDIS 75, 27 pp
- Garcia, H.E., R.A. Locarnini, T.P. Boyer, J.I. Antonov, O.K. Baranova, M.M. Zweng, J.R. Reagan, D.R. Johnson, 2014. World Ocean Atlas 2013, Volume 4: Dissolved Inorganic Nutrients (phosphate, nitrate, silicate). S. Levitus, Ed., A. Mishonov Technical Ed.; NOAA Atlas NESDIS 76, 25 pp.
- Boyer, T.P., S. Levitus, H.E. Garcia, R.A. Locarnini, M.M. Zweng, A.V. Mishonov, J.R. Reagan, J.I. Antonov, O.K. Baranova, M. Hamilton, D.R. Johnson, C.R. Paver, and D. Seidov, 2014. Finite time period and high resolution World Ocean Atlas 2013 climatologies and their use to study climate variability. 17th Ocean Sciences Proceedings, Honolulu, HI, poster 1713.
- Boyer, T.P., M. Biddle, M. Hamilton, A.V. Mishonov, C.R. Paver, D. Seidov, M. Zweng, 2011. Gulf of Mexico Regional Climatology, NOAA/NODC, dataset doi 10.7289/V5C53HSW.
- Johnson, D.R., Boyer, T.P., 2015: Regional Climatology of the East Asian Seas: An Introduction. NOAA Atlas NESDIS 79, Silver Spring, MD, 37 pp., doi: 10.7289/V5D21VM9.
- Boyer, T.P., O.K. Baranova, M. Biddle, D.R. Johnson, A.V. Mishonov, C. Paver, D. Seidov and M. Zweng (2012), Arctic Regional Climatology, Regional Climatology Team, NOAA/NODC (www.nodc.noaa.gov/OC5/regional_climate/arctic).
- Seidov, D., J.I. Antonov, K.M. Arzayus, O.K. Baranova, M. Biddle, T.P. Boyer, D.R. Johnson, A.V. Mishonov, C. Paver and M.M. Zweng, 2014, Oceanography North of 60N from World Ocean Database, Progress in Oceanography, http://dx.doi.org/10.1016/j.pocean.2014.02.003.
- Seidov, D., O.K. Baranova, M. Biddle, T.P. Boyer, D.R. Johnson, A.V. Mishonov, C. Paver and M. Zweng (2013), Greenland-Iceland-Norwegian Seas Regional Climatology, Regional Climatology Team, NOAA/NODC (http://dx.doi.org/10.7289/V5GT5K30).
- Seidov, D., O.K. Baranova, D.R. Johnson, T.P. Boyer, A.V. Mishonov and A.R. Parsons (2016), Northwest Atlantic Regional Climatology, Regional Climatology Team, NOAA/NCEI (www.nodc.noaa.gov/OC5/regional_climate/nwa-climate), dataset doi:10.7289/V5RF5S2Q.
World Ocean Atlas, 2009 series:
- Locarnini, R.A., A.V. Mishonov, J.I. Antonov, T.P. Boyer, H.E. Garcia, O.K. Baranova, M.M. Zweng, and D.R. Johnson, 2010. World Ocean Atlas 2009. Volume 1: Temperature. S. Levitus, Ed. NOAA Atlas NESDIS 68, U.S. Gov. Printing Office, Wash., D.C., 184 pp.
- Antonov, J.I., D. Seidov, T.P. Boyer, R.A. Locarnini, A.V. Mishonov, H.E. Garcia, O.K. Baranova, M.M. Zweng, and D.R. Johnson, 2010. World Ocean Atlas 2009, Volume 2: Salinity. S. Levitus, Ed. NOAA Atlas NESDIS 69, 184 pp.
- Garcia, H.E., R.A. Locarnini, T.P. Boyer, J.I. Antonov, O.K. Baranova, M.M. Zweng, and D.R. Johnson, 2010. World Ocean Atlas 2009. Volume 3: Dissolved Oxygen, Apparent Oxygen Utilization, and Oxygen Saturation. S. Levitus, Ed. NOAA Atlas NESDIS 70, 344 pp.
- Garcia, H.E., R.A. Locarnini, T.P. Boyer, J.I. Antonov, O.K. Baranova, M.M. Zweng, and D.R. Johnson, 2010. World Ocean Atlas 2009. Volume 4: Nutrients (phosphate, nitrate, silicate). S. Levitus, Ed. NOAA Atlas NESDIS 71, U.S. Gov. Printing Office, Wash., D.C., 398 pp.
World Ocean Atlas, 2005 series:
- Locarnini, R.A., A.V. Mishonov, J.I. Antonov, T.P. Boyer, and H.E. Garcia, 2006. World Ocean Atlas 2005. Volume 1: Temperature. S. Levitus, Ed. NOAA Atlas NESDIS 61, U.S. Gov. Printing Office, Wash., D.C., 182 pp, CD-ROM.
- Antonov, J.I., R.A. Locarnini, T.P. Boyer, A.V. Mishonov, and H.E. Garcia, 2006. World Ocean Atlas 2005. Volume 2: Salinity. S. Levitus, Ed. NOAA Atlas NESDIS 62, U.S. Gov. Printing Office, Wash., D.C., 182 pp, CD-ROM.
- Garcia, H.E., R.A. Locarnini, T.P. Boyer, and J.I. Antonov, 2006. World Ocean Atlas 2005. Volume 3: Dissolved Oxygen, Apparent Oxygen Utilization, and Oxygen Saturation. S. Levitus, Ed. NOAA Atlas NESDIS 63, U.S. Gov. Printing Office, Wash., D.C., 342 pp, CD-ROM.
- Garcia, H. E., R. A. Locarnini, T. P. Boyer, and J. I. Antonov, 2006. World Ocean Atlas 2005. Volume 4: Nutrients (phosphate, nitrate, silicate). S. Levitus, Ed. NOAA Atlas NESDIS 64, U.S. Gov. Printing Office, Wash., D.C., 396 pp, CD-ROM.
World Ocean Atlas, 2001 series:
- Stephens, C., J.I. Antonov, T.P. Boyer, M.E. Conkright, R.A. Locarnini, T.D. O'Brien, H.E. Garcia, 2002. World Ocean Atlas 2001. Volume 1: Temperature. S. Levitus, Ed., NOAA Atlas NESDIS 49, U.S. Gov. Printing Office, Wash., D.C., 167 pp., CD-ROMs. Online reprint (pdf): documentation (0.5 MB), figures (35 MB)
- Boyer, T.P., Stephens, C., J.I. Antonov, M.E. Conkright, R.A. Locarnini, T. D. O'Brien, H.E. Garcia, 2002. World Ocean Atlas 2001. Volume 2: Salinity. S. Levitus, Ed., NOAA Atlas NESDIS 50, U.S. Gov. Printing Office, Wash., D.C., 165 pp., CD-ROMs. Online reprint (pdf): documentation (0.5 MB), figures (33 MB)
- Locarnini, R. A., T. D. O'Brien, H. E. Garcia, J. I. Antonov, T. P. Boyer, M. E. Conkright, C. Stephens, 2002. World Ocean Atlas 2001. Volume 3: Oxygen. S. Levitus, Ed., NOAA Atlas NESDIS 51, U.S. Gov. Printing Office, Wash., D.C., 286 pp., CD-ROMs.
- Conkright, M.E., H.E. Garcia, T.D. O'Brien, R.A. Locarnini, T.P. Boyer, C. Stephens J.I. Antonov, 2002. World Ocean Atlas 2001. Volume 4: Nutrients. S. Levitus, Ed., NOAA Atlas NESDIS 52, U.S. Gov. Printing Office, Wash., D.C., 392 pp., CD-ROMs.
- O'Brien, T.D., M.E. Conkright, T.P. Boyer, C. Stephens, J.I. Antonov, R.A. Locarnini, H.E. Garcia, 2002. World Ocean Atlas 2001. Volume 5: Plankton. S. Levitus, Ed., NOAA Atlas NESDIS 53, U.S. Gov. Printing Office, Wash., D.C., 95 pp., CD-ROMs.
- Conkright, M.E., T.D. O'Brien, C. Stephens, R.A. Locarnini, H.E. Garcia, T.P. Boyer, J.I. Antonov, 2002. World Ocean Atlas 2001. Volume 6: Chlorophyll. S. Levitus, Ed., NOAA Atlas NESDIS 54, U.S. Gov. Printing Office, Wash., D.C., 46 pp., CD-ROMs.
- Conkright M.E., R.A. Locarnini, H.E. Garcia, T. O' Brien, T.P. Boyer, C. Stephens, J.I. Antonov, 2002. World Ocean Atlas 2001: Objective Analyses, Data Statistics, and Figures CD-ROM Documentation, NODC Internal Report 17, Silver Spring MD, 17 pp.
World Ocean Atlas, 1998 series:
- Antonov,J., Levitus, S., T.P. Boyer, M. Conkright, T. O' Brien, C. Stephens, 1998. World Ocean Atlas 1998. Volume 1: Temperature of the Atlantic Ocean. NOAA Atlas NESDIS 27. U.S. Gov. Printing Office, Wash., D.C., 166 pp.
- Antonov,J., Levitus, S., T.P. Boyer, M. Conkright, T. O' Brien, C. Stephens, 1998. World Ocean Atlas 1998. Volume 2: Temperature of the Pacific Ocean. NOAA Atlas NESDIS 28. U.S. Gov. Printing Office, Wash., D.C., 166 pp.
- Antonov,J., Levitus, S., T.P. Boyer, M. Conkright, T. O' Brien, C. Stephens, B. Trotsenko, 1998. World Ocean Atlas 1998. Volume 3: Temperature of the Indian Ocean. NOAA Atlas NESDIS 29. U.S. Gov. Printing Office, Wash., D.C., 166 pp.
- Boyer, T.P., Levitus, S., J. Antonov, M. Conkright, T. O' Brien, C. Stephens, 1998. World Ocean Atlas 1998. Volume 4: Salinity of the Atlantic Ocean. NOAA Atlas NESDIS 30.U.S. Gov. Printing Office, Wash., D.C., 166 pp.
- Boyer, T.P., Levitus, S., J. Antonov, M. Conkright, T. O' Brien, C. Stephens, 1998. World Ocean Atlas 1998. Volume 5: Salinity of the Pacific Ocean. NOAA Atlas NESDIS 31.U.S. Gov. Printing Office, Wash., D.C., 166 pp.
- Boyer, T.P., Levitus, S., J. Antonov, M. Conkright, T. O' Brien, C. Stephens, B. Trotsenko, 1998. World Ocean Atlas 1998. Volume 6: Salinity of the Indian Ocean. NOAA Atlas NESDIS 32. U.S. Gov. Printing Office, Wash., D.C., 166 pp.
- O' Brien, T., S. Levitus, T.P. Boyer, M. Conkright, J. Antonov, C. Stephens, 1998. World Ocean Atlas 1998. Volume 7: Oxygen of the Atlantic Ocean. NOAA Atlas NESDIS 33. U.S. Gov. Printing Office, Wash., D.C., 234 pp.
- O' Brien, T., S. Levitus, T.P. Boyer, M. Conkright, J. Antonov, C. Stephens, 1998. World Ocean Atlas 1998. Volume 8: Oxygen of the Pacific Ocean. NOAA Atlas NESDIS 34. U.S. Gov. Printing Office, Wash., D.C., 234 pp.
- O' Brien, T., S. Levitus, T.P. Boyer, M. Conkright, J. Antonov, C. Stephens, 1998. World Ocean Atlas 1998. Volume 9: Oxygen of the Indian Ocean. NOAA Atlas NESDIS 35. U.S. Gov. Printing Office, Wash., D.C.,234 pp.
- Conkright, M., T. O' Brien, S. Levitus, T.P. Boyer, J. Antonov, C. Stephens, 1998. World Ocean Atlas 1998. Volume 10: Nutrients and Chlorophyll of the Atlantic Ocean. NOAA Atlas NESDIS 36.U.S. Gov. Printing Office, Wash., D.C., 245 pp.
- Conkright, T. O' Brien, M., S. Levitus, T.P. Boyer, J. Antonov, C. Stephens, 1998. World Ocean Atlas 1998. Volume 11: Nutrients and Chlorophyll of the Pacific Ocean. NOAA Atlas NESDIS 37.U.S. Gov. Printing Office, Wash., D.C., 245 pp.
- Conkright, T. O' Brien, M., S. Levitus, T.P. Boyer, J. Antonov, C. Stephens, 1998. World Ocean Atlas 1998. Volume 12: Nutrients and Chlorophyll of the Indian Ocean. NOAA Atlas NESDIS 38.U.S. Gov. Printing Office, Wash., D.C., 245 pp.
World Ocean Atlas, 1994series:
- Conkright, M.E., S. Levitus, and T.P. Boyer, 1994. World Ocean Atlas 1994, Volume 1: Nutrients. NOAA Atlas NESDIS 1, U.S. Department of Commerce, NOAA, NESDIS.
- Levitus, S., and T. P. Boyer, 1994. World Ocean Atlas 1994, Volume 2: Oxygen. NOAA Atlas NESDIS 2, U.S. Department of Commerce, NOAA, NESDIS.
- Levitus, S., R. Burgett and T.P. Boyer, 1994. World Ocean Atlas 1994, Volume 3: Salinity. NOAA Atlas NESDIS 3, U.S. Department of Commerce, NOAA, NESDIS.
- Levitus, S., and T.P. Boyer, 1994. World Ocean Atlas 1994, Volume 4: Temperature. NOAA Atlas NESDIS 4, U.S. Department of Commerce, NOAA, NESDIS.
- da Silva, A.M., C.C. Young and S. Levitus, 1994. Atlas of Surface Marine Data 1994, Volume 1: Algorithms and Procedures. NOAA Atlas NESDIS 6. U.S. Department of Commerce, NOAA, NESDIS.
- da Silva, A.M., C.C. Young and S. Levitus, 1994. Atlas of Surface Marine Data 1994, Volume 2: Anomalies of Directly Observed Quantities. NOAA Atlas NESDIS 7. U.S. Department of Commerce, NOAA, NESDIS.
##
Cite this page
Acknowledgement of any material taken from or knowledge gained from this page is appreciated:
Mishonov, Alexey & National Center for Atmospheric Research Staff (Eds). Last modified "The Climate Data Guide: World Ocean Atlas 2013 (WOA13).” Retrieved from https://climatedataguide.ucar.edu/climate-data/world-ocean-atlas-2013-woa13 on 2026-05-30.
Citation of datasets is separate and should be done according to the data providers' instructions. If known to us, data citation instructions are given in the Data Access section, above.
Acknowledgement of the Climate Data Guide project is also appreciated:
Schneider, D. P., C. Deser, J. Fasullo, and K. E. Trenberth, 2013: Climate Data Guide Spurs Discovery and Understanding. Eos Trans. AGU, 94, 121–122, https://doi.org/10.1002/2013eo130001
Key Figures
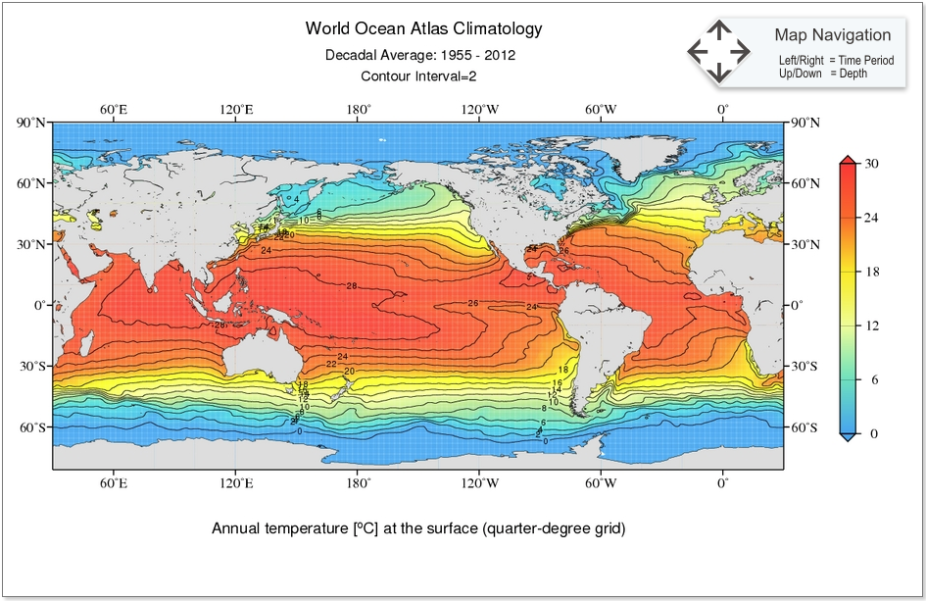
Figure 1. Annual temperature at the surface (quarter-degree grid) for 1955-2012 time period
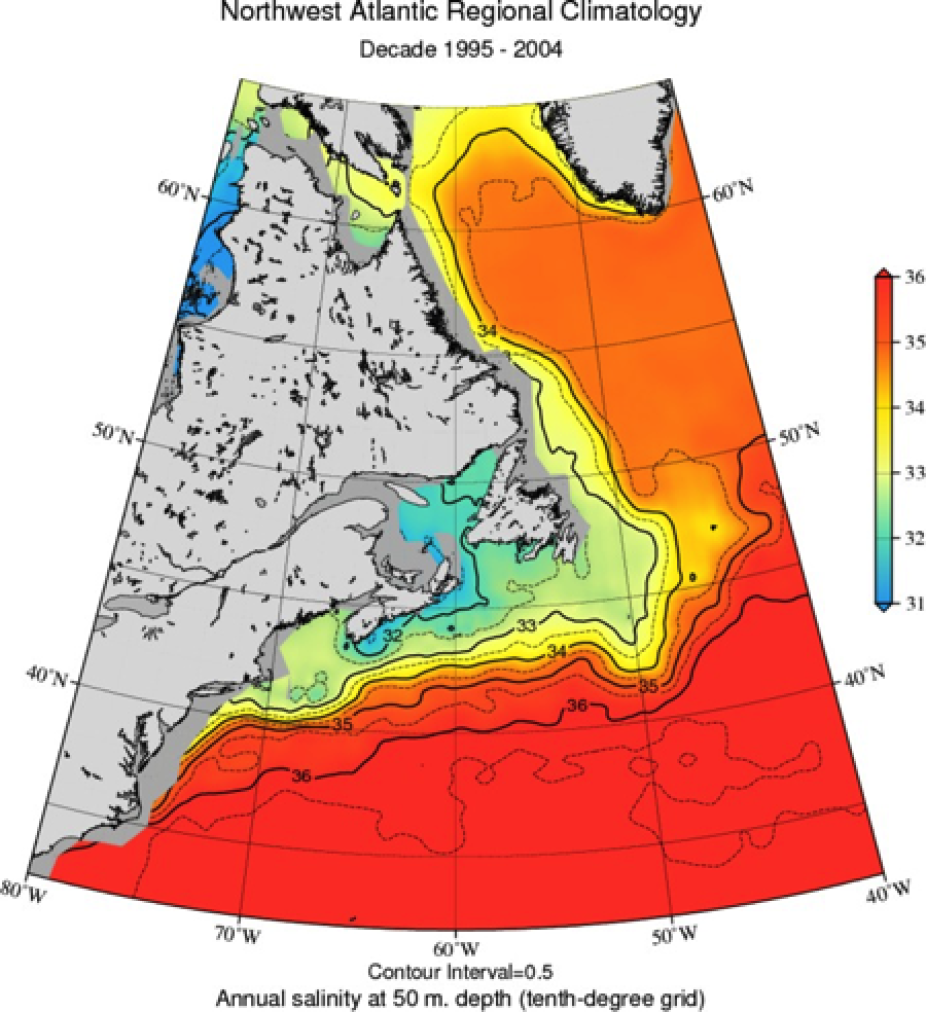
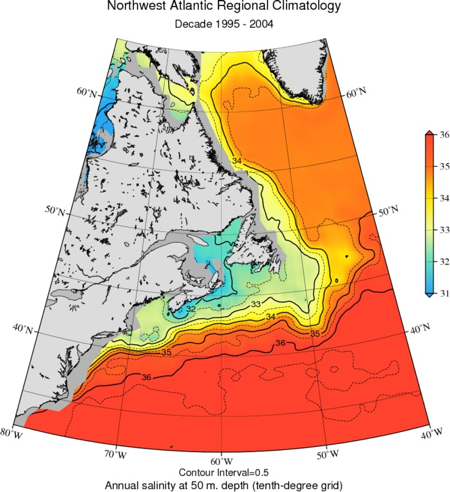
Figure 2a. NWA RC: Northwest Atlantic regional Sea Water Salinity Annual fields for period of 1995-2004 at 50m depth compiled on one tenths-degree longitude-latitude spatial grid.
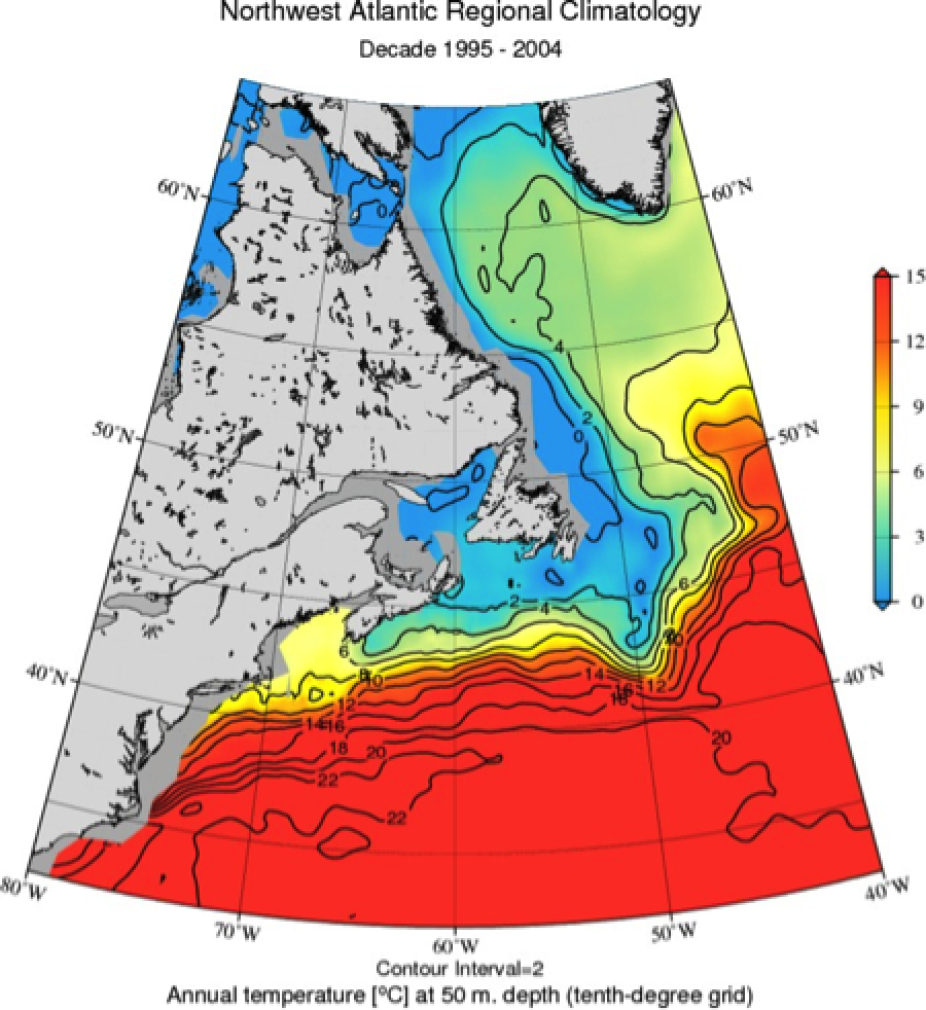
Figure 2b. NWA RC: Northwest Atlantic regional Sea Water Temperature Annual fields for period of 1995-2004 at 50m depth compiled on one tenths-degree longitude-latitude spatial grid.
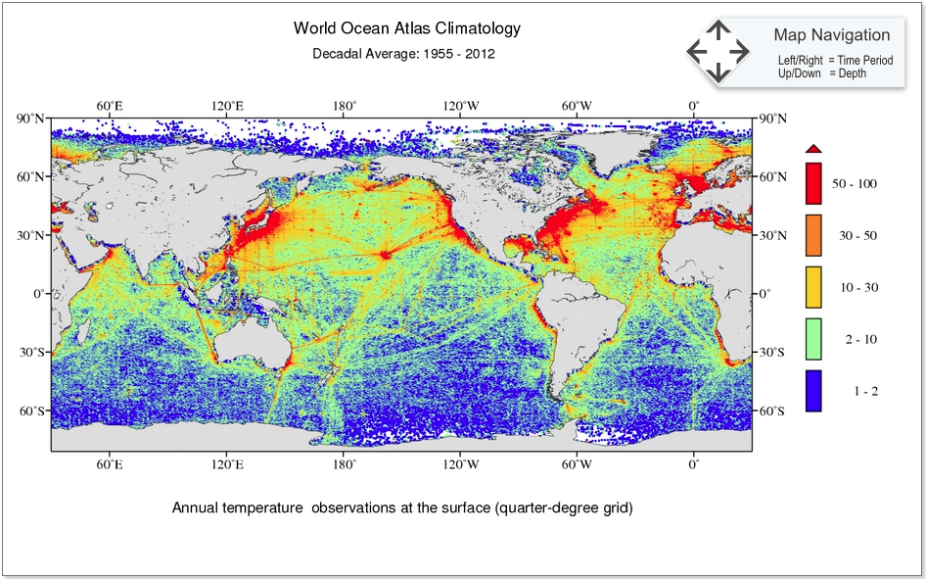
Annual temperature observation at the surface (quarter-degree grid) for 1955-2012 time period
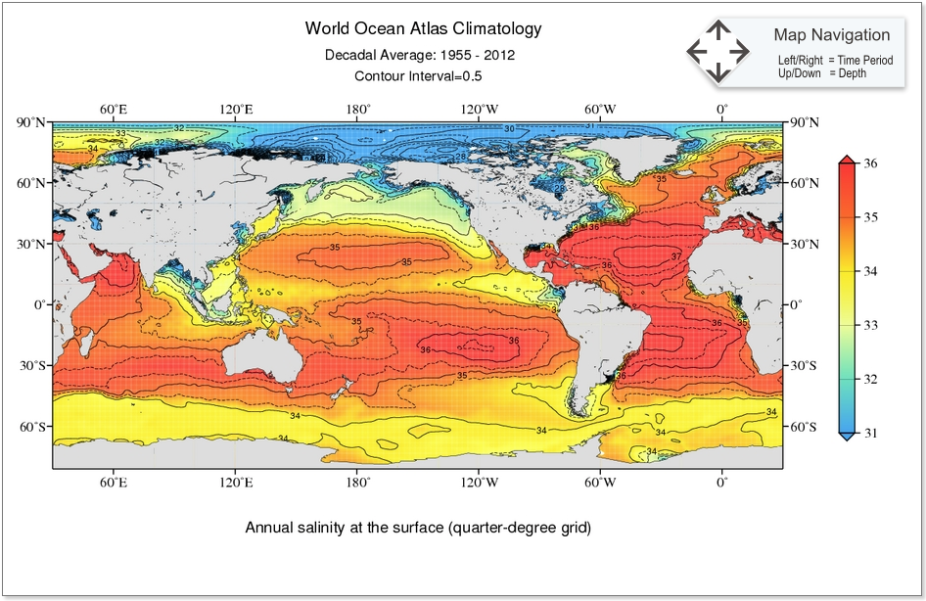
Annual salinity at the surface (quarter-degree grid) for 1955-2012 time period
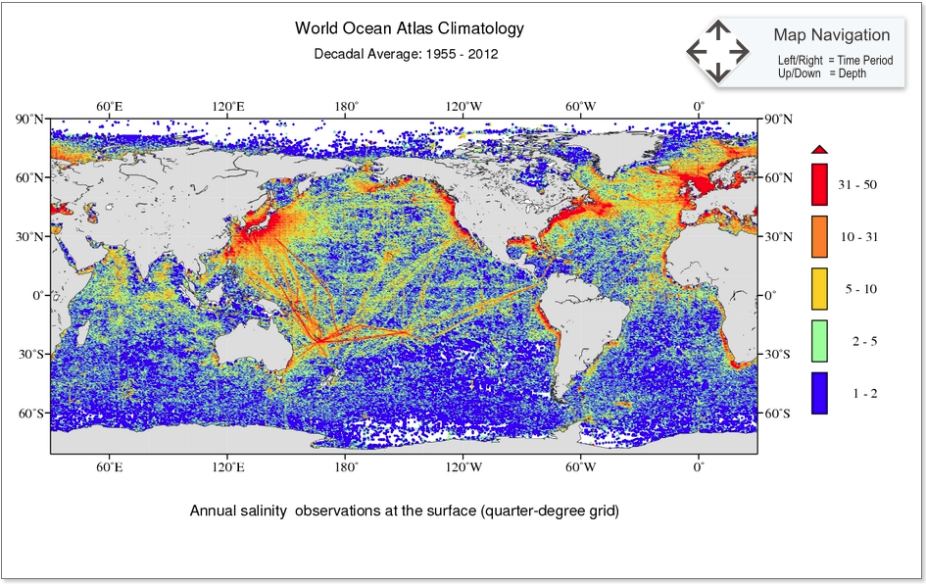
Annual salinity observation at the surface (quarter-degree grid) for 1955-2012 time period