Combined CloudSat spaceborne radar and CALIPSO spaceborne lidar cloud fraction dataset (3S-GEOPROF-COMB)
A global (82S-82N) cloud fraction data set, providing a unique view of cloud vertical structure, has been developed based on the complimentary spaceborne remote sensing capabilities of the CloudSat radar and the CALISPSO lidar. The data set provides monthly mean cloud fraction over several vertical layers for 2006-2019.
Key Strengths
Provides vertical cloud structure, at 240m vertical resolution, by taking advantage of the complimentary cloud sensing capabilities of CloudSat and CALIPSO
One of the better data sets for polar clouds
Key Limitations
Limited temporal sampling, limited record length, and coarse spatial resolution
Reduced data coverage 2011-2019 due to the CloudSat switch to Daylight-Only Operations
Bertrand, W., J. E. Kay, J. Haynes, and G. de Boer, 2023: 3S-GEOPROF-COMB: A Global Gridded Dataset for Cloud Vertical Structure from combined CloudSat and CALIPSO observations. https://doi.org/10.5281/ZENODO.8057790.
Expert Developer Guidance
The following was contributed by Leah Bertrand and Jennifer Kay, July, 2023:
The 3S-GEOPROF-COMB product is a globally-gridded (level 3S) community data product summarizing geometrical profiles (-GEOPROF) of hydrometeor occurrence from combined (-COMB) CloudSat and CALIPSO observations (Bertrand et al. 2023). CloudSat (a 94 GHz radar) and CALIPSO (a 532/1064 nm depolarization lidar) provide a unique global view of vertical cloud fraction and spatial distributions. When combined, they provide the best available global estimate of vertical cloud fraction. We have used the radar cloud mask (2B-GEOPROF R05, Marchand 2008) and the co-located lidar cloud mask (2B-GEOPROF-LIDAR P2 R05, Mace and Zhang 2014) datasets to produce cloud fraction climatologies.
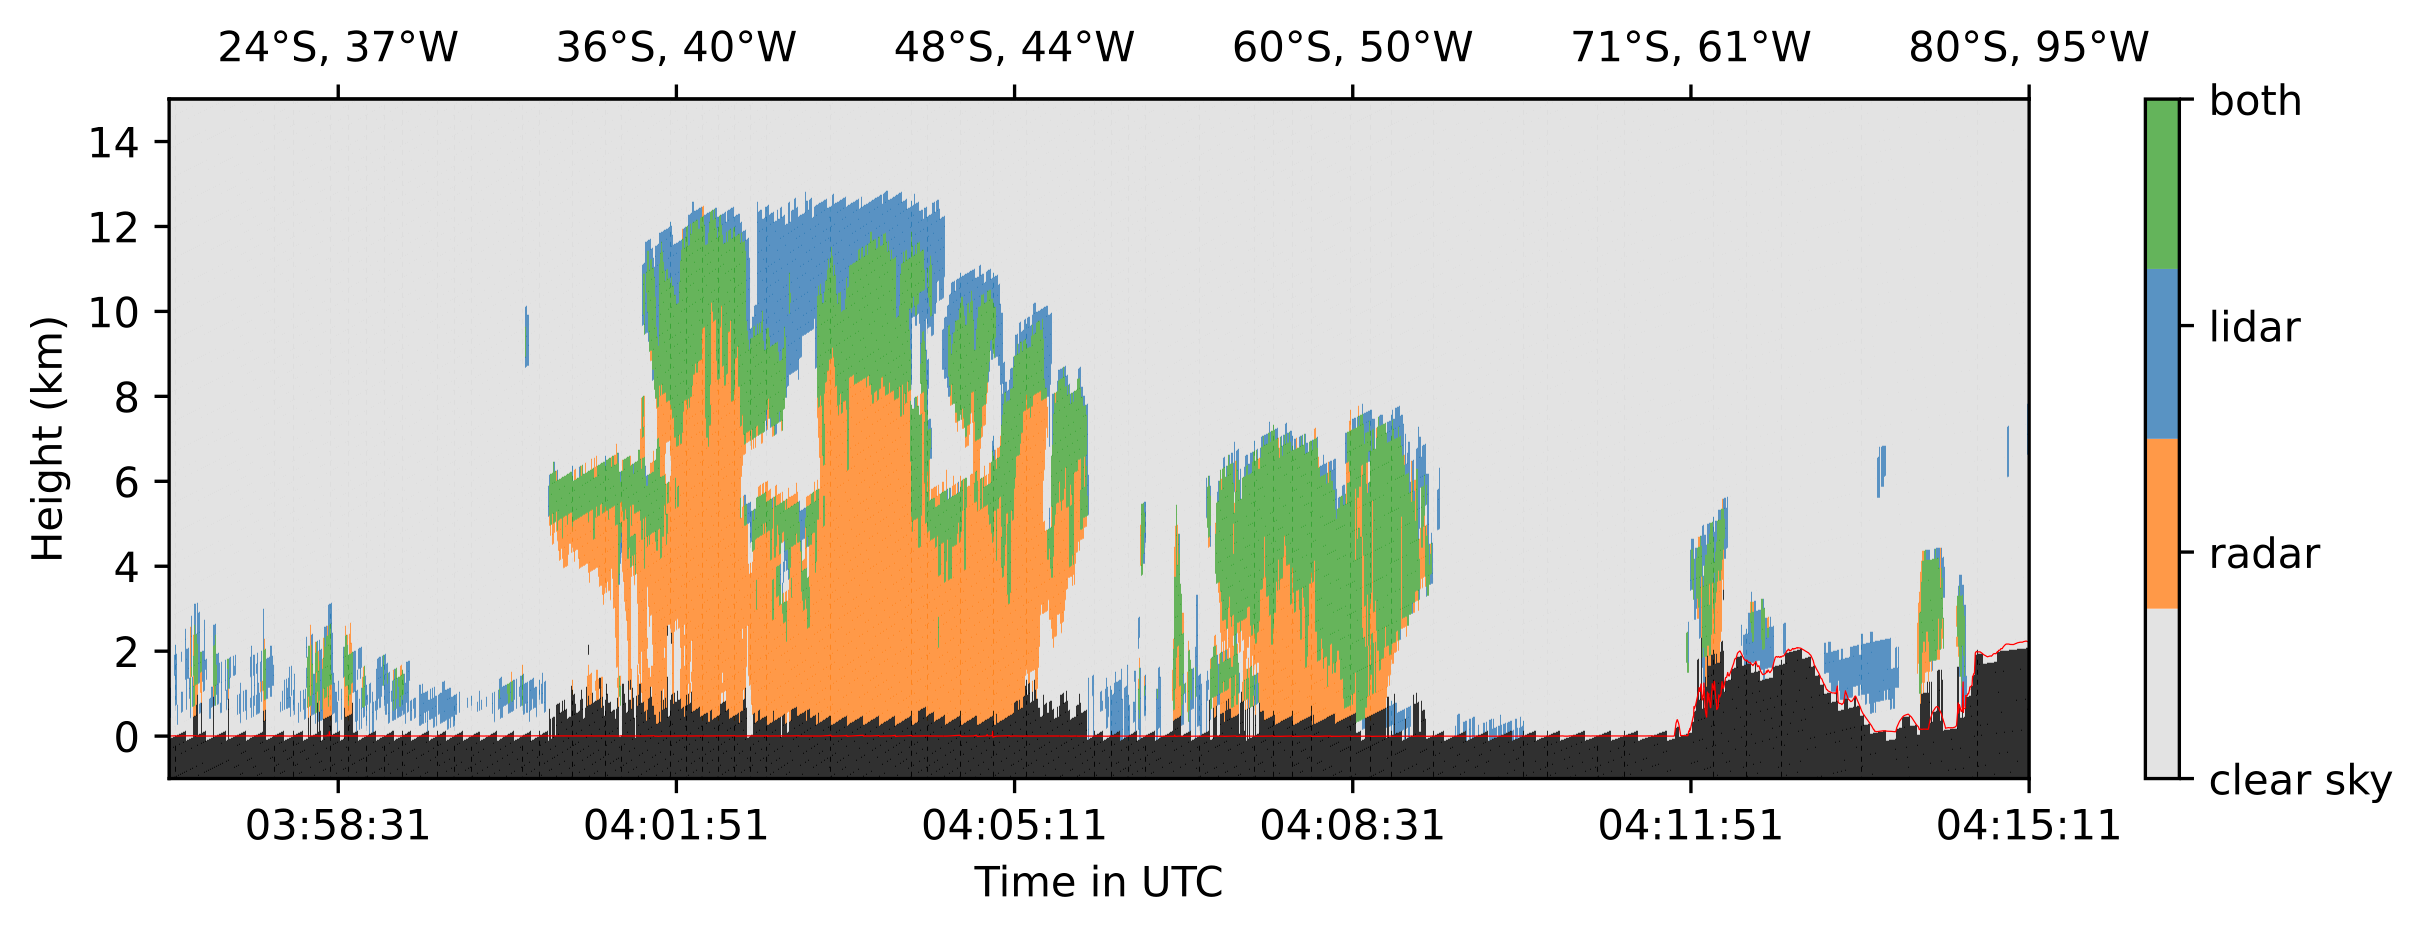
An example of the synergy of CloudSat and CALIPSO to detect clouds along a single orbit is shown in Figure 1. The lidar detects thin cloud at cloud top and low cloud that the radar misses (blue), while the radar detects most mid-level cloud that the lidar misses due to attenuation (orange). In all orbits (Figure 2), the lidar alone detects the majority of clouds above 13 km (blue), while the radar alone detects the most clouds from 1 to 8 km (orange).
We combine data from multiple orbits to produce gridded cloud fraction climatologies in netCDF format. For example, Figure 3b shows the zonal annual mean vertical cloud fraction from the combined CloudSat and CALIPSO product. CloudSat and CALIPSO provided the first look at the vertical structure of clouds resolved in this way. Figure 3a shows the annual mean total cloud cover map from CloudSat and CALIPSO.
CloudSat and CALIPSO provide insight into the vertical distribution of clouds at all latitudes where they are available (82 S to 82 N). Data files are distributed at monthly and seasonal frequency, at 2.5° x 2.5°, 5° x 5°, and 10° x 10° degree horizontal resolution, and 240 m vertical resolution. Because of their limited sampling, some data (e.g. 2.5° monthly) may not be significant in all grid cells. Users should look at the number of overpasses ("n_overpasses") and the diurnal cycle ("localhour_*") to quantify the sampling in their regions of interest (see e.g. Kotarba and Solecki 2021).
Users should note a change in CloudSat data collection patterns after April 2011, when the satellite switched to Daylight-Only Operations (DO-Op) mode. The greatest reductions are in the southern hemisphere during austral winter (JJA) and the smallest reductions are in the Arctic, with a global-mean 44% reduction in sampling. We provide users with the option to subsample the pre-2011 data to the post-2011 collection patterns using the "doop" coordinate, which estimates the effect of the reduced sampling on the data.
Though the climatologies are global, CloudSat and CALIPSO are especially useful in the polar regions (e.g. Kay et al. 2008, Kay and Gettelman 2009, Bromwich et al. 2012, Morrison et al. 2018). Unlike many satellite-based estimates of cloud amount, CloudSat and CALIPSO are "active" instruments that send radiation out and measure the return signal. As such, CloudSat and CALIPSO do not rely on thermal or albedo contrast to detect clouds and thus unlike many satellite retrieval algorithms, their cloud fraction masks are not confused by the atmospheric inversions or bright surfaces that are common in polar regions.
For further information, including evaluation of the dataset against comparable spaceborne and ground-based products, please see the data description paper Bertrand et al. 2023.##
Cite this page
Acknowledgement of any material taken from or knowledge gained from this page is appreciated:
Bertrand, Leah &, Kay, Jennifer & National Center for Atmospheric Research Staff (Eds). Last modified "The Climate Data Guide: Combined CloudSat spaceborne radar and CALIPSO spaceborne lidar cloud fraction dataset (3S-GEOPROF-COMB).” Retrieved from https://climatedataguide.ucar.edu/climate-data/combined-cloudsat-spaceborne-radar-and-calipso-spaceborne-lidar-cloud-fraction-dataset on 2026-02-27.
Citation of datasets is separate and should be done according to the data providers' instructions. If known to us, data citation instructions are given in the Data Access section, above.
Acknowledgement of the Climate Data Guide project is also appreciated:
Schneider, D. P., C. Deser, J. Fasullo, and K. E. Trenberth, 2013: Climate Data Guide Spurs Discovery and Understanding. Eos Trans. AGU, 94, 121–122, https://doi.org/10.1002/2013eo130001
Key Figures
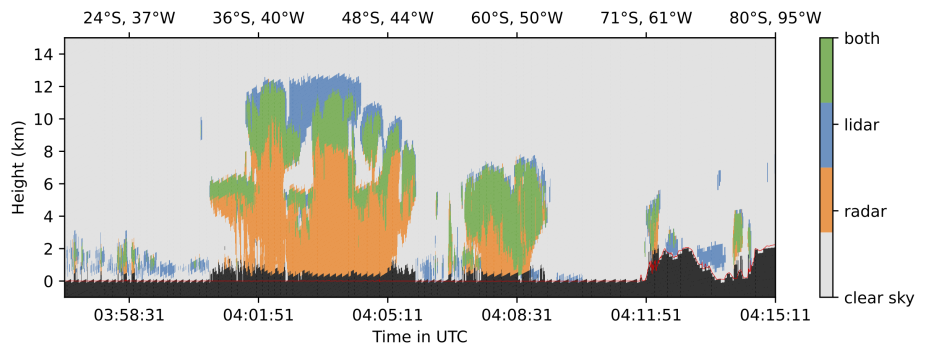
Example of CloudSat and CALIPSO cloud mask along a single orbit. From granule 23108, collected on 1 September 2010. Red line indicates surface height, grey indicates clear sky, and black indicates no observations (from radar surface clutter or subsurface data). (contributed by Leah Bertrand)
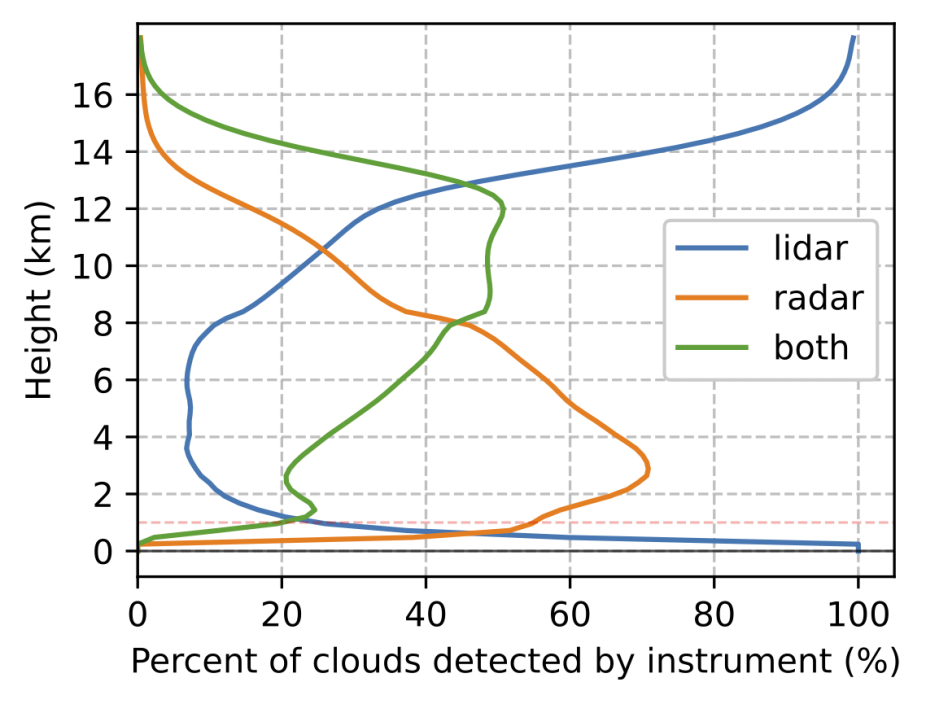
Instrument contribution to detected clouds by vertical level for the entire dataset. (contributed by Leah Bertrand)
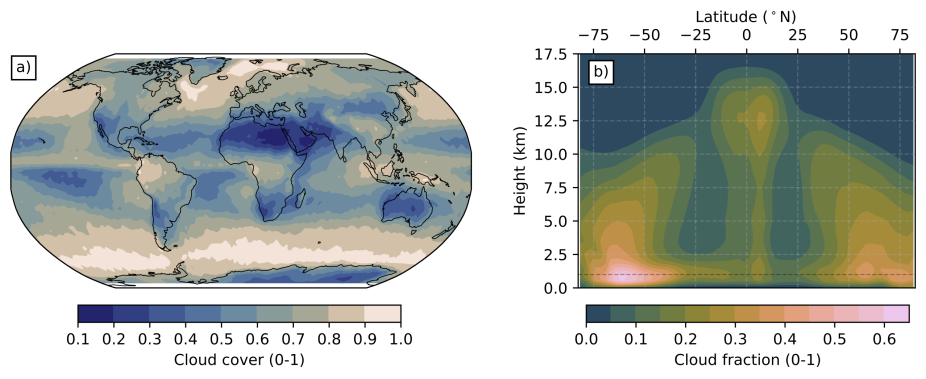
Annual mean a) cloud cover and b) zonal-mean vertical cloud fraction from CloudSat and CALIPSO (contributed by Leah Bertrand).
Other Information
- Bertrand, L., J. E. Kay, J. Haynes, and G. de Boer, 2024: A global gridded dataset for cloud vertical structure from combined CloudSat and CALIPSO observations. Earth Syst. Sci. Data, 16, 1301–1316, https://doi.org/10.5194/essd-16-1301-2024.
- Bromwich et al. 2012, Tropospheric clouds in Antarctica
- Kay et al. 2008, The contribution of cloud and radiation anomalies to the 2007 Arctic sea ice extent minimum
- Kay and Gettelman 2009, Cloud influence on and response to seasonal Arctic sea ice loss
- Mace et al. 2009, A description of hydrometeor layer occurrence statistics derived from the first year of merged Cloudsat and CALIPSO data
- Mace, G. G., and Q. Zhang, 2014: The CloudSat radar-lidar geometrical profile product (RL-GeoProf): Updates, improvements, and selected results. J. Geophys. Res. Atmos., 119, 9441–9462, https://doi.org/10.1002/2013jd021374.
- Marchand, R., G. G. Mace, T. Ackerman, and G. Stephens, 2008: Hydrometeor Detection Using Cloudsat—An Earth-Orbiting 94-GHz Cloud Radar. Journal of Atmospheric and Oceanic Technology, 25, 519–533, https://doi.org/10.1175/2007jtecha1006.1.
- Morrison, A. L., J. E. Kay, H. Chepfer, R. Guzman, and V. Yettella, 2018: Isolating the Liquid Cloud Response to Recent Arctic Sea Ice Variability Using Spaceborne Lidar Observations. JGR Atmospheres, 123, 473–490, https://doi.org/10.1002/2017jd027248.