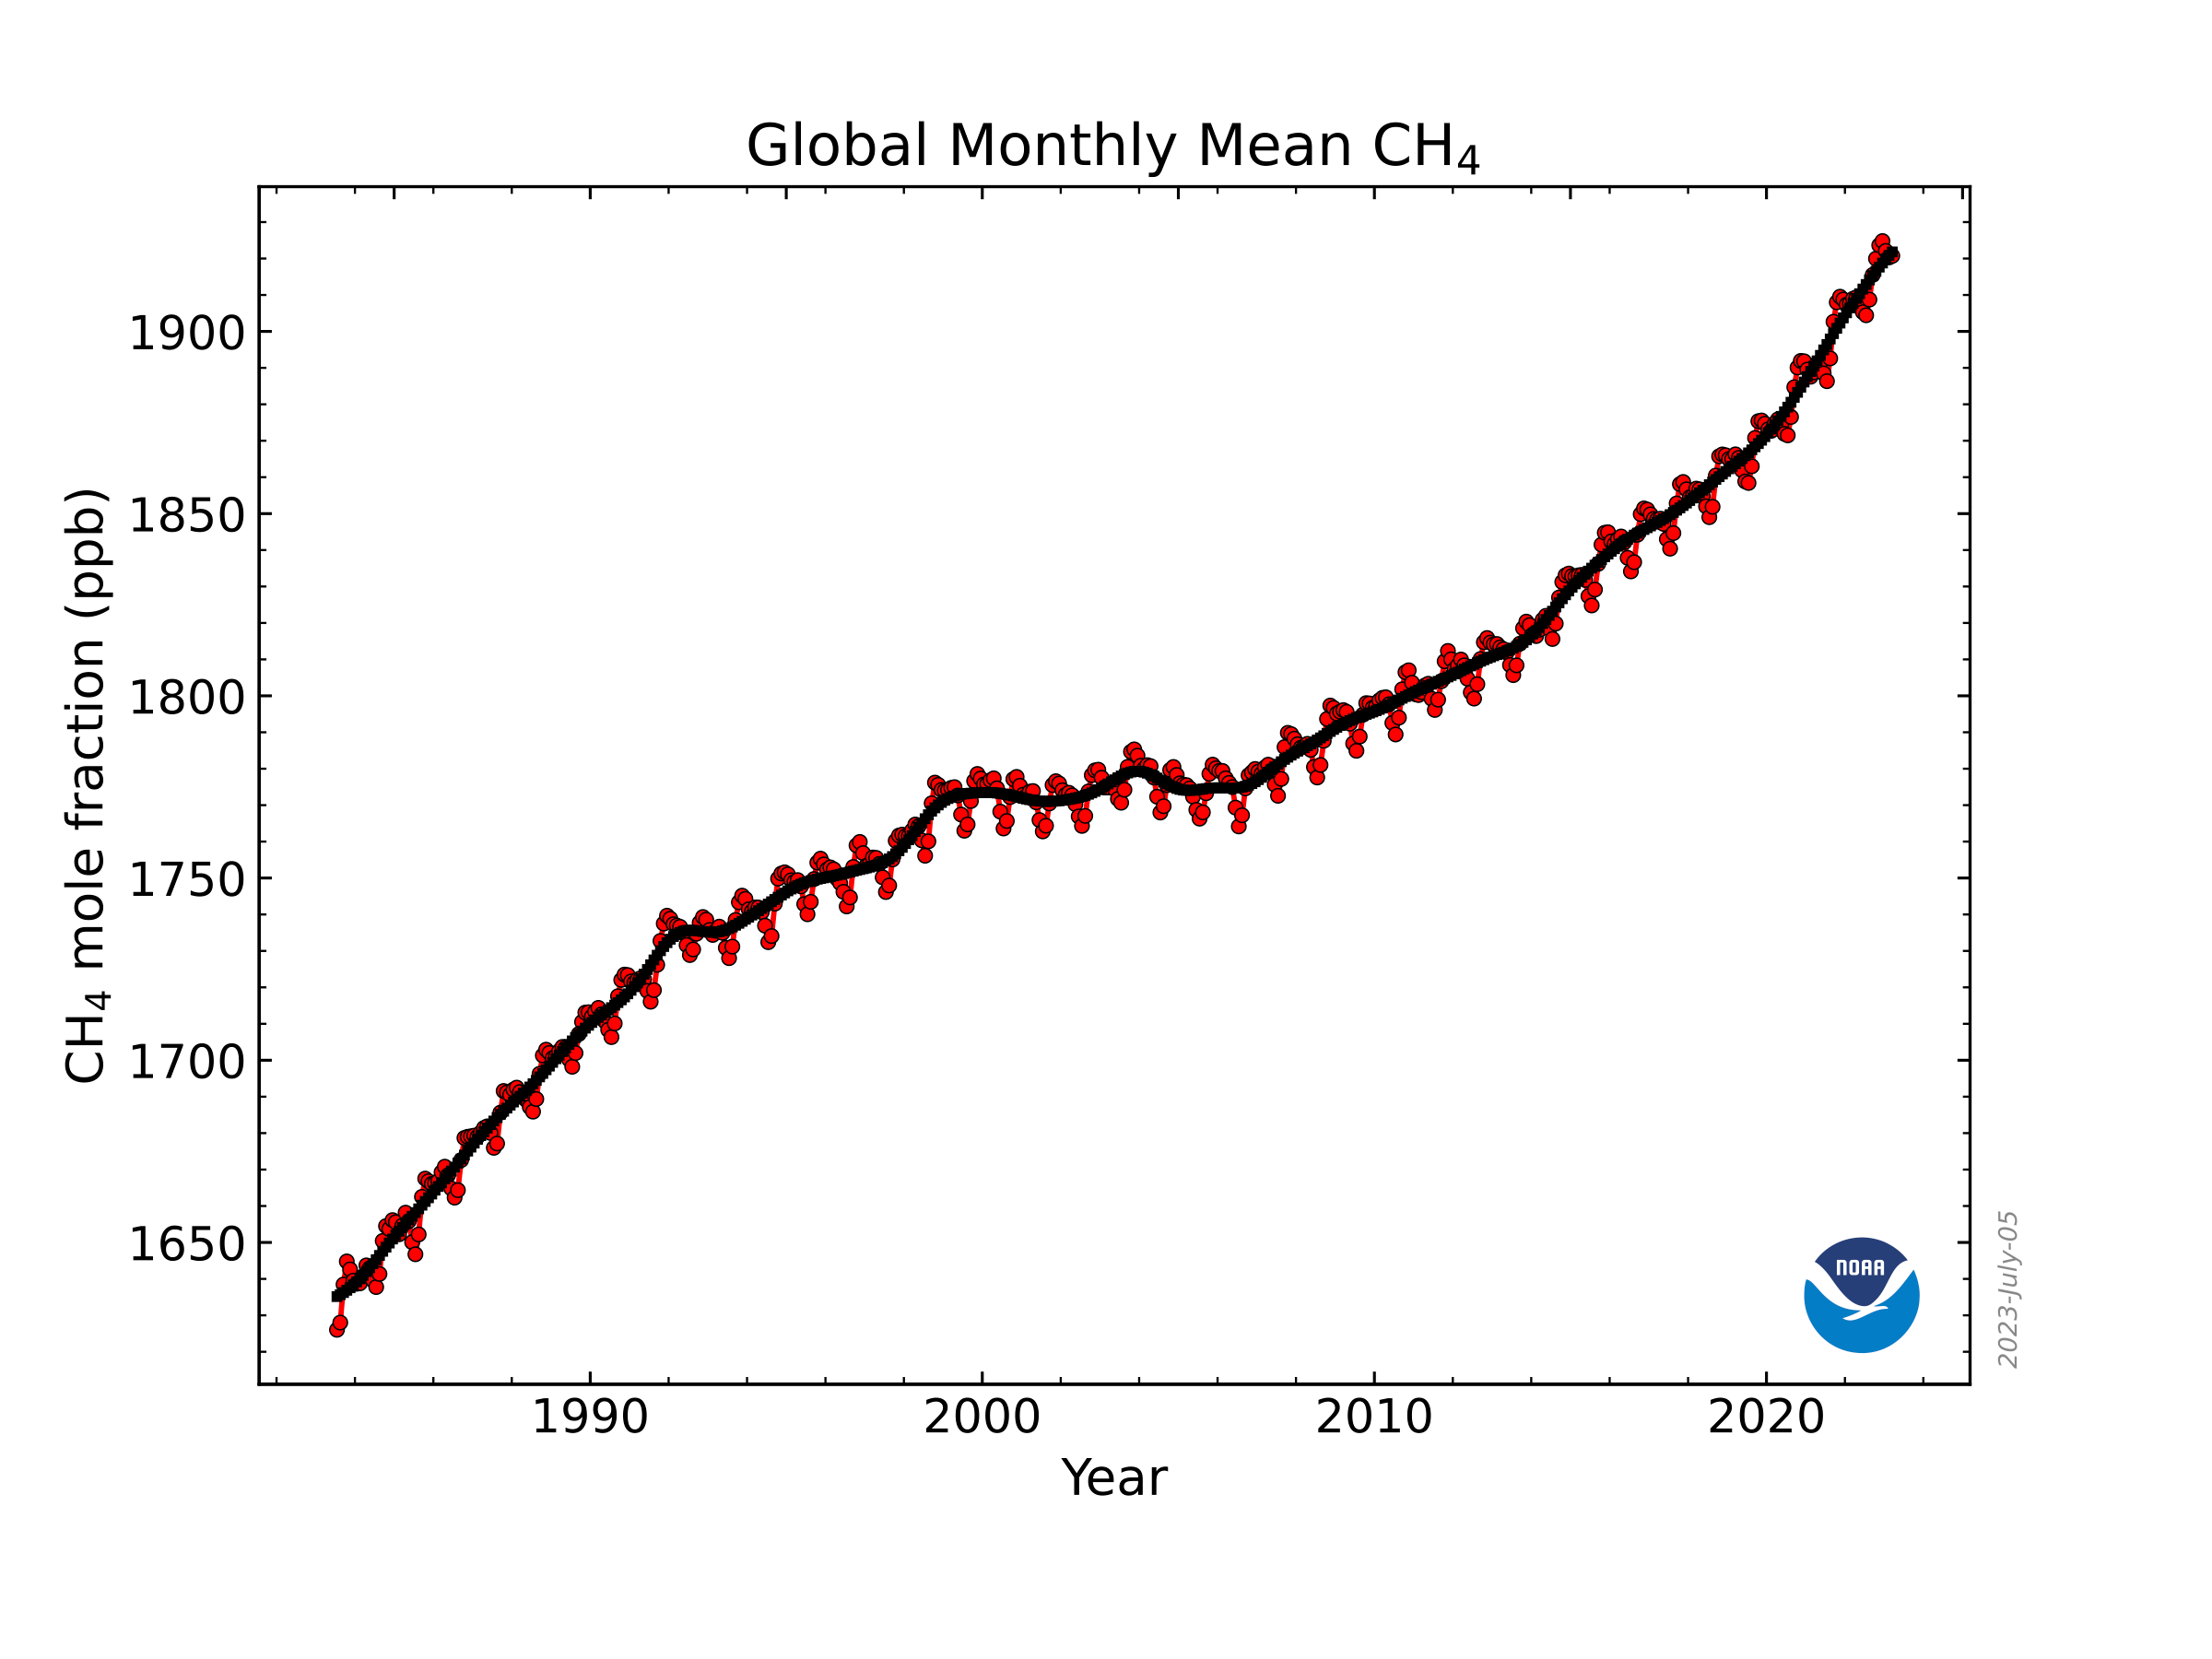
Global-mean methane at the Earth's surface from NOAA’s global cooperative greenhouse gas measurements
NOAA’s Global Monitory Laboratory has measured atmospheric methane levels since 1983 at a global cooperative greenhouse gases sampling network, which currently includes more than 50 sites. This measurement network is unique among greenhouse gases monitoring programs with its global coverage and long-term records. It aims to track the atmospheric abundances of long-lived greenhouse gases, determine their emissions and sinks (i.e., removal from the atmosphere) and understand carbon cycle feedback by providing accurate and precise measures on spatial and temporal distributions of the atmospheric abundances.
The global mean is calculated from a subset of the network's measurements from carefully selected clean marine boundary layer environments, where samples represent a large volume of background air.
Lan, X., K.W. Thoning, and E.J. Dlugokencky: Trends in globally-averaged CH4, N2O, and SF6 determined from NOAA Global Monitoring Laboratory measurements. Version {list year and month you obtained the data}, https://doi.org/10.15138/P8XG-AA10
Expert Developer Guidance
The following was contributed by Dr. Xin (Lindsay) Lin, July, 2023:
NOAA’s Global Monitory Laboratory has started to measure atmospheric methane levels since 1983 at a global cooperative greenhouse gases sampling network which includes more than 50 sites currently. This measurement network is unique among greenhouse gases monitoring programs with its global coverage and long-term records. It aims to track the atmospheric abundances of long-lived greenhouse gases, determine their emissions and sinks (i.e., removal from the atmosphere) and understand carbon cycle feedback by providing accurate and precise measures on spatial and temporal distributions of the atmospheric abundances.
Global mean methane at Earth’s surface is calculated from a subset of these measurements which are mostly from clean marine boundary layer (MBL) environments that can represent a large volume of background air. The global mean is calculated by first smoothing the measurement data for each site as a function of time to address uneven measurement over time domain, and then smoothing all site data by latitudes for proper surface area weighting. Detailed approach can be found here: https://gml.noaa.gov/ccgg/about/global_means.html
The global mean estimates are updated monthly (typically at the 5th of the month) on NOAA’s website: https://gml.noaa.gov/ccgg/trends_ch4 , based on all available MBL measurements data including those within the past one year that are preliminary (i.e., pass the preliminary Quality Assurance and Quality Control (QA/QC) evaluations). The estimated monthly mean has a delay of 3-4 months from real time to account for the time needed for shipping, gas composition analysis, dataset quality control and end-effect in calculation.
Air samples from this measurement network are taken in ~2 L borosilicate glass flasks in pair at approximately weekly frequency using a portable pumping package (PSU) (Figure. 1) and then shipped back to NOAA’s Global Monitory Laboratory in Boulder, Colorado for gas composition analysis. The pair sampling strategy ensures high measurement quality and also serves as a metric to evaluate background condition. All discrete air samples are analyzed using the same analytical system to ensure consistency across all site data. During sample analysis, each flask-air sample is bracketed by reference gas samples (i.e., before and after). The same reference gas is used with a series of gas standards during instrument calibration that yield a response curve to quantify an instrument’s response. The response curve is essential to determine the measured mole fraction of methane. Thus, all measurements are calibrated against known gas standards which are on WMO (World Meteorological Organization) scale that is maintained by NOAA GML: https://gml.noaa.gov/ccl/ch4_scale.html
NOAA’s global atmospheric methane measurements, and their estimated global means and annual growth rates of methane are the backbone for methane emission and sink studies. They are widely used in peer-review publication, scientific reports (e.g., IPCC AR6; State of the Climate - American Meteorological Society), and media communication. Atmospheric tracer transport models are frequently used by the research community to improve methane emission estimated from bottom-up approaches that are based on emission inventories and/or process-based modeling. The measured global mean methane levels and their annual growth rates serve as a fundamental constraint to global models through the air mass conservation requirement that the sum of global total methane emissions and the total sinks need to yield the measured atmospheric methane levels and their annual growths. The measured site data can either be used to compare with modelled output to evaluate model performance, or directly assimilated by inverse model to optimized model emissions. To compare modelled atmospheric methane abundances with NOAA’s global means from measurements, one would need to sample the model at the same location and time as for the actual site measurements to avoid representative error. NOAA’s global mean estimates are based on background marine boundary layer measurements, and thus do not represent continental abundance that are more subjective to nearby emissions and sinks.
All measurement data are freely available to researchers. ##
Cite this page
Acknowledgement of any material taken from or knowledge gained from this page is appreciated:
Lan, Xin & National Center for Atmospheric Research Staff (Eds). Last modified "The Climate Data Guide: Global-mean methane at the Earth's surface from NOAA’s global cooperative greenhouse gas measurements.” Retrieved from https://climatedataguide.ucar.edu/climate-data/global-mean-methane-earths-surface-noaas-global-cooperative-greenhouse-gas on 2026-07-20.
Citation of datasets is separate and should be done according to the data providers' instructions. If known to us, data citation instructions are given in the Data Access section, above.
Acknowledgement of the Climate Data Guide project is also appreciated:
Schneider, D. P., C. Deser, J. Fasullo, and K. E. Trenberth, 2013: Climate Data Guide Spurs Discovery and Understanding. Eos Trans. AGU, 94, 121–122, https://doi.org/10.1002/2013eo130001
Key Figures
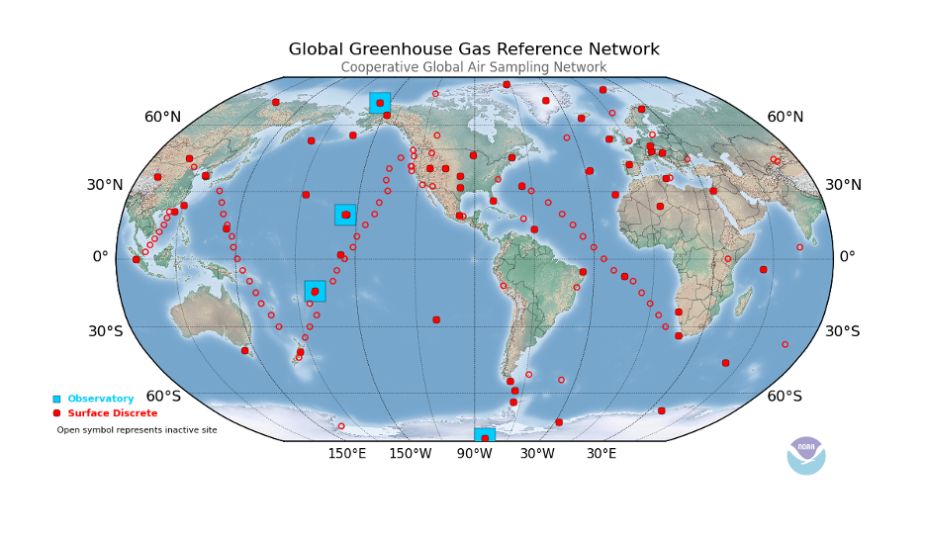
Map of sites in the Global Greenhouse Gas Reference Network (contributed by Xin Lan)
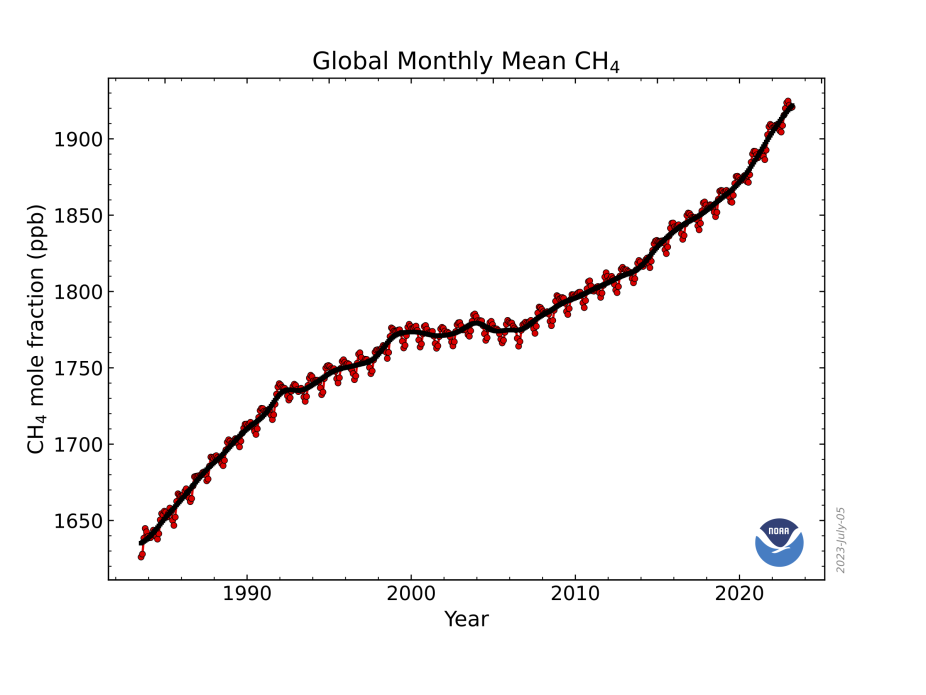
Timeseries of global-mean atmospheric methane from NOAA (https://gml.noaa.gov/webdata/ccgg/trends/ch4_trend_all_gl.png)
Other Information
- Lan, X., E. G. Nisbet, E. J. Dlugokencky, and S. E. Michel, 2021: What do we know about the global methane budget? Results from four decades of atmospheric CH 4 observations and the way forward. Phil. Trans. R. Soc. A., 379, 20200440, https://doi.org/10.1
- Dlugokencky, E. J., L. P. Steele, P. M. Lang, and K. A. Masarie, 1994: The growth rate and distribution of atmospheric methane. J. Geophys. Res., 99, 17021, https://doi.org/10.1029/94jd01245.
- Masarie, K. A., and P. P. Tans, 1995: Extension and integration of atmospheric carbon dioxide data into a globally consistent measurement record. J. Geophys. Res., 100, 11593, https://doi.org/10.1029/95jd00859.