Climate data guide content with tag Surface Data Set
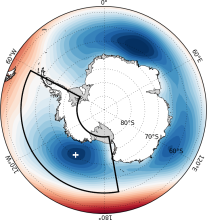 Amundsen Sea Low indices
Years of record
- to
The Amundsen Sea Low (ASL) is a climatological low pressure center located over the extreme southern Pacific Ocean, off the coast of West Antarctica. Atmospheric variability in this region is larger than anywhere else in the Southern Hemisphere, and exhibits significant correlations with both the Southern Annular Mode (SAM) and ENSO. Given its linkages to…
-
Timestep
- Monthly, Seasonal, Annual
-
Collections
- N/A
Experts contributing reviews
- Hosking, Scott
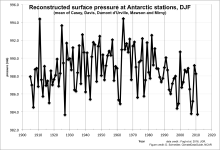 Antarctic Seasonal Pressure Reconstructions 1905-2013
Years of record
- to
This dataset consists of seasonally resolved timeseries of surface pressure at 18 Antarctic research stations, spanning 1905-2013. Routine meteorological observations began at most of these stations only around 1960, leaving a very short instrumental record on which to assess Antarctic climate variability and change. Surface pressure is one of the most…
-
Formats
- ascii, Spreadsheet
-
Timestep
- Seasonal
-
Domain
- Antarctic
-
Collections
- N/A
Experts contributing reviews
- N/A
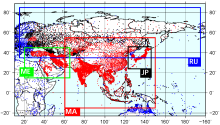 APHRODITE: Asian Precipitation - Highly-Resolved Observational Data Integration Towards Evaluation of Water Resources
Years of record
- to
APHRODITE’s (Asian Precipitation - Highly-Resolved Observational Data Integration Towards Evaluation) gridded precipitation is a set of long-term (1951 onward) continental-scale daily products that is based on a dense network of rain-gauge data for Asia including the Himalayas, South and Southeast Asia and mountainous areas in the Middle East. The gridded products are…
Experts contributing reviews
- Maeda, Mio, Yasutomi, Natsuko, Yatagai, Akiyo
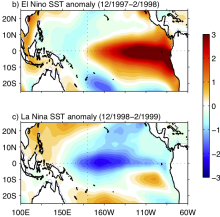 Asymmetry and Diversity in the pattern, amplitude and duration of El Niño and La Niña
Years of record
- N/A
El Niño and La Niña, the two phases of ENSO, are sometimes described as opposites. However, there are asymmetries in their spatial structure, amplitude, duration and seasonal evolution. This leads to differing teleconnections and global impacts, as well as implications for ENSO predictability. The 'Expert Guidance' section of this post summarizes the metrics used to…
-
Formats
- N/A
-
Timestep
- N/A
-
Domain
- Tropics
-
Collections
- N/A
Experts contributing reviews
- Santoso, Agus
 Atlantic Multi-decadal Oscillation (AMO) and Atlantic Multidecadal Variability (AMV)
Years of record
- to
The Atlantic Multi-decadal Oscillation (AMO) has been identified as a coherent mode of natural variability occurring in the North Atlantic Ocean with an estimated period of 60-80 years. It is based upon the average anomalies of sea surface temperatures (SST) in the North Atlantic basin, typically over 0-80N. To remove the signal of long-term change from the AMO…
-
Timestep
- Monthly, Decadal
-
Collections
- Climate Analysis Section (CAS) Data Catalog
Experts contributing reviews
- Trenberth, Kevin, Zhang, Rong
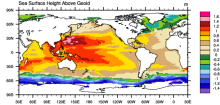 AVISO: Satellite derived Sea Surface Height above Geoid
Years of record
- to
The sea surface height relative to the geoid (the mean ocean surface of the Earth if the ocean is at rest) is derived from TOPEX/Poseidon, Envisat, Jason-1, and OSTM/Jason-2 altimetry measurements. Altimetry is a technique for measuring height. Satellite altimetry measures the time taken by a radar pulse to travel from the satellite antenna to the surface and back to…
Experts contributing reviews
- N/A
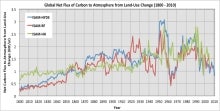 Carbon Emissions from Historical Land-Use and Land-Use Change
Years of record
- to
Annual net land-atmosphere carbon flux and net flux of carbon to the atmosphere due to land-use and land-use change (LULUC) are estimated using an integrated assessment model and three historical reconstructions of land use and land use conversion. The data span 1800-2010 and are aggregated for nine regions of the globe.
Main variables and Earth System components
Biosphere CO2 Land CO2 Land-Atmosphere flux Land Cover Type Land Use ConversionExperts contributing reviews
- Meiyappan, Prasanth
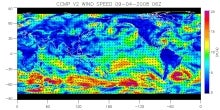 CCMP: Cross-Calibrated Multi-Platform wind vector analysis
Years of record
- to
The CCMP wind analysis is a near-global, high spatial and temporal resolution gridded dataset of surface wind vectors spanning 1987-present. The input data are a combination of inter-calibrated satellite data from numerous radiometers and scatterometers and in-situ data from moored buoys. An algorithm finds a best-fit solution to all of the available…
Experts contributing reviews
- Ricciardulli, Lucrezia
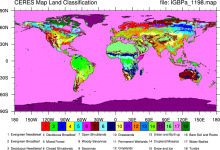 CERES: IGBP Land Classification
Years of record
- N/A
The International Geosphere–Biosphere Programme (IGBP) defines ecosystems surface classifications. The CERES (Clouds and Earth's Radiant Energy System)10-minute data can be used to derive the land categories.
Experts contributing reviews
- N/A
 CHELSA high-resolution land surface temperature and precipitation
Years of record
- to
The Climatologies at high resolution for the Earth's land surface (CHELSA) dataset contains high spatial resolution monthly climatologies of mean, maximum and minimum temperatures and mean precipitation, representing the period 1979-2013. CHELSA is essentially a statistical downscaling of the ERA-Interim reanalysis, with the temperature downscaling based on mean…
Experts contributing reviews
- Karger, Dirk
 CHIRPS: Climate Hazards InfraRed Precipitation with Station data (version 2)
Years of record
- to
Note: CHIRPS v2 has been superseded by CHIRPS v3 as of June 2025. Climate Hazards Group InfraRed Precipitation with Station data (CHIRPS) is a quasi-global (50S - 50N), land-only rainfall dataset with a range of temporal and spatial resolutions depending on the region and the time period. Data can be found at 0.05 deg or 0.1 deg resolution, and can be found at 6-hourly…
Experts contributing reviews
- Touma, Danielle, Martinez, Carlos
 CHIRPS: Climate Hazards InfraRed Precipitation with Station data (Version 3)
Years of record
- to
Climate Hazards Group InfraRed Precipitation with Station data version 3 (CHIRPS v3)is a 1981-present, land-only, high resolution 0.05° gridded precipitation dataset. It combines thermal-infrared geostationary satellite-based estimates (CHIRP3), in situ observations from global, regional, and national meteorological networks, and a high-resolution climatology (CHPclim2…
Main variables and Earth System components
Precipitation-
Formats
- GeoTIFF
-
Timestep
- Climatology, Monthly, Annual, Pentad
-
Domain
- Africa, Global, South America
-
Collections
- N/A
Experts contributing reviews
- Alaso, Daniella
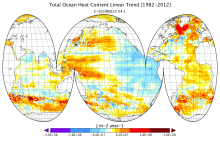 CMCC Global Ocean Reanalysis System (C-GLORS)
Years of record
- to
"The CMCC Global Ocean Physical Reanalysis System (C-GLORS) is used to simulate the state of the ocean in the last decades. It consists of a variational data assimilation system (OceanVar), capable of assimilating all in-situ observations along with altimetry data, and a forecast step performed by the ocean model NEMO coupled with the LIM2 sea-ice model…
Main variables and Earth System components
Ocean Ocean Heat Content SST - sea surface temperature Salinity Sub Surface Salinity Sub Surface Temperature mixed layer depth sea surface height u, v current componentsExperts contributing reviews
- Storto, Andrea
 CMORPH (CPC MORPHing technique): High resolution precipitation (60S-60N)
Years of record
- to
"CMORPH (CPC MORPHing technique) produces global precipitation analyses at very high spatial and temporal resolution. This technique uses precipitation estimates that have been derived from low orbiter satellite microwave observations exclusively, and whose features are transported via spatial propagation information that is obtained entirely from geostationary satellite…
Experts contributing reviews
- N/A
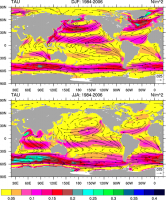 COREv2 Air-Sea Surface Fluxes
Years of record
- to
The Coordinated Ocean Research Experiments version 2 (COREv2) data set consists of a globally complete set of air-sea fluxes of momentum, heat and freshwater for 1948-2009 at monthly resolution. This data set serves as a set of common atmospheric boundary conditions that has been used by the ocean modeling community to force and compare a diverse set of…
Main variables and Earth System components
Atmosphere Evaporation Precipitation Radiation Wind Stress Land Runoff and Streamflow Ocean Surface Flux-
Formats
- netCDF
-
Timestep
- Monthly
-
Domain
- Global
-
Collections
- Diagnostic Data Sets, NCAR-DOE-CESM, atmosdiagnostics, oceandiagnostics
Experts contributing reviews
- Yeager, Stephen
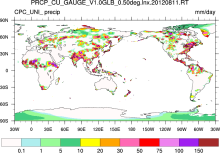 CPC Unified Gauge-Based Analysis of Global Daily Precipitation
Years of record
- to
A gauge-based analysis of daily precipitation has been constructed over the global land areas. Gauge reports from over 30,000 stations are collected from multiple sources including GTS, COOP, and other national and international agencies. Quality control is performed through comparisons with historical records and independent information from measurements at nearby…
Experts contributing reviews
- N/A
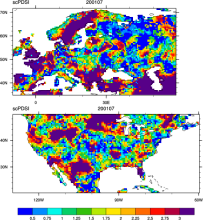 CRU sc-PDSI (self-calibrating PDSI) over Europe & North America
Years of record
- to
Maps of the monthly self-calibrating Palmer drought severity index (SCPDSI) have been calculated for the period 1901–2002 for the contiguous United States (20°–50°N and 130°–60°W) and Europe (35°–70°N, 10°W–60°E) with a spatial resolution of 0.5° × 0.5°
-
Formats
- ascii
-
Timestep
- Monthly
-
Domain
- Europe, North America
-
Collections
- N/A
Experts contributing reviews
- N/A
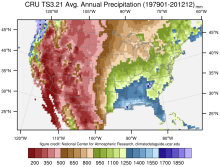 CRU TS Gridded precipitation and other meteorological variables since 1901
Years of record
- to
The CRU TS series of data sets (CRU TS = Climatic Research Unit Time series) contain gridded monthly fields of precipitation, daily maximum and minimum temperatures, cloud cover, and other variables covering Earth's land areas for 1901-2022 (CRU TS4.0 is the recent major release). The data set is gridded to 0.5x0.5 degree resolution, based on analysis of over 4000…
Main variables and Earth System components
Atmosphere Air Temperature Cloud Properties Maximum Air Temperature Minimum Air Temperature Potential Evapotranspiration PrecipitationExperts contributing reviews
- N/A
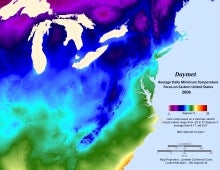 Daymet: Daily Surface Weather and Climatological Summaries
Years of record
- to
Daymet provides long-term, continuous, gridded estimates of daily weather and climatology variables by interpolating and extrapolating ground-based observations through statistical modeling techniques. The Daymet data products provide driver data for biogeochemical terrestrial modeling and have myriad applications in many Earth science, natural resource, biodiversity,…
Main variables and Earth System components
Atmosphere Maximum Air Temperature Minimum Air Temperature Precipitation Radiation Water Vapor Cryosphere Snow Water Equivalent-
Timestep
- Climatology, Daily
-
Domain
- North America
-
Collections
- N/A
Experts contributing reviews
- Thornton, Peter E
 E-OBS: High-resolution gridded mean/max/min temperature, precipitation and sea level pressure for Europe & Northern Africa
Years of record
- to
E-OBS is a high spatial resolution daily gridded data that covers the European region and is based on the station data collated by the ECA&D initiative (Klein Tank et al., 2002). These data are supplied by many European National Meteorological Services and other data providers across Europe and the Middle East. The dataset spans the period 1 January 1950 to the…
Main variables and Earth System components
Atmosphere Air Temperature Maximum Air Temperature Minimum Air Temperature Precipitation Sea Level PressureExperts contributing reviews
- van der Schrier, Gerard
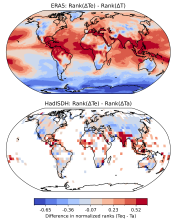 Equivalent Temperature: HadISDH.land and ERA5
Years of record
- to
Equivalent temperature is a measure of heat in the atmosphere that accounts for the latent heat stored in water vapor in addition to sensible heat as measured by temperature. The equivalent temperature ($T_e$) scales linearly with the moist enthalpy (i.e., the temperature and humidity) of the atmosphere. Te is computed from: $$T_e = T + \frac{L_v}{C_p} q \tag{1}$$ in…
-
Formats
- N/A
-
Timestep
- Monthly
-
Domain
- Global
-
Collections
- BAMS State of the Climate
Experts contributing reviews
- Matthews, Tom
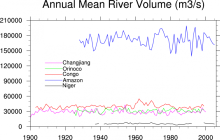 Freshwater Discharge: 1948-2004
Years of record
- to
"A dataset of historical monthly streamflow at the farthest downstream stations for the world’s 925 largest ocean-reaching rivers has been created for community use. Compared with previous studies, the new dataset has improved homogeneity and enables more reliable assessments of decadal and long-term changes in continental freshwater discharge into the oceans." The data…
-
Timestep
- Monthly
-
Domain
- Global
-
Collections
- Climate Analysis Section (CAS) Data Catalog
Experts contributing reviews
- N/A
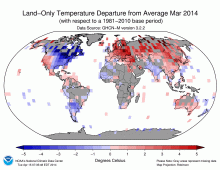 GHCN (Global Historical Climatology Network) Related Gridded Products
Years of record
- to
Long time series of gridded surface temperature and precipitation data derived from homongenized station data. The gridded anomalies were produced from GHCN-M bias corrected data. GHCN data and CAMS (Climate Anomaly Monitoring System) are combined to produce a high resolution 'real-time' product.
Main variables and Earth System components
N/AExperts contributing reviews
- N/A
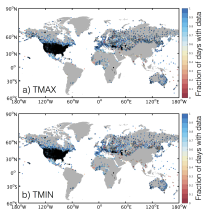 GHCN-D: Global Historical climatology Network daily temperatures
Years of record
- to
The Global Historical Climatology Network Daily database, GHCN-D, contains meteorological measurements from over 90,000 stations across the globe. The majority of station records contain precipitation data only, however other key variables including maximum temperature, minimum temperature, snowfall, cloudiness, wind speed and snow depth are available at many…
Main variables and Earth System components
Atmosphere Maximum Air Temperature Minimum Air Temperature PrecipitationExperts contributing reviews
- McKinnon, Karen
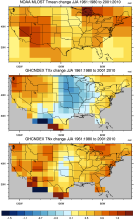 GHCNDEX: Gridded Temperature and Precipitation Climate Extremes Indices (CLIMDEX data)
Years of record
- to
GHCNDEX provides gridded, station-based indices of temperature- and precipitation- related climate extremes. It is intended for detection and attribution studies, climate model evaluation, and operational monitoring of extreme climatic events. Twenty-six indices, including daily maximum and minimum temperatures, number of frost days, maximum 1-day precipitation, and…
Main variables and Earth System components
Atmosphere Maximum Air Temperature Minimum Air Temperature Land Freeze/ThawExperts contributing reviews
- N/A
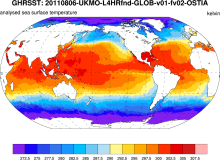 GHRSST: Group for High Resolution Sea Surface Temperature
Years of record
- to
The Group for High-Resolution Sea Surface Temperature (SST; GHRSST) provides a new generation of global high-resolution (10km) SST products to the operational oceanographic, meteorological, climate and general scientific community. The products are provided at a variety of processing levels including "gap-free" global grids. Each SST grid point must have associated with…
Experts contributing reviews
- N/A
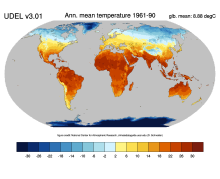 Global (land) precipitation and temperature: Willmott & Matsuura, University of Delaware
Years of record
- to
A series of gridded temperature and precipitation data sets. Station records that served as bases for the Terrestrial Air Temperature: 1900-2014 Gridded Monthly Time Series (Version 4.01) and Terrestrial Precipitation: 1900-2014 Gridded Monthly Time Series (Version 4.01) archives are used here to help create new gridded climatologies of monthly and annual average air…
Main variables and Earth System components
Atmosphere Air Temperature Air Temperature at 2m Precipitation-
Timestep
- Climatology, Monthly
-
Domain
- Global
-
Collections
- Diagnostic Data Sets, NCAR-DOE-CESM, atmosdiagnostics
Experts contributing reviews
- Matsuura, Kenji
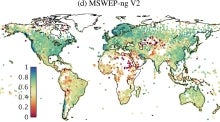 Global high-resolution precipitation: MSWEP
Years of record
- to
Multi-Source Weighted-Ensemble Precipitation (MSWEP) is a sub-daily precipitation dataset with full global coverage at 0.1° resolution, spanning the period 1979 to present. It is updated in near real-time with a latency of three hours, making it suitable for operational applications and for taking a quick look at recent anomalous precipitation events and placing…
Experts contributing reviews
- Beck, Hylke
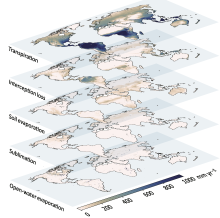 Global Land Evaporation Amsterdam Model (GLEAM)
Years of record
- to
The Global Land Evaporation Amsterdam Model (GLEAM) is a satellite remote sensing-based set of algorithms dedicated to the estimation of evaporation and soil moisture at global scales (Miralles et al. 2011). The current version of GLEAM (version 3) operates at a daily time step with a spatial resolution of 0.25 degrees (Martens et al. 2017). The dataset consists of two…
Main variables and Earth System components
Biosphere land evaporation Land evapotranspiration Soil Moisture-
Formats
- N/A
-
Timestep
- Daily
-
Domain
- Global
-
Collections
- N/A
Experts contributing reviews
- Miralles, Diego, Koppa, Akash
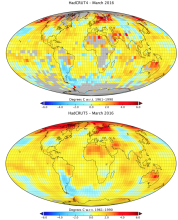 Global land-ocean surface temperature data: HadCRUT5
Years of record
- to
HadCRUT5 is one of the main datasets used to monitor global and regional surface temperature variability and trends. It is a global surface temperature product that combines land surface air temperatures from CRUTEM5 with SSTs from HadSST4. HadCRUT5 is a departure from its predecessors (HadCRUT4, HadCRUT3, etc.) in that two different versions are offered. Both versions…
Main variables and Earth System components
Atmosphere Air Temperature at 2m Ocean SST - sea surface temperature-
Formats
- netCDF
-
Timestep
- Monthly
-
Domain
- Global
-
Collections
- Diagnostic Data Sets
Experts contributing reviews
- Hausfather, Zeke
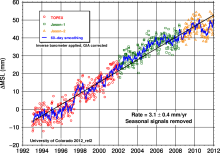 Global Mean Sea Level from TOPEX & Jason Altimetry
Years of record
- to
The global mean sea level timeseries is an excellent, integrative indicator of long-term global temperature trends, providing a record that is observed and processed independent of common metrics like global surface air temperature. The major contributions to the observed sea level trend of 3.3 mm/year include the ocean's thermal expansion, meltwater from mountain…
Experts contributing reviews
- Nerem, R.S.
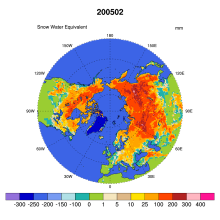 Global Monthly EASE-Grid Snow Water Equivalent Climatology: SSMR, SSMI
Years of record
- to
This data set comprises global, monthly satellite-derived snow water equivalent (SWE) climatologies from November 1978 through May 2007, and is updated with more recent data periodically. Global data are gridded to the Northern and Southern 25 km Equal-Area Scalable Earth Grids (EASE-Grids). Global snow water equivalent is derived from Scanning Multichannel Microwave…
-
Formats
- binary
-
Timestep
- Monthly
-
Collections
- N/A
Experts contributing reviews
- N/A
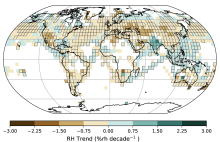 Global near-surface humidity data: HadISDH
Years of record
- to
HadISDH (Met Office Hadley Centre International Surface Dataset of Humidity) is a gridded 5°x5° monthly mean product beginning in January 1973, and updated annually. It provides monthly gridded specific humidity (q), relative humidity (RH), vapor pressure (e), dew point temperature (Td), wet-bulb temperature (Tw), dew point depression (DPD), equivalent temperature (Te…
Main variables and Earth System components
Atmosphere Air Temperature at 2m Relative Humidity Specific HumidityExperts contributing reviews
- Willett, Kate
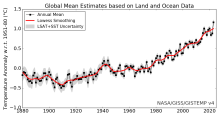 Global surface temperature data: GISTEMP: NASA Goddard Institute for Space Studies (GISS) Surface Temperature Analysis
Years of record
- to
NASA Goddard's Global Surface Temperature Analysis (GISTEMP) combines land surface air temperatures from GHCN-M version 4 with SSTs of the ERSSTv5 analysis into a comprehensive, global surface temperature data set spanning 1880 to the present at monthly resolution, on a 2x2 degree latitude-longitude grid. As such, it is one of the main data sets used to monitor global…
Main variables and Earth System components
Atmosphere Air Temperature Ocean SST - sea surface temperature-
Timestep
- Monthly
-
Domain
- Global
Experts contributing reviews
- Lenssen, Nathan
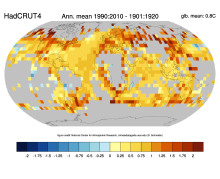 Global surface temperature data: HadCRUT4 and CRUTEM4
Years of record
- to
Extending back to 1850 and frequently updated, HadCRUT4 is the longest data set of its type. HadCRUT4 is a combination of the global land surface temperature data set, CRUTEM4 and the global SST data set, HadSST3. HadCRUT4 is different from the most closely comparable products (e.g. NASA GISTEMP and NOAA MLOST) in that no interpolation is performed. As such, there are…
Main variables and Earth System components
Atmosphere Air Temperature Ocean SST - sea surface temperature-
Timestep
- Climatology, Monthly
-
Domain
- Global
Experts contributing reviews
- N/A
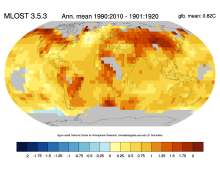 Global surface temperature data: MLOST: NOAA Merged Land-Ocean Surface Temperature Analysis
Years of record
- to
NOAA's Merged Land-Ocean Surface Temperature Analysis (MLOST) combines land surface air temperatures primarily from the Global Historical Climatology Network, Monthly (GHCN-M) version 3 with SSTs of the ERSSTv3b analysis into a comprehensive global surface temperature data set spanning 1880 to the present at monthly resolution, on a 5x5 degree latitude-longitude grid.…
Main variables and Earth System components
Atmosphere Air Temperature Ocean SST - sea surface temperature-
Timestep
- Monthly
-
Domain
- Global
Experts contributing reviews
- N/A
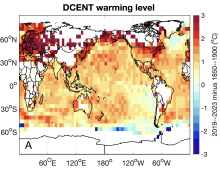 Global surface temperature data: The Dynamically Consistent ENsemble of Temperature (DCENT)
Years of record
- to
The Dynamically Consistent ENsemble of Temperature (DCENT) provides monthly, global, gridded, surface temperature anomalies since 1850. This product provides combined land surface air temperature (LSAT) and sea surface temperature (SST) anomalies at monthly 5° x 5° resolution. An important feature of DCENT is that both land and ocean measurements are used when bias-…
Main variables and Earth System components
Atmosphere Air Temperature at 2m Ocean SST - sea surface temperatureExperts contributing reviews
- Chan, Duo
 Global surface temperature: Maximum Likelihood Estimates of Temperatures using HadCRUT5 (Version 1.2)
Years of record
- to
The Maximum Likelihood Estimates of Temperatures using HadCRUT5 Version 1.2 (HadCRU_MLE_v1.2) dataset provides global complete surface temperature estimates since 1850, with monthly 5°x5° resolution. It uses more sophisticated statistical models to fill data gaps in the non-infilled version of HadCRUT5. The statistical models used in HadCRU_MLE_v1.2 better…
Main variables and Earth System components
Atmosphere Air Temperature at 2m Ocean SST - sea surface temperatureExperts contributing reviews
- Chan, Duo
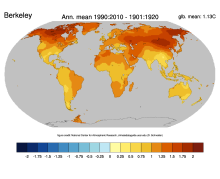 Global surface temperatures: BEST: Berkeley Earth Surface Temperatures
Years of record
- to
The Berkeley Earth Surface Temperatures (BEST) are a set of data products, originally a gridded reconstruction of land surface air temperature records spanning 1701-present, and now including an 1850-present merged land-ocean data set that combines the land analysis with an interpolated version of HadSST3. The land station data are available in an archive, and…
Main variables and Earth System components
Atmosphere Air Temperature Maximum Air Temperature Minimum Air Temperature Ocean SST - sea surface temperatureExperts contributing reviews
- Cowtan, Kevin
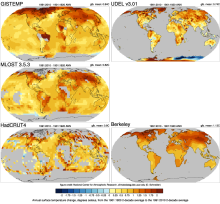 Global Temperature Data Sets: Overview & Comparison Table
Years of record
- to
Global surface temperature data sets are an essential resource for monitoring and understanding climate variability and long-term trends. The most commonly used data sets combine historical observations of near surface air temperatures at land stations with global data sets of sea surface temperatures (SST) obtained from a changing mix of ship-based and buoy…
Main variables and Earth System components
Atmosphere Air Temperature Air Temperature at 2m Ocean SST - sea surface temperature-
Timestep
- Climatology, Monthly
-
Domain
- Global
-
Collections
- Overview / Comparison page
Experts contributing reviews
- N/A
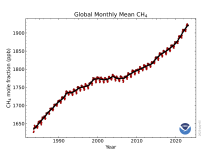 Global-mean methane at the Earth's surface from NOAA’s global cooperative greenhouse gas measurements
Years of record
- to
NOAA’s Global Monitory Laboratory has measured atmospheric methane levels since 1983 at a global cooperative greenhouse gases sampling network, which currently includes more than 50 sites. This measurement network is unique among greenhouse gases monitoring programs with its global coverage and long-term records. It aims to track the atmospheric abundances of long-lived…
Experts contributing reviews
- Lan, Xin
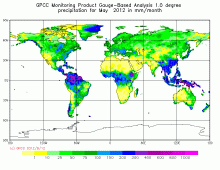 GPCC: Global Precipitation Climatology Centre
Years of record
- to
The GPCC provides gridded gauge-analysis products derived from quality controlled station data. Two products are for climate: (a) the Full Data Reanalysis Product (1901-2010) is recommended for global and regional water balance studies, calibration/validation of remote sensing based rainfall estimations and verification of numerical models, and (b) the VASClimO 50…
-
Timestep
- Climatology, Daily, Monthly
-
Domain
- Global
Experts contributing reviews
- N/A
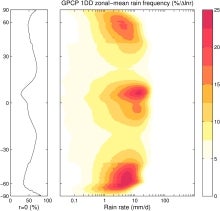 GPCP (Daily): Global Precipitation Climatology Project
Years of record
- to
The 1DD product provides precipitation estimates on a 1-degree grid over the entire globe at 1-day (daily) for the period October 1996 - present. Both the Pentad and 1DD products are consistent with the Version 2 monthly product in the sense that the Pentad and 1DD approximately sum to the monthly SG estimate. All three precipitation products are produced by optimally…
Experts contributing reviews
- Pendergrass, Angeline
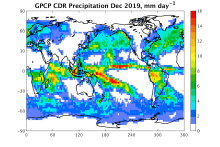 GPCP (Monthly): Global Precipitation Climatology Project
Years of record
- to
Data from rain gauge stations, satellites, and sounding observations have been merged to estimate monthly rainfall on a 2.5-degree global grid from 1979 to the present. The careful combination of satellite-based rainfall estimates provides the most complete analysis of rainfall available to date over the global oceans, and adds necessary spatial detail to the rainfall…
-
Timestep
- Climatology, Monthly
-
Domain
- Global
Experts contributing reviews
- Pendergrass, Angeline, Wang, Jian-Jian
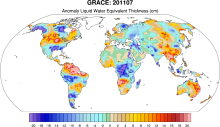 GRACE: Gravity Recovery and Climate Experiment: Surface mass, total water storage, and derived variables
Years of record
- to
The Gravity Recovery and Climate Experiment (GRACE) refers to a pair of NASA satellites that has flown in low-Earth orbit since 2002. The satellites use a precise microwave ranging system to measure the distance between themselves due to gravitational acceleration. Onboard GPS instruments determine the exact position of the satellites over the Earth. GRACE measures…
Main variables and Earth System components
Cryosphere Glaciers Ice Sheet Mass Land Groundwater surface water Water Storage Ocean Bottom pressure-
Timestep
- Daily, Monthly
-
Domain
- Global
-
Collections
- Diagnostic Data Sets, NCAR-DOE-CESM, landdiagnostics, landicediagnostics
Experts contributing reviews
- Swenson, Sean
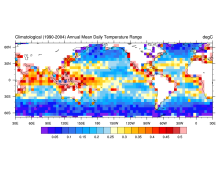 HadDTR: Hadley Centre sea-surface temperature diurnal temperature range climatology
Years of record
- N/A
The Hadley Centre sea-surface temperature diurnal temperature range climatology is a 5x5 degree gridded climatology of the diurnal range of sea surface temperature as measured by drifting buoys.
Experts contributing reviews
- N/A
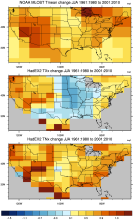 HadEX2: Gridded Temperature and Precipitation Climate Extremes Indices (CLIMDEX data)
Years of record
- to
Note: HadEX2 has been superseded by HadEX3. HadEX2 provides gridded, station-based indices of temperature- and precipitation- related climate extremes. It is intended for detection and attribution studies and climate model evaluation. Twenty-nine indices, including daily maximum and minimum temperatures, number of frost days, maximum 1-day precipitation, and growing…
Main variables and Earth System components
Atmosphere Maximum Air Temperature Minimum Air Temperature Land Freeze/ThawExperts contributing reviews
- N/A
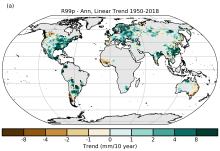 HadEX3: Gridded Temperature and Precipitation Climate Extremes Indices (CLIMDEX data)
Years of record
- to
HadEX3 provides gridded, station-based indices of temperature- and precipitation- related climate extremes and supersedes HadEX2. It is intended for global and continental climate monitoring, detection and attribution studies and climate model evaluation. Twenty-nine indices, including daily maximum and minimum temperatures, number of frost days, maximum 1-day…
Main variables and Earth System components
Atmosphere Air Temperature at 2m Maximum Air Temperature Minimum Air Temperature Land Freeze/ThawExperts contributing reviews
- Dunn, Robert
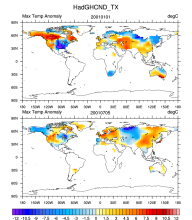 HadGHCNDEX - Gridded Daily Temperature Extremes
Years of record
- to
HadGHCND (aka HadGHCNDEX) is a gridded daily dataset of near-surface maximum (TX) and minimum (TN) temperature observations. Anomalies (departures from 1961-1990 climatology) and actual temperatures are distributed in two separate files. The dataset is designed primarily for the analysis of climate extremes and also for climate model evaluation. It spans the years 1950…
Main variables and Earth System components
Atmosphere Maximum Air Temperature Minimum Air TemperatureExperts contributing reviews
- N/A
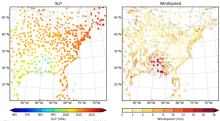 HadISD: Sub-daily, non-interpolated weather station data
Years of record
- to
HadISD ("Hadley Centre Integrated Surface Database") is a compendium of subdaily weather-station data developed by the UK Met Office that is based on NOAA NCEI's Integrated Surface Database but with various quality-control checks implemented to remove stations with excessive and obvious typographical or instrumental errors, as well as individual occurrences of these…
Main variables and Earth System components
Atmosphere Air Temperature at 2m Dew Point Temperature Precipitation Sea Level Pressure Storm data WindExperts contributing reviews
- Raymond, Colin
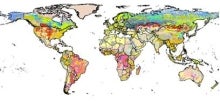 Harmonized Soil Carbon Database
Years of record
- N/A
"This state-of-the-art database was established by IIASA and FAO in partnership with: ISRIC-World Soil Information which, together with the FAO, contributed recent regional soil and terrain databases together with the WISE soil profile database; The European Soil Bureau Network, which provided its major new update of soil information for Europe and northern Eurasia;…
-
Formats
- netCDF, ARC/INFO ASCII GRID
-
Timestep
- N/A
-
Domain
- Global
-
Collections
- Carbon cycle
Experts contributing reviews
- N/A
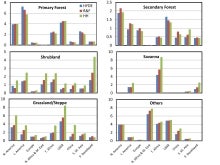 Historical land-cover changes and land-use conversions global data set by Meiyappan and Jain
Years of record
- to
A set of three estimates of land-cover types and annual transformations of land use are provided on a global 0.5°x0.5° grid at annual timesteps. The longest of the three estimates spans 1770-2010. The three estimates use three different data sets of cropland and pastureland. Common input data sets are of wood harvest and urban land. The three estimates use a consistent…
Main variables and Earth System components
Land Land Cover Type Land Use Conversion Vegetation CoverExperts contributing reviews
- Meiyappan, Prasanth
 HOAPS: Hamburg Ocean Atmosphere Parameters and Fluxes from Satellite Data
Years of record
- to
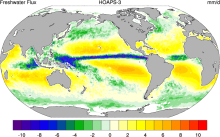
The Hamburg Ocean Atmosphere Parameters and Fluxes from Satellite Data (HOAPS) set is a satellite-based climatology of precipitation, evaporation and freshwater budget (evaporation minus precipitation) as well as related turbulent heat fluxes and atmospheric state variables over the global ice free oceans. All variables are derived from SSM/I passive microwave…
Main variables and Earth System components
Atmosphere Evaporation Evaporation-Precipitation Precipitation Radiation Specific Humidity Wind Latent & sensible heat flux Precipitable water Ocean SST - sea surface temperature-
Formats
- netCDF
-
Timestep
- Climatology, Sub-daily, Monthly, Pentad
-
Domain
- Global
-
Collections
- Boundary Conditions
Experts contributing reviews
- N/A
 Hurrell North Atlantic Oscillation (NAO) Index (PC-based)
Years of record
- to
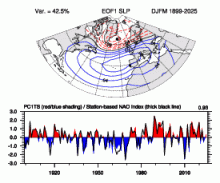
The principal component (PC)-based indices of the North Atlantic Oscillation (NAO) are the time series of the leading Empirical Orthogonal Function (EOF) of SLP anomalies over the Atlantic sector, 20°-80°N, 90°W-40°E. These indices are used to measure the NAO throughout the year, tracking the seasonal movements of the Icelandic low and Azores high. These movements…
-
Formats
- ascii
-
Timestep
- Monthly, Seasonal, Annual
-
Domain
- Atlantic Ocean
-
Collections
- Climate Analysis Section (CAS) Data Catalog
Experts contributing reviews
- Hurrell, James, Phillips, Adam
 Hurrell North Atlantic Oscillation (NAO) Index (station-based)
Years of record
- to
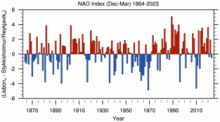
The winter (December thru March) station-based index of the NAO is based on the difference of normalized sea level pressure (SLP) between Lisbon, Portugal and Stykkisholmur/Reykjavik, Iceland since 1864. Positive values of the NAO index are typically associated with stronger-than-average westerlies over the middle latitudes, more intense weather systems over…
-
Formats
- ascii
-
Timestep
- Monthly, Seasonal, Annual
-
Domain
- Atlantic Ocean
-
Collections
- Climate Analysis Section (CAS) Data Catalog
Experts contributing reviews
- Hurrell, James, Phillips, Adam
 IBTrACS: Tropical cyclone best track data
Years of record
- N/A
IBTrACS (International Best Track Archive for Climate Stewardship) provides global tropical cyclone best track data in a centralized location to aid our understanding of the distribution, frequency, and intensity of tropical cyclones worldwide. The World Meteorological Organization Tropical Cyclone Programme has endorsed IBTrACS as an official archiving and distribution…
Experts contributing reviews
- Schreck, Carl
 Japanese Ocean Flux Data sets with Use of Remote Sensing Observations (J-OFURO2)
Years of record
- to
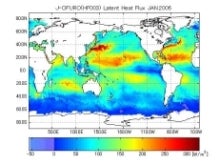
These ocean surface flux data sets are derived primarily using data from multiple satellites. The COARE 3.0 bulk algorithm [Fairall et al. (2003)] is used in J-OFURO2 for the estimation of sensible and latent heat fluxes.
Main variables and Earth System components
Atmosphere Specific Humidity Wind Stress Latent & sensible heat flux Ocean Surface FluxExperts contributing reviews
- N/A
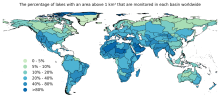 Lake Water Storage: GloLakes
Years of record
- to
Lakes and reservoirs are critical components of the hydrological cycle, particularly due to their central role in many human systems. Long-term measurements of lakes is critical for understanding the dynamics linking lake volume to the climate system and human activities. The GloLakes dataset utilities remote sensing data to provide near real-time monitoring of the…
-
Formats
- N/A
-
Timestep
- Monthly
-
Domain
- Global
-
Collections
- BAMS State of the Climate
Experts contributing reviews
- N/A
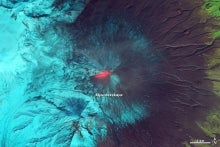 LANDSAT
Years of record
- to
"The Landsat Program provides the longest continuous space-based record of Earth’s land in existence. Since 1972, Landsat satellites have collected measurements of Earth’s continents and surrounding coastal regions that have enabled people to study forests, food production, water and land use, ecosystems, geology, and more. The long data record allows scientists to…
Main variables and Earth System components
Biosphere NPP: Net Primary Production Land Land Cover Type Vegetation Cover-
Formats
- N/A
-
Timestep
- Sub-daily
-
Domain
- Global
-
Collections
- Carbon cycle
Experts contributing reviews
- N/A
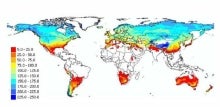 Landscape surface freeze/thaw status based on passive microwave remote sensing
Years of record
- to
A global data set of the frozen state of the land surface (free-thaw (FT) status) has been developed spanning 1979-present at a daily timestep and 25 x 25 km spatial resolution. Based on passive microwave remote sensing, the FT parameter is closely related to the surface energy budget, hydrologic cycle, trace gas exchanges, vegetation growth, and terrestrial carbon…
-
Timestep
- Daily
-
Domain
- Global
-
Collections
- Climate Data Record
Experts contributing reviews
- Kimball, John
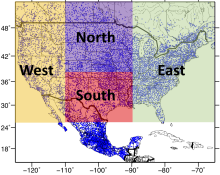 Livneh gridded precipitation and other meteorological variables for continental US, Mexico and southern Canada
Years of record
- to
The Livneh et al. (2015) hydrometeorological dataset consists of gridded daily and monthly precipitation, maximum and minimum air temperature, and wind speed for the continental US, southern Canada, and Mexico for the period 1950-2013. Gridded at 1/16° horizontal resolution (~ 6km), the data have been used as training data for GCM downscaling, as validation for…
Main variables and Earth System components
Atmosphere Maximum Air Temperature Minimum Air Temperature Precipitation Wind-
Formats
- netCDF
-
Timestep
- Daily, Monthly
-
Domain
- North America
-
Collections
- N/A
Experts contributing reviews
- Livneh, Ben
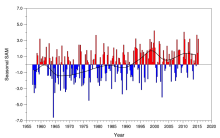 Marshall Southern Annular Mode (SAM) Index (Station-based)
Years of record
- to
The station-based index of the Southern Annular Mode (SAM) is based on the zonal pressure difference between the latitudes of 40S and 65S. As such, the SAM index measures a "see-saw" of atmospheric mass between the middle and high latitudes of the Southern Hemisphere. Positive values of the SAM index correspond with stronger-than-average westerlies over the…
-
Formats
- ascii
-
Timestep
- N/A
-
Collections
- N/A
Experts contributing reviews
- Marshall, Gareth
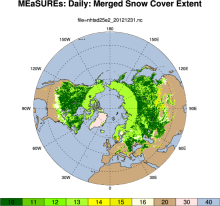 MEaSUREs Northern Hemisphere Terrestrial Snow Cover Extent Daily 25km EASE-Grid 2.0
Years of record
- to
"This data set offers users 25 km Northern Hemisphere snow cover extent represented by four different variables. Three of the snow cover variables are derived from the Interactive Multisensor Snow and Ice Mapping System, MODIS Cloud Gap Filled Snow Cover, and passive microwave brightness temperatures, respectively. The fourth variable merges the three source products…
-
Formats
- netCDF
-
Timestep
- Daily
-
Domain
- NH - Northern Hemisphere
-
Collections
- N/A
Experts contributing reviews
- N/A
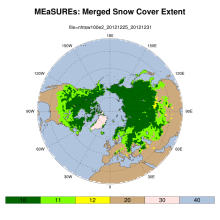 MEaSUREs: Northern Hemisphere Terrestrial Snow Cover Extent Weekly 100km EASE-Grid 2.0
Years of record
- to
"This data set offers users weekly 100 km Northern Hemisphere snow cover extent represented by three different variables. Two of the variables are derived from individual source products: the NOAA/NCDC Northern Hemisphere Snow Cover Extent Climate Data Record and Defense Meteorological Satellite Program (DMSP) passive microwave brightness temperatures, respectively. The…
-
Formats
- netCDF
-
Timestep
- Weekly
-
Domain
- NH - Northern Hemisphere
-
Collections
- Climate Data Record
Experts contributing reviews
- N/A
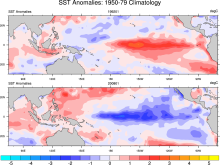 Merged Hadley-NOAA/OI Sea Surface Temperature & Sea-Ice Concentration (Hurrell et al, 2008)
Years of record
- to
The merged Hadley-OI sea surface temperature (SST) and sea ice concentration (SIC) data sets were specifically developed as surface forcing data sets for AMIP style uncoupled simulations of the Community Atmosphere Model (CAM). The Hadley Centre's SST/SIC version 1.1 (HADISST1), which is derived gridded, bias-adjusted in situ observations, were merged with the NOAA-…
Main variables and Earth System components
Cryosphere Sea Ice Concentration Ocean SST - sea surface temperature-
Formats
- netCDF
-
Timestep
- Monthly
Experts contributing reviews
- N/A
 Meridional Modes and their indices
Years of record
- N/A
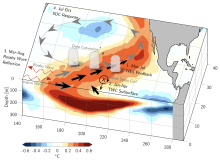
In each of the world’s tropical ocean basins, year-to-year climate variability is primarily governed by fluctuations in the zonal sea surface temperature (SST) gradient and zonal surface winds. These variations consist of recognizable climate modes, such as the El Niño-Southern Oscillation (ENSO) in the tropical Pacific and Atlantic Niño in the tropical Atlantic. While…
-
Formats
- N/A
-
Timestep
- N/A
-
Domain
- Atlantic Ocean, Pacific Ocean
-
Collections
- N/A
Experts contributing reviews
- Amaya, Dillon
 MODIS GPP/NPP Project (MOD17)
Years of record
- to
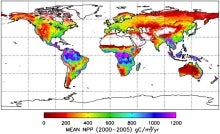
The goal of the MOD17 MODIS project is to provide continuous estimates of Gross/Net Primary Production (GPP/NPP) across Earth’s entire vegetated land surface. MOD17 GPP/NPP outputs are useful for natural resource and land management, global carbon cycle analysis, ecosystem status assessment, and environmental change monitoring. MOD17 is part of the NASA Earth…
Experts contributing reviews
- N/A
 Multivariate ENSO Index
Years of record
- to
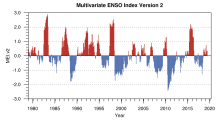
The Multivariate ENSO Index (MEI) is said to capture a more holistic representation of the atmospheric and oceanic anomalies that occur during ENSO events than do single-variables timeseries like the NinoSST indices. The MEIv2 is based on five variables from the tropical Pacific. These five variables are: sea-level pressure (P), zonal (U) and meridional (V) components…
Main variables and Earth System components
N/A-
Formats
- ascii
-
Timestep
- Monthly
-
Domain
- Pacific Ocean
-
Collections
- Climate Analysis Section (CAS) Data Catalog
Experts contributing reviews
- N/A
 NDVI and EVI: Vegetation Indices (MODIS)
Years of record
- to
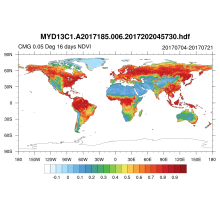
MODIS vegetation indices, produced on 16-day and monthly intervals and at multiple spatial resolutions, provide consistent spatial and temporal comparisons of vegetation canopy greenness, a composite property of leaf area, chlorophyll and canopy structure. Two vegetation indices are derived from atmospherically-corrected reflectance in the red, near-infrared, and blue…
Main variables and Earth System components
Land Enhanced Vegetation Index (EVI) NDVI" Normalized Difference Vegetation IndexExperts contributing reviews
- N/A
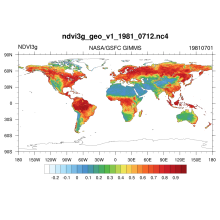 NDVI: Normalized Difference Vegetation Index-3rd generation: NASA/GFSC GIMMS
Years of record
- to
Normalized Difference Vegetation Index-3rd generation (NDVI) using the Global Inventory Monitoring and Modeling System (GIMMS): Vegetation indices are radiometric measures of photosynthetically active radiation absorbed by chlorophyll in the green leaves of vegetation canopies and are therefore good surrogate measures of the physiologically functioning surface…
Main variables and Earth System components
N/A-
Formats
- netCDF
-
Timestep
- Daily
-
Domain
- Global
-
Collections
- Climate Data Record
Experts contributing reviews
- N/A
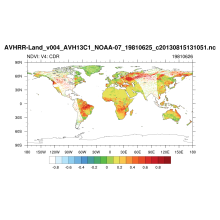 NDVI: Normalized-difference-vegetation-index: NOAA AVHRR
Years of record
- to
Normalized Difference Vegetation Index (NDVI) values are derived from surface reflectance data acquired by the Advanced Very High Resolution Radiometer (AVHRR) sensor. By applying knowledge gathered over time about instrument performance and sensor characteristics, the data are reprocessed to create consistent long-term records, allowing insight into changes in the…
Experts contributing reviews
- N/A
- Night Marine Air Temperature (NMAT) Datasets: CLASSnmat and UAHNMATv1
Years of record
- to
Night Marine Air Temperature (NMAT) refers to measurements of air temperature recorded with thermometers on the weather stations of ships. NMAT is a highly correlated variable with Sea Surface Temperature (SST), capturing the temperature of the atmosphere near the surface. The earliest known record of NMAT begins in 1699 with records expanding globally by the mid-1800s…
-
Formats
- netCDF
-
Timestep
- Monthly
-
Domain
- Global
-
Collections
- BAMS State of the Climate
Experts contributing reviews
- Cornes, Richard
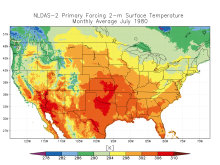 NLDAS: North American Land Data Assimilation System
Years of record
- to
The North American Land Data Assimilation System (NLDAS) integrates a large quantity of observation-based and model reanalysis data to produce long-term hourly atmospheric forcing data, and then uses this meteorological data to drive offline (not coupled to the atmosphere) land-surface and/or hydrological models. The spatial resolution of NLDAS is at 1/8th-degree…
Main variables and Earth System components
Atmosphere Air Temperature CAPE Evaporation Precipitation Radiation Specific Humidity Surface Pressure Wind-
Timestep
- Climatology, Sub-daily, Monthly
-
Domain
- North America
-
Collections
- N/A
Experts contributing reviews
- Xia, Youlong, Mocko, David
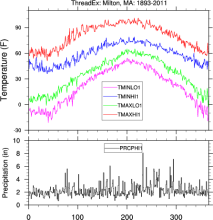 NOAA ThreadEx Long-term Station Extremes for America
Years of record
- to
ThreadEx is a data set of extreme daily temperature and precipitation values for 270 locations in the United States. For each day of the year at each station, ThreadEx provides the top 3 record high and low daily maximum temperatures, the top 3 record high and low daily minimum temperatures, the top 3 daily precipitation totals, along with the years the records were set…
Main variables and Earth System components
Atmosphere Air Temperature Maximum Air Temperature Minimum Air Temperature Precipitation-
Formats
- ascii
-
Timestep
- Daily
-
Domain
- North America
-
Collections
- N/A
Experts contributing reviews
- N/A
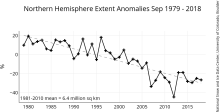 NSIDC Sea Ice Index
Years of record
- to
The NSIDC Sea Ice Index is a suite of easy-to-use sea ice analyses to track changes in Arctic and Antarctic sea ice. The product is produced and supported by the NOAA at NSIDC group and consists of browse imagery and data text files (CSV or Excel format). The input data is from two sources distributed by the NASA NSIDC Distributed Active Archive Center (DAAC): (1) Sea…
Experts contributing reviews
- Meier, Walter
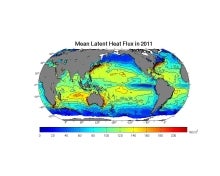 OAFlux: Objectively Analyzed air-sea Fluxes for the global oceans.
Years of record
- to
"The OAFlux project aims to provide consistent, multi-decade, global analysis of air-sea heat, freshwater (evaporation), and momentum fluxes for use in studies of global energy budget, water cycle, atmosphere and ocean circulation, and climate. The OAFlux project is so called because it applies objective analysis approach to take into account data errors in the…
Main variables and Earth System components
Atmosphere Latent & sensible heat flux Radiation Wind Ocean SST - sea surface temperature Surface Flux wind stress curlExperts contributing reviews
- N/A
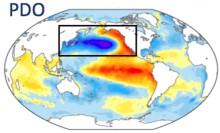 Pacific Decadal Oscillation (PDO): Definition and Indices
Years of record
- to
The Pacific Decadal Oscillation (PDO) is defined by the leading pattern (EOF) of sea surface temperature (SST) anomalies in the North Pacific basin (typically, polewards of 20°N). The SST anomalies are obtained by removing both the climatological annual cycle and the global-mean SST anomaly from the data at each gridpoint. Positive values of the PDO index…
-
Formats
- ascii
-
Timestep
- Monthly
-
Domain
- Pacific Ocean
-
Collections
- N/A
Experts contributing reviews
- Deser, Clara, Trenberth, Kevin
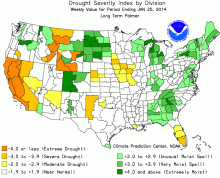 Palmer Drought Severity Index (PDSI)
Years of record
- N/A
The Palmer Drought Severity Index (PDSI) uses readily available temperature and precipitation data to estimate relative dryness. It is a standardized index that generally spans -10 (dry) to +10 (wet). Maps of operational agencies like NOAA typically show a range of -4 to +4, but more extreme values are possible. The PDSI has been reasonably successful at quantifying…
-
Timestep
- Monthly
-
Domain
- Global
-
Collections
- Climate Analysis Section (CAS) Data Catalog
Experts contributing reviews
- Dai, Aiguo, Bui, Sang, Lenssen, Nathan
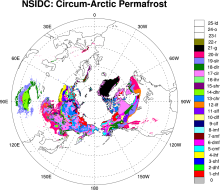 Permafrost: Circum-Arctic Map of Permafrost and Ground Ice Conditions
Years of record
- N/A
The circumpolar permafrost and ground ice data contribute to a unified international data set that depicts the distribution and properties of permafrost and ground ice in the Northern Hemisphere (20°N to 90°N). The re-gridded data set shows discontinuous, sporadic, or isolated permafrost boundaries.
-
Timestep
- Climatology
-
Domain
- NH - Northern Hemisphere
-
Collections
- N/A
Experts contributing reviews
- N/A
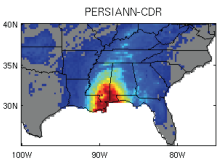 PERSIANN-CDR: Precipitation Estimation from Remotely Sensed Information using Artificial Neural Networks - Climate Data Record
Years of record
- to
The Precipitation Estimation from Remotely Sensed Information using Artificial Neural Networks- Climate Data Record (PERSIANN-CDR) provides daily rainfall estimates at a spatial resolution of 0.25 degrees in the latitude band 60S - 60N from 1983 to the near-present. The precipitation estimate is produced using the PERSIANN algorithm on GridSat-B1 infrared…
-
Timestep
- Sub-daily, Daily
-
Domain
- Global
-
Collections
- Climate Data Record
Experts contributing reviews
- Ashouri, Hamed, Gehne, Maria
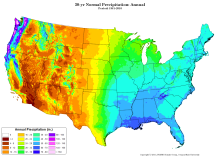 PRISM High-Resolution Spatial Climate Data for the United States: Max/min temp, dewpoint, precipitation
Years of record
- to
PRISM is a set of monthly, yearly, and single-event gridded data products of mean temperature and precipitation, max/min temperatures, and dewpoints, primarily for the United States. In-situ point measurements are ingested into the PRISM (Parameter elevation Regression on Independent Slopes Model) statistical mapping system. The PRISM products use a weighted regression…
Main variables and Earth System components
Atmosphere Dew Point Temperature Maximum Air Temperature Minimum Air Temperature Precipitation-
Formats
- ARC/INFO ASCII GRID, netCDF
-
Timestep
- Climatology, Daily, Monthly
-
Domain
- North America
-
Collections
- N/A
Experts contributing reviews
- Daly, Christopher
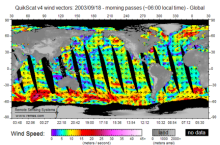 QuikSCAT: near sea-surface wind speed and direction
Years of record
- to
The QuikSCAT mission was intended to obtain sea-surface wind speed and direction data under all weather and cloud conditions over Earth's oceans. SeaWinds, an active radar scatterometer, is the main instrument on the QuikSCAT satellite. The microwave backscatter measured by SeaWinds is dependent on the surface roughness of the ocean, which in turn is related to wind…
Experts contributing reviews
- Ricciardulli, Lucrezia
 Radiative kernels from climate models
Years of record
- N/A
The radiative kernel technique is a method used to quantify radiative feedbacks in response to global warming. Radiative kernels are commonly calculated for the water vapor, lapse rate, temperature and albedo feedbacks. Radiative kernels are used to deconstruct the various contributions of feedbacks and forcings to the total change in top-of-atmosphere (TOA…
Main variables and Earth System components
N/AExperts contributing reviews
- Pendergrass, Angeline
 Randolph Glacier Inventory data base of global glacier outlines
Years of record
- N/A
The Randolph Glacier Inventory (RGI) is a global data base of glacier outlines. It is intended for estimates of ice volume and glacier mass at regional and global scales. The data are organized into 19 large regions, with a shapefile provided for each region. The RGI is produced as part of the Global Land Ice Measurements from Space (GLIMS) initiative, a project to…
Experts contributing reviews
- N/A
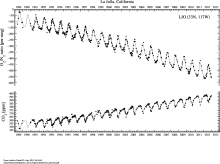 SCRIPPS O2 ,CO2 and APO
Years of record
- to
"The Scripps O2Program measures changes in atmospheric oxygen levels from air samples collected at stations around the world. This sampling network provides a global and hemispheric perspective on oxygen variability. " Stations include: Alert, NWT, Canada Cold Bay, Alaska Cape Kumukahi, Hawaii La Jolla Pier, California Mauna Loa Observatory,Hawaii American Samoa Cape…
-
Formats
- ascii
-
Timestep
- Daily, Monthly
-
Domain
- N/A
-
Collections
- Carbon cycle
Experts contributing reviews
- N/A
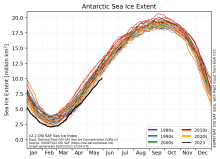 Sea Ice Concentration Climate Data Record from OSI SAF
Years of record
- to
The Ocean and Sea Ice Satellite Applications Facility (OSI SAF) of EUMETSAT provides sea ice concentration products for the Arctic and Antarctic based on satellite passive microwave data. The concentration value is expressed as the fractional percentage of the ice cover in a given grid cell. Since 2023, OSI-450-a and OSI-430-a constitute the third fully…
-
Formats
- netCDF
-
Timestep
- Daily
-
Collections
- N/A
Experts contributing reviews
- Aaboe, Signe, Lavergne, Thomas
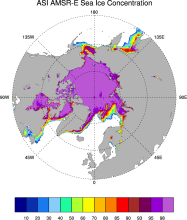 Sea Ice Concentration data from AMSR-E, AMSR2 & SSMIS, U Bremen and U Hamburg ASI algorithm
Years of record
- to
The sea ice data derived from AMSR-E using the ARTIST sea ice (ASI) algorithm offer a factor of 4 finer spatial resolution than most sea ice data sets from passive microwave satellite instruments. ASI is based on the difference of vertically and horizontally polarized brightness temperatures at 89 GHz; this difference is independent of temperature but depends on…
-
Timestep
- Daily
-
Collections
- N/A
Experts contributing reviews
- N/A
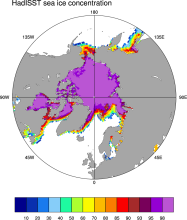 Sea Ice Concentration data from HadISST
Years of record
- to
Spanning 1871-present at monthly timesteps, HadISST provides the longest gridded sea ice data available for both the Arctic and Antarctic. It is a 1° x 1° spatially infilled data set that is It is intended as a consistent analyses for input into SST analyses or as boundary conditions for models. Version 1.1 is the currently available data set and is the one described…
-
Timestep
- Monthly
-
Collections
- Boundary Conditions
Experts contributing reviews
- N/A
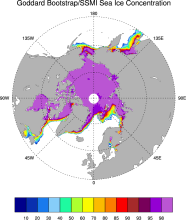 Sea Ice Concentration data from NASA Goddard and NSIDC based on Bootstrap algorithm
Years of record
- to
Bootstrap sea ice refers to a well-known algorithm used to estimate sea ice concentration from passive microwave brightness temperatures. It can be applied to data from many satellite instruments, such as SMMR, SSMI, and AMSR-E. This page discusses the algorithm itself and the long-term data set ("NSIDC 0079, version 2") produced by J. Comiso and distributed by NSIDC.…
-
Timestep
- Daily, Monthly
-
Collections
- N/A
Experts contributing reviews
- N/A
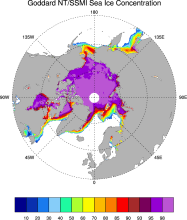 Sea Ice Concentration data from NASA Goddard and NSIDC based on NASA Team algorithm
Years of record
- to
NASA Team sea ice refers to a well-known algorithm used to estimate sea ice concentration from passive microwave brightness temperatures. This page discusses the algorithm itself and the long-term data set ("NSIDC 0051") produced by scientists at NASA Goddard and distributed by NSIDC. The NASA Team data are very widely used and are a key input into other data sets…
-
Timestep
- Daily, Monthly
-
Collections
- Diagnostic Data Sets, NCAR-DOE-CESM, seaicediagnostics
Experts contributing reviews
- N/A
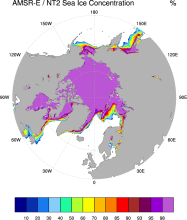 Sea Ice Concentration data from NASA Goddard and NSIDC using AMSR-E and NASA TEAM2 (NT2) algorithm
Years of record
- to
The AMSR-E/NASA Team 2 (NT2) data set of Arctic and Antarctic sea ice concentration is available at daily timesteps and 12.5 km (optionally 25km) spatial resolution for 2002-2011. NT2, an extension of the original NASA Team algorithm, uses AMSR-E 89GHz channels to help resolve ambiguity between low ice concentrations and areas with strong surface effects (due to snow…
Experts contributing reviews
- N/A
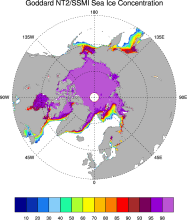 Sea ice concentration data from NASA Goddard based on SSMI and NASA Team (NT2) algorithm
Years of record
- to
The NASA Team 2 (NT2) / SSMI data set of Arctic and Antarctic sea ice concentration is available at daily timesteps and 25km spatial resolution for 1992-2008. NT2, an extension of the original NASA Team algorithm, uses SSMI 85GHz channels to help resolve ambiguity between low ice concentrations and areas with strong surface effects (due to snow layering and glazing).…
Experts contributing reviews
- N/A
 Sea Ice Concentration data from NOAA OI
Years of record
- to
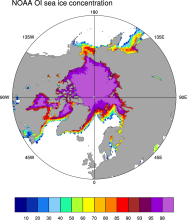
The NOAA Optimal Interpolation (OI) v2 sea ice data set contains gridded, weekly or monthly resolution sea ice concentration estimates for both the Northern and Southern Hemispheres. It is intended as a consistent analyses for input into SST analyses (and is the basis for calculating SSTs in sea ice zones for the OI SST data) or as boundary conditions for atmospheric…
-
Formats
- netCDF
-
Timestep
- Monthly, Weekly
-
Collections
- Boundary Conditions
Experts contributing reviews
- N/A
 Sea Ice Concentration: NOAA/NSIDC Climate Data Record
Years of record
- to
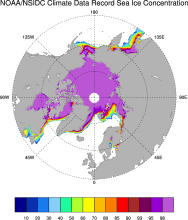
The NOAA/NSIDC Climate Data Record (CDR) of sea ice concentration is available at 25 x 25 km spatial resolution in daily or monthly timesteps for 1987-2014. It provides a consistent interpretation of sea ice for the satellite record, with the intent of being suitable for studies of climate variability and change. The CDR is produced by an automated and independent…
-
Formats
- netCDF
-
Timestep
- Daily, Monthly
-
Collections
- Climate Data Record
Experts contributing reviews
- Meier, Walter
 Sea Ice Thickness Data Sets: Overview & Comparison Table
Years of record
- to
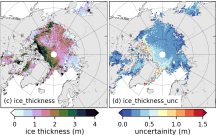
While satellite observations of sea ice extent and concentration are available from 1979, long-term high quality (daily and high spatial resolution) observations of sea ice thickness remain limited as a result of few satellite and in situ observations. Reconstructions using numerous observational sources show a 65% decline in annual mean sea ice thickness in the central…
Experts contributing reviews
- Labe, Zachary, Tilling, Rachel
 Snow Cover Extent (Northern Hemisphere) Climate Data Record, by Rutgers
Years of record
- to
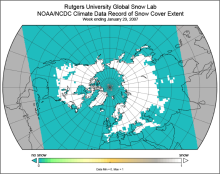
The Snow Cover Extent Climate Data Record extends from the late 1960s to present. Historical analyses based on visual inspection have been digitized and combined with modern multi-spectral remote sensing to produce a seamless record on a hemispheric scale. The data are available at weekly and monthly resolutions in a variety of formats. The spatial resolution varies with…
-
Timestep
- Monthly, Weekly
-
Domain
- North America
-
Collections
- Climate Data Record, Diagnostic Data Sets, NCAR-DOE-CESM, landdiagnostics
Experts contributing reviews
- Estilow, Thomas W., Robinson, David
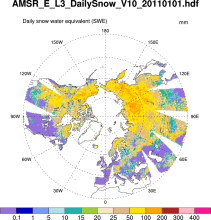 Snow Water Equivalent (AMSR-E)
Years of record
- to
The Advanced Microwave Scanning Radiometer-Earth Observing System (AMSR-E) distributes daily, weekly, and monthly products which includes snow water equivalent. Note: "On 04 October 2011, the AMSR-E instrument on board the Aqua satellite stopped producing data due to a problem with the rotation of its antenna."
-
Formats
- HDF-EOS
-
Timestep
- Daily, Monthly, Weekly
-
Domain
- NH - Northern Hemisphere
-
Collections
- N/A
Experts contributing reviews
- N/A
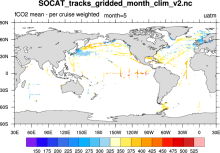 SOCAT: Surface Ocean CO2 Atlas
Years of record
- to
SOCAT (Surface Ocean CO2 Atlas) represents an effort to "provide a comprehensive, publicly available, regularly updated, global data set of marine surface CO2, which had been subject to quality control (QC)." The data sets are comprised of observations (ship track) and gridded data.
-
Formats
- netCDF
-
Timestep
- Climatology, Monthly, Annual
-
Domain
- Global
-
Collections
- Carbon cycle
Experts contributing reviews
- N/A
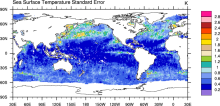 SST (AMSR-E): Sea Surface Temperature from Remote Sensing Systems
Years of record
- to
High resolution (0.25°) SSTs were derived from the AMSR-E, a passive microwave radiometer flying on NASA's AQUA satellite. Remote Sensing Systems distributes the data in high spatial and temporal (daily, weekly, monthly) resolutions for both daytime and nighttime averages. Monthly versions are available on a 1°x1° grid from JPL PO-DAAC as well as the CMIP5 obs4MIPS…
Experts contributing reviews
- N/A
- SST Data Sets: Overview & Comparison Table
Years of record
- to
This overview focuses on SST datasets designed for climate applications. The focus is on datasets with coverage back to around 1850 at monthly resolution but select datasets over the satellite era that have been specifically developed as climate monitoring resources are also included. Note that information on high-resolution (10km daily or higher) operational satellite-…
-
Formats
- N/A
-
Timestep
- Climatology, Daily, Monthly, Weekly
-
Domain
- Global
-
Collections
- Overview / Comparison page
Experts contributing reviews
- Chan, Duo, Kent, Elizabeth
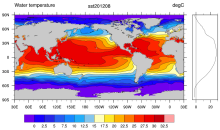 SST data: COBE: Centennial in situ Observation-Based Estimates
Years of record
- to
The COBE data set is a spatially complete, interpolated 1°x1° SST product for 1891 to present. It combines SSTs from ICOADS release 2.0, the Japanese Kobe collection, and reports from ships and buoys. Data are gridded using optimal interpolation. As in HadISST, data up to 1941 were bias-adjusted using the "bucket correction." Prior to the interpolation analyses, data…
Experts contributing reviews
- N/A
 SST Data: COBEv3: Centennial in situ Observation-Based Estimates Version 3
Years of record
- to
The Centennial in situ Observation-Based Estimates of Sea Surface Temperature version 3 (COBE-SST3) is a SST analysis produced by the Japanese Meteorological Agency (JMA). The main COBE-SST3 reconstruction provides spatially complete estimates of SST over the global oceans, seas, and large lakes at daily temporal resolution on a regular 0.25° grid. The product currently…
Experts contributing reviews
- Ishii, Masayoshi
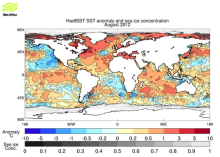 SST data: HadiSST v1.1
Years of record
- to
The Hadley Centre Global Sea Ice and Sea Surface Temperature (HadISST) is a combination of monthly globally complete fields of SST and sea ice concentration for 1871-present. This page focuses on the SST data; see the separate page for discussion of HadISST sea ice. HadISST uses reduced space optimal interpolation applied to SSTs from the Marine Data Bank (mainly ship…
-
Timestep
- Monthly
-
Domain
- Global
Experts contributing reviews
- N/A
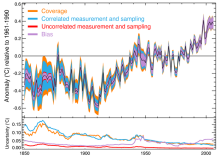 SST data: HadSST3
Years of record
- to
HadSST3 provides monthly SST anomalies on a 5°x5° grid for 1850-present. The anomalies are derived from a 30-year climatology spanning 1961-90.Coverage is global but there is no interpolation; Thus, missing data occur in the final product. The primary input data are from ICOADS release 2.5. Bias adjustments to the ICOADS SSTs account for changes in measurement methods (…
-
Timestep
- Monthly
-
Domain
- Global
Experts contributing reviews
- Kennedy, John
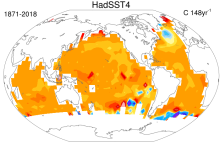 SST data: HadSST4
Years of record
- to
HadSST4 provides monthly SST anomalies on a 5°x5° grid for 1850-present. The anomalies are derived from a 30-year climatology spanning 1961-90. Coverage is global but there is no interpolation; Thus, missing data occur in the final product. This means that uncertainties due to limited spatial coverage and systematic errors are relatively easy to identify compared with…
-
Formats
- netCDF
-
Timestep
- Monthly
-
Domain
- Global
-
Collections
- Diagnostic Data Sets
Experts contributing reviews
- Kennedy, John
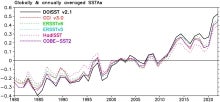 SST data: NOAA daily Optimum Interpolation Sea Surface Temperature version 2.1, OISSTv2.1
Years of record
- to
NOAA’s daily Optimum Interpolation Sea Surface Temperature (dOISST, also known as Reynolds’ SST or OISST) is a global SST analysis product. An SST analysis is a spatially gridded product created by interpolating and extrapolating data, resulting in a smoothed spatially-complete field. dOISST provides global fields that are based on a combination of ocean temperature…
Experts contributing reviews
- Huang, Boyin, Yin, Xungang
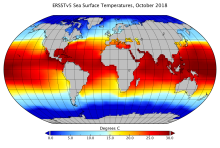 SST Data: NOAA Extended Reconstruction SSTs Version 5 (ERSSTv5)
Years of record
- to
Note: ERSST is currently on version 6. See the ERSSTv6 page here. The NOAA Extended Reconstruction Sea Surface Temperature (ERSST) provides global, spatially complete SST data at a monthly timestep for 1854-present. Version5 is based upon statistical interpolation of the ICOADS release 3.0 data. Argo float data are used in the recent years (since ~2000). The data…
-
Timestep
- Climatology, Monthly
-
Domain
- Global
-
Collections
- Diagnostic Data Sets
Experts contributing reviews
- Hausfather, Zeke
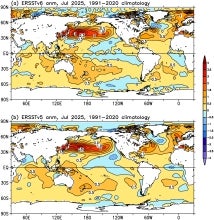 SST Data: NOAA Extended Reconstruction SSTs Version 6 (ERSSTv6)
Years of record
- to
The NOAA Extended Reconstruction Sea Surface Temperature version 6 (ERSSTv6) is a global, spatially complete SST data at monthly 2°×2° resolutions based on in situ observations for 1850-present. Version 6 is based upon statistical interpolation of the ICOADS release 3.0.2 SST data. Argo float data are also used in the recent years (since ~2000). The data are distributed…
Experts contributing reviews
- Huang, Boyin, Yin, Xungang
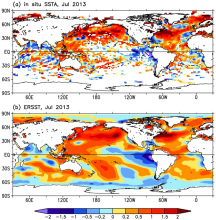 SST data: NOAA Extended Reconstruction SSTs, version 3 (ERSSTv3 & 3b)
Years of record
- to
Note: ERSST is currently on version 6. See the ERSSTv6 page here. The NOAA Extended Reconstruction Sea Surface Temperature (ERSST) provides global, spatially complete SST data at a monthly timestep for 1854-present. Version3 is based upon statistical interpolation of the ICOADS release 2.4 data. Version 3 includes satellite AVHRR SST data for 1985 onwards. Version…
-
Timestep
- Monthly
-
Domain
- Global
Experts contributing reviews
- Huang, Boyin, Livermore, Jay, Smith, Tom
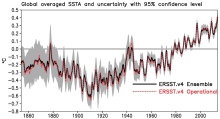 SST data: NOAA Extended Reconstruction SSTs, Version 4
Years of record
- to
Note: ERSST is currently on version 6. See the ERSSTv6 page here. The NOAA Extended Reconstruction Sea Surface Temperature (ERSST) provides global, spatially complete SST data at a monthly timestep for 1854-present. Compared to the previous version, Version 4 uses the more extensive ICOADS Release 2.5 data and revised quality control, bias adjustment, and…
Experts contributing reviews
- Huang, Boyin
 SST data: NOAA High-resolution (0.25x0.25) Blended Analysis of Daily SST and Ice, OISSTv2
Years of record
- to
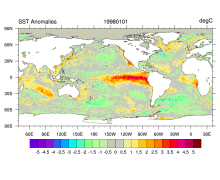
"NOAA’s Optimum Interpolation Sea Surface temperature (OISST, also known as Reynolds’ SST) is a series of global analysis products, including the weekly OISST on a 1° grid to the more recent daily on a ¼° grid. An SST analysis is a spatially gridded product created by interpolating and extrapolating data, resulting in a smoothed complete field. OISST provides global…
Main variables and Earth System components
Cryosphere Sea Ice Concentration Ocean SST - sea surface temperatureExperts contributing reviews
- Banzon, Viva, Reynolds, Richard
 SST data: NOAA Optimal Interpolation (OI) SST Analysis, version 2 (OISSTv2) 1x1
Years of record
- to
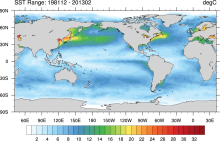
The NOAA Optimal Interpolation SST analysis provides global, spatially complete SSTs on a weekly and monthly basis for 1982-present.
Experts contributing reviews
- Banzon, Viva, Reynolds, Richard
 Standardized Precipitation Evapotranspiration Index (SPEI)
Years of record
- to
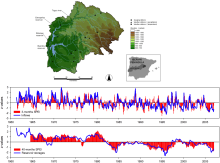
The Standardized Precipitation Evapotranspiration Index (SPEI) is an extension of the widely used Standardized Precipitation Index (SPI). The SPEI is designed to take into account both precipitation and potential evapotranspiration (PET) in determining drought. Thus, unlike the SPI, the SPEI captures the main impact of increased temperatures on water demand. Like the…
Main variables and Earth System components
N/AExperts contributing reviews
- Vicente-Serrano, Sergio M.
 Standardized Precipitation Index (SPI)
Years of record
- to
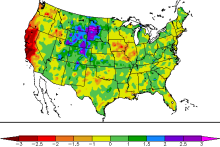
The Standardized Precipitation Index (SPI) is a widely used index to characterize meteorological drought on a range of timescales. On short timescales, the SPI is closely related to soil moisture, while at longer timescales, the SPI can be related to groundwater and reservoir storage. The SPI can be compared across regions with markedly different climates. It quantifies…
-
Formats
- N/A
-
Timestep
- Monthly
-
Domain
- N/A
-
Collections
- N/A
Experts contributing reviews
- Keyantash, John
 Surface Flux and Meteorological Dataset: National Oceanography Centre (NOC) V2.0
Years of record
- to
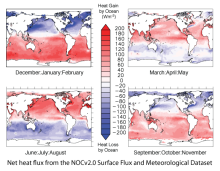
The National Oceanography Centre (NOC) Version 2.0 Surface Flux and Meteorological Dataset is a monthly mean gridded dataset of marine surface measurements and derived fluxes constructed using optimal interpolation. Input for the period 1973 to 2006 are ICOADS Release 2.4 ship data and the update from 2007 to 2014 uses ICOADS Release 2.5. The dataset is presented…
-
Formats
- netCDF
-
Timestep
- Monthly
-
Domain
- Global
-
Collections
- Climate Data Record
Experts contributing reviews
- Kent, Elizabeth
 Surface Solar Radiation Data Set - Heliosat (SARAH) -Edition 1
Years of record
- to
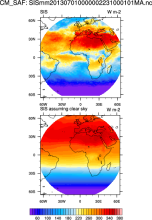
"The Surface Solar Radiation Data Set - Heliosat (SARAH) is a satellite-based climatology of the solar surface irradiance (SIS), the surface direct normalized irradiance (DNI) and the effective cloud albedo (CAL) derived from satellite observations of the visible channels of the MVIRI and SEVIRI instruments onboard the geostationary Meteosat satellites. The data are…
-
Formats
- netCDF
-
Timestep
- Sub-daily, Daily, Monthly
-
Collections
- Climate Data Record
Experts contributing reviews
- N/A
 TerraClimate: Global, high-resolution gridded temperature, precipitation, and other water balance variables
Years of record
- to
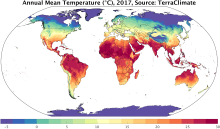
TerraClimate is a global gridded dataset of meteorological and water balance variables for 1958-present, available on a monthly timestep. Its relatively fine spatial resolution, global extent, and long length are a unique combination that fills a void in climate data. TerraClimate combines spatial climatology from WorldClim with time-varying information from the…
Main variables and Earth System components
Atmosphere Air Temperature Maximum Air Temperature Minimum Air Temperature Potential Evapotranspiration Precipitation Wind Snow Water Equivalent Land evapotranspiration Runoff and Streamflow Soil MoistureExperts contributing reviews
- Abatzoglou, John
 Tide gauge sea level data
Years of record
- to
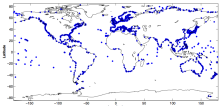
The global sea level record from tide gauges is an important indicator of the evolution and impact of global change. Tide gauge data also capture a variety of local and regional phenomena related to decadal climate variability, tides, storm surges, tsunamis, swells, and other coastal processes. Tide gauge data are used to validate ocean models and to detect…
-
Formats
- N/A
-
Timestep
- Sub-daily, Daily, Monthly, Annual
-
Domain
- Global
-
Collections
- N/A
Experts contributing reviews
- Hamlington, Benjamin, Thompson, Phil
 TRMM: Tropical Rainfall Measuring Mission
Years of record
- to
The Tropical Rainfall Measuring Mission (TRMM) is a joint space mission between NASA and Japan's National Space Development Agency designed to monitor and study tropical and subtropical precipitation and the associated release of energy. The mission uses 5 instruments: Precipitation Radar (PR), TRMM Microwave Imager (TMI), Visible Infrared Scanner (VIRS), Clouds &…
-
Timestep
- Sub-daily, Daily, Monthly
-
Domain
- Tropics
-
Collections
- Climate Analysis Section (CAS) Data Catalog, Obs4MIPS
Experts contributing reviews
- Huffman, George J., Pendergrass, Angeline
 U.S. Climate Extremes Index (CEI)
Years of record
- to
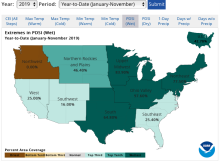
The U.S. Climate Extremes Index (CEI) was first presented in 1995 as a framework for quantifying observed changes in climate within the contiguous United States. At present, the CEI evaluates the percent area of extremes in the distribution of much above/below average (top/bottom 10% of occurrence) temperatures, precipitation, drought, and tropical cyclone wind…
Main variables and Earth System components
Atmosphere Air Temperature Maximum Air Temperature Minimum Air Temperature Precipitation Wind Land Drought-
Formats
- ascii
-
Timestep
- Monthly, Seasonal, Annual
-
Domain
- North America
-
Collections
- N/A
Experts contributing reviews
- Gleason, Karin
 Walsh and Chapman Northern Hemisphere Sea Ice
Years of record
- to
The Walsh and Chapman Sea Ice Data Set provides a long record of Arctic sea ice concentrations on a monthly basis for 1870-2011. Historical observations were gridded and combined with satellite-derived sea ice concentrations for the recent decades. Mostly climatologies before the 1950s. The Walsh and Chapman sea ice data set is the main input data set into the HadiSST…
-
Formats
- ascii
-
Timestep
- Monthly
-
Domain
- NH - Northern Hemisphere, Arctic
-
Collections
- N/A
Experts contributing reviews
- Chapman, William
 WASWind: Wave and Anemometer-based Sea Surface Wind
Years of record
- to
"WASWind (Wave and Anemometer-based Sea Surface Wind) provides a bias-corrected marine surface wind dataset over the global oceans. Variables include scalar, zonal and meridional winds at 10-meter high, and zonal and meridional components of wind stress. WASWind has been constructed from wind observations in ICOADS (International Comprehensive Ocean-Atmosphere Data Set…
Experts contributing reviews
- Tokinaga, Hiroki