Global Ocean Salinity Change, 1950-2008 (Durack-Wijffels)
Using data from the Indian Ocean Hydrobase (IOHB) (Kobayashi et al., 2006), Hydrobase2 (Curry, 2002), and Southern Ocean Atlas (Orsi and Whitworth, 2010) databases along with the improved spatial and temporal coverage provided by ARGO profiling data, new estimates of ocean salinity and temperature change (0-2000m) for the period 1950-2008 are derived. The data have been used to track changes in the hydrological cycle associated with global warming.
Key Strengths
Key Limitations
When using this data, please cite Durack & Wijffels, 2010 and include recognition of the global Argo program in the acknowledgements: "This analysis is based on data made freely available by the International Argo Program and the national programs that contribute to it (http://www.argo.ucsd.edu)."
Cite this page
Acknowledgement of any material taken from or knowledge gained from this page is appreciated:
National Center for Atmospheric Research Staff (Eds). Last modified "The Climate Data Guide: Global Ocean Salinity Change, 1950-2008 (Durack-Wijffels).” Retrieved from https://climatedataguide.ucar.edu/climate-data/global-ocean-salinity-change-1950-2008-durack-wijffels on 2026-07-14.
Citation of datasets is separate and should be done according to the data providers' instructions. If known to us, data citation instructions are given in the Data Access section, above.
Acknowledgement of the Climate Data Guide project is also appreciated:
Schneider, D. P., C. Deser, J. Fasullo, and K. E. Trenberth, 2013: Climate Data Guide Spurs Discovery and Understanding. Eos Trans. AGU, 94, 121–122, https://doi.org/10.1002/2013eo130001
Key Figures

50-year mean (left) and changes (right) to global ocean surface salinity (contributed by P. Durack)

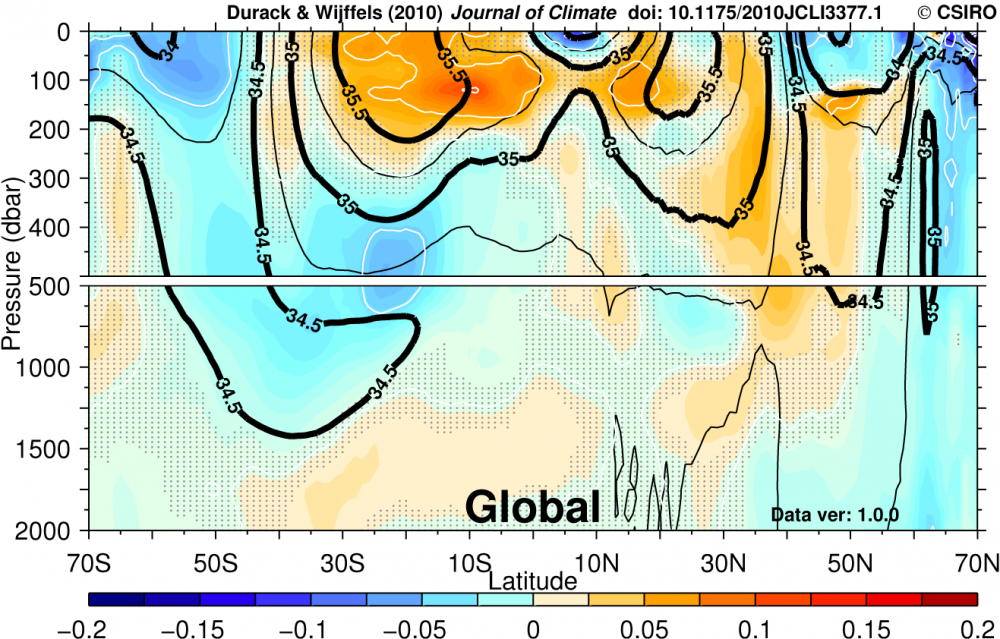
50-year zonal mean changes global ocean salinity (contributed by P. Durack)
Other Information
- Durack, Paul J., Susan E. Wijffels, 2010: Fifty-Year Trends in Global Ocean Salinities and Their Relationship to Broad-Scale Warming. J. Climate, 23, 4342–4362.
- Kobayashi and Suga (2006), The Indian Ocean HydroBase: A high-quality climatological dataset for the Indian Ocean, Progress in Oceanography 68, 75-114
- Durack, PJ, SE Wijffels, and RJ Matear, (2012), Ocean Salinities Reveal Strong Global Water Cycle Intensification During 1950 to 2000, Science, 366, 455-458.
- Hydrobase2/3: Curry, R., cited. 2002: Hydrobase2: A database of hydrographic profiles and tools for climatological analysis. Woods Hole Oceanographic Institute.
- WOCE Southern Ocean Atlas: Orsi, A. H., and T. Whitworth, cited. 2010: Southern Ocean. Vol. 1, Hydrographic Atlas of the World Ocean Circulation Experiment (WOCE), Texas A&M University.
- Rhein, MS et al (2013), Observations: Ocean (Chapter 3). In: Climate Change 2013: The Physical Science Basis. Contribution of Working Group I to the Fifth Assessment Report of the Intergovernmental Panel on Climate Change