Argo Ocean Temperature and Salinity Profiles
Argo is an array of over 4100 profiling floats distributed almost uniformly across the global oceans. First deployed in 2000, Argo floats provide temperature and salinity profiles from the surface to a depth of 2000m. The array has approximately 1 float for every 3 degrees of latitude and longitude, providing a new profile once every 10 days. 'Real-time' data are available within 12 hours of collection, while 'delayed-mode', bias-corrected data are available within a year of collection. On the whole, Argo provides one of the most accurate and comprehensive means of observing global ocean temperature and salinity changes. Several institutions provide gridded fields based on Argo data.
Key Strengths
Global collection of millions of high-quality temperature and salinity profiles from the surface to 2000 dbar collected since 2004. Growing spatial coverage for Deep Argo profiles from 2000 - 6000 dbar and for BioGeoChemical (BGC) profiles including oxygen, pH, nitrate concentration, chlorophyll a concentration, suspended particles and downwelling irradiance
Designed for accurate estimates of large-scale (Order 100s of km), month-to-month variability in ocean heat and freshwater
All data is in a consistent data format and rich metadata
Key Limitations
Inconsistent vertical and horizontal sampling, thus some interpolation is required for many applications
Many profiles are taken under sea ice and their location is estimated rather than measured
"These data were collected and made freely available by the International Argo Program and the national programs that contribute to it. (https://argo.ucsd.edu, https://www.ocean-ops.org). The Argo Program is part of the Global Ocean Observing System."
from Acknowledging Argo data.
Expert User Guidance
The following was contributed by Sarah Purkey and Megan Scanderbeg, Scripps Institution of Oceanography, July 2025:
What are the typical research applications of this data set?
Argo data are used in a variety of research applications including the study of ocean temperature and heat content, the ocean salinity and freshwater content, sea level rise, ocean circulation and more. The 20+ year record of Argo profiles can be combined with earlier ship-based CTD profiles to understand long term trends in temperature and salinity. See the figure below for an estimation of subsurface temperature anomalies using Argo data. Argo data are also used to study and predict ocean marine heat waves and seasonal weather patterns like El Niño.
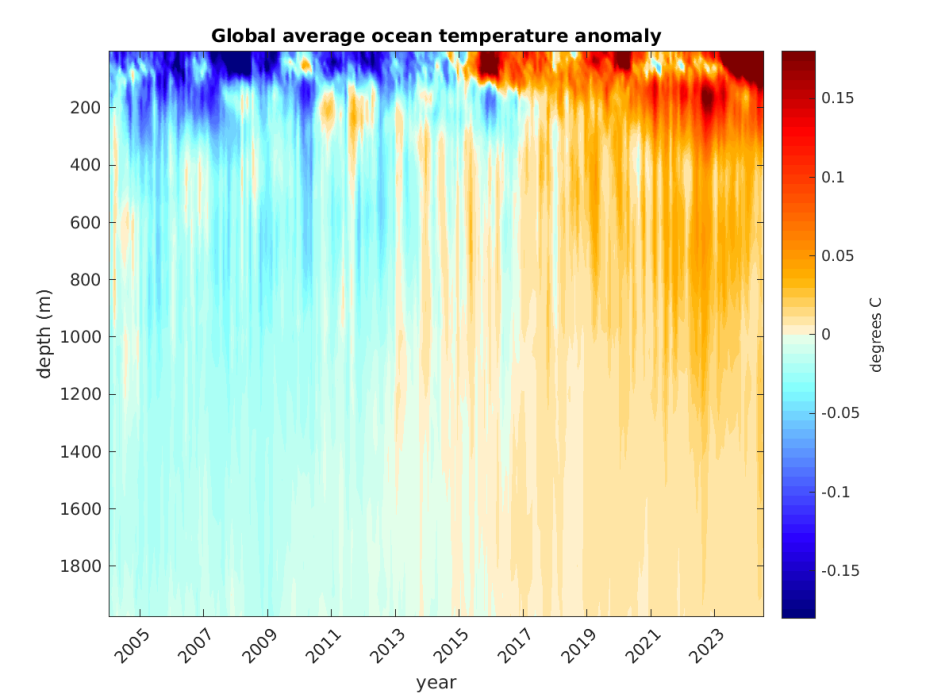
The temperature anomalies (relative to the entire period) of the global ocean averaged over depth. The upper few hundred meters have signatures on interannual variability, predominantly due to ENSO, whereas the deep ocean shows a consistent warming trend illustrating the ocean's uptake of heat.
Argo temperature and salinity profiles are ingested by operational centers worldwide and are a key component of most global reanalysis datasets and there are 10+ global gridded climatologies that include Argo data.
Biogeochemical data are used to monitor ocean de-oxygen and ocean carbon chemistry, mapping subsurface chlorophyll distributions, and can be used to better trace ocean ventilation and circulation. Nitrate data map nutrient distribution and cycling in the ocean and optically sensors help advance our understanding of particulate composition and chlorophyll-a concentration throughout the ocean. pH data are advancing our understanding of ocean acidification and estimating carbon dioxide fluxes between the ocean and atmosphere.
What are the most common mistakes that users encounter when processing or interpreting these data?
Users can get confused over which version of the variable to us (i.e. TEMP vs TEMP_ADJUSTED). In general, the _ADJUSTED should always be used when available. The variable should be selected based on the ‘DATA_MODE’. If the ‘DATA_MODE’ is ‘A’ or ‘D’, users should access the *_ADJUSTED variable which has been through more rigorous quality control than the unadjusted data. If the ‘DATA_MODE’ is ‘R’, only the unadjusted data such as TEMP and PSAL are available.
Quality control flags should always be used to select data and adjusted data has errors associated with the measurements which can also be used to select data. For work requiring high accuracy, only adjusted data should be used.
BGC data should only be used in adjusted mode. The unadjusted data coming is not useful for scientific purposes as the sensors are still undergoing development.
What are some comparable data sets, if any?
Ship based measurements like CTD casts can be comparable, especially when used with water sampling bottle salinities, but are scarcer in time and space. GO-SHIP and WOCE datasets are of high quality and are the most similar to Argo profile data.
Gliders often use the same sensors as Argo floats and so can provide comparable data in that sense, but they follow a different dive protocol than Argo floats and sensors are routinely recalibrated on gliders, unlike on Argo floats.
How is uncertainty characterized in these data?
Argo floats are deployed and are not retrieved, so the quality of the data from the sensors relies on their accuracy, stability and understanding sensor behavior and how to adjust the data accordingly. The temperature sensors on Argo floats are considered stable and routinely perform within the stated accuracy of 0.002 degrees C.
The pressure sensor stability is evaluated by looking at the time series of sea surface pressure measurements made at the surface. When needed, pressure data is corrected in delayed mode quality control and regularly performs within the quoted accuracy of 2.4dbar.
Salinity stability is evaluated by comparing the time series of data from each float with nearby high quality reference data on potential temperature surfaces. This method relies on timely and close-by reference data which can come either from high quality ship based CTD casts or other Argo profiles that have already been evaluated and determined to be of high quality. With good quality reference data, the salinity data regularly can be corrected to within 0.01 PSS-78 uncertainty.
Are there spurious (non-climatic) features in the temporal record?
There is a study covering the first twenty years of the Argo data record of temperature and salinity which describes known issues with the pressure sensor and salinity measurements (Wong et al. 2020). However, if users use only Delayed Mode adjusted data with a QC flag equal to 1 and filter for ADJUSTED_PRES_ERROR less than 20db, these issues should be removed from the dataset.
How do I access these data?
Argo data files are served at the Global Data Assembly Centres (GDACs) via https, ftp, a DOI monthly tarball, ERRDAP services, and Amazon Web Services. See the Argo Data Management Team Website for more details.
How frequently are the data updated?
Every 30 minutes at the Global Data Assembly Centres.
Can you recommend any cloud platforms and/or online plotting tools where one can visualize and interact with these data?
There are several visualization tools available showing Argo data provided here. The EuroArgo selection tool (Euro Argo Data Selection) and Argovis (Argovis - Argo profile dataset) are both global and allow for direct download of data after selection. Both allow for visualization on the fly, but are set up differently and should thus be explored to see which is preferable for your needs.
Is there any publicly available code that illustrates how to access and analyze these data? If so, where?
Yes, there are many software tools that have been developed to access and analyze Argo data. These are explained on this web page. There are also several QC tools listed on that website, but these are designed to be used by internal delayed mode quality control Argo experts. There is a python data library called argopy and OneArgo toolboxes in R, python, and Matlab that access and visualize the data. There is an R package called argofloats that downloads, visualizes and does some analysis of Argo data.
The following was contributed by Josh Willis, Jet Propulsion Laboratory, January, 2014:
The Argo array of profiling floats is a globally distributed network of autonomous, profiling robots that observe temperature and salinity over the top 2000 m (roughly the top half) of the oceans. They are distributed globally, with approximately 1 float every 3 degrees of latitude and longitude, providing a new profile once every 10 days.
The Argo array provides the most accurate and comprehensive means of observing global temperature and salinity change in the world’s oceans. Although salinity sensors in the Argo floats can be subject to biases that vary slowly over the course of months and years, the Argo data system is carefully constructed so data centers now provide corrected salinities, where these drifts are estimated and corrected for. These corrected data are referred to as delayed-mode data and are available within one year of collection of any individual profile. Data that have not had the salinity correction are referred to as real-time data, and are available within 24 hours of collection. In practice, these data are accurate enough for many scientific and operational purposes.
Data from the Argo array now provide the most accurate, ongoing observations of global ocean heat uptake, which is a direct result of human-caused changes in global mean temperature. Nevertheless, they do have some limitations. The Argo floats do not sample at very fine resolution in the ocean and are note capable of resolving small features such as ocean eddies. At present, they also do not sample the deep ocean, and in some (usually high-latitude) regions it has been suggested that human-caused warming of the ocean penetrates all the way to the sea floor. Finally, Argo provides only a few observations in regions with seasonal sea ice. Specially designed floats have been deployed in a few regions that can avoid seasonal sea ice, but the Arctic Ocean and many parts of the Southern Ocean are not sampled by Argo. Finally, because most Argo floats profile to a depth of 2000 m, they cannot sample the shallow marginal seas that are important for many coastal areas.
It is often suggested that because Argo floats drift freely in the oceans, they do not provide good uniform sampling. However, there is very little evidence for floats clumping, or experiencing significant divergence anywhere in the global oceans except for the equatorial Pacific. Most floats spend about 9 days drifting at 1000 m depth, and 1 day at the surface transmitting data. In most regions, this duty cycle results in a rather random pattern of float trajectory. In the Equatorial Pacific, however, the strong surface divergence tends to push floats off the equator making it difficult to sample. In recent years, floats that spend at little as 1 hour at the surface have been used to populate this region and the resulting sampling along the equator has been much improved.##
Cite this page
Acknowledgement of any material taken from or knowledge gained from this page is appreciated:
Scanderbeg, Megan &, Purkey, Sarah &, Willis, Josh & National Center for Atmospheric Research Staff (Eds). Last modified "The Climate Data Guide: Argo Ocean Temperature and Salinity Profiles .” Retrieved from https://climatedataguide.ucar.edu/climate-data/argo-ocean-temperature-and-salinity-profiles on 2026-07-21.
Citation of datasets is separate and should be done according to the data providers' instructions. If known to us, data citation instructions are given in the Data Access section, above.
Acknowledgement of the Climate Data Guide project is also appreciated:
Schneider, D. P., C. Deser, J. Fasullo, and K. E. Trenberth, 2013: Climate Data Guide Spurs Discovery and Understanding. Eos Trans. AGU, 94, 121–122, https://doi.org/10.1002/2013eo130001
Key Figures


The temperature anomalies (relative to the entire period) of the global ocean averaged over depth. The upper few hundred meters have signatures on interannual variability, predominantly due to ENSO, whereas the deep ocean shows a consistent warming trend illustrating the ocean's uptake of heat.
Other Information
- Roemmich, D. and J. Gilson, 2009: The 2004-2008 mean and annual cycle of temperature, salinity, and steric height in the global ocean from the Argo Program. Progress in Oceanography, 82, 81-100.
- Argo (2000). Argo float data and metadata from Global Data Assembly Centre (Argo GDAC). SEANOE. https://doi.org/10.17882/42182
- Argo Bibliography