Integrated Global Radiosonde Archive (IGRA)
The largest publicly available collection of quality-controlled, globally-distributed, historical radiosonde and pilot balloon observations is the Integrated Global Radiosonde Archive (IGRA; Durre et al. 2006, 2018). First released in 2004, IGRA is maintained and distributed by NOAA’s National Centers for Environmental Information (NCEI). IGRA v2.2, which was released in 2023, consists of a total of more than 50 million soundings from more than 2,800 globally distributed stations, including some ships. The earliest data date back to 1905, and recent data are updated once a day from about 900 stations worldwide. Depending on the location and time, a sounding may contain measurements of temperature, humidity, and/or wind speed and direction, and the height of each observation within the atmosphere is indicated by pressure and/or geopotential height.
Key Strengths
Comprehensiveness: IGRA brings together data from more than 30 disparate historical and real-time sources of vertical profiles measured by radiosondes and pilot balloons. Data from these sources are merged to create the longest, most complete time series of soundings for each unique location for which data are available. In addition, the latest observations are added during daily updates.
Quality: A suite of quality control procedures identifies gross inconsistencies, outliers, streaks, and duplicates in the data. Values, data levels, and soundings that fail at least one of these checks are not included in the final dataset.
Suitability for applications requiring vertical profiles: As a result of these characteristics, IGRA data can be used for a wide variety of applications that require historical observations of vertical profiles. For example, weather and air pollution forecasting, investigations of atmospheric structure, validation of satellite observations, etc.
Key Limitations
IGRA does not contain very-high-vertical-resolution radiosonde data that is gradually becoming more available from observing sites around the globe. For inclusion in IGRA, such highly resolved profiles are downsampled to reflect the standard and significant pressure levels that have historically been common.
Since 1905, there has been considerable variation over time in the location and density of observing sites, the completeness of data records and station history information, the vertical resolution of profiles, and the height reached by profiles.
See the Expert Guidance section, below, as well as the linked references and other resources for more information on the strengths, limitations and applications of this dataset.
Cite this dataset as: Durre, Imke; Xungang, Yin; Vose, Russell S.; Applequist, Scott; Arnfield, Jeff. (2016) Integrated Global Radiosonde Archive (IGRA), Version 2. [indicate subset and exact version used]. NOAA National Centers for Environmental Information. DOI:10.7289/V5X63K0Q [access date].
All IGRA-related information is provided in plain-text files. The data in each file are deliberately organized so that both humans and computer programs can easily read and process the information. Alternate formats are not currently available.
The following two documents provide the most important documentation needed for using the data.
IGRA 2 Product Description: This file provides an overview of IGRA, how it can be accessed, and how it was created.
Readme: This file contains an explanation of the available file types and locations.
Files are available via two commonly-used protocols: HTTPS and legacy FTP. On the Integrated Global Radiosonde Archive (IGRA) Website at https://www.ncei.noaa.gov/products/weather-balloon/integrated-global-radiosonde-archive , use the HTTPS links for bulk downloads or to browse folders and manually download individual files. The FTP addresses are best used for bulk downloads from Linux servers and similar consoles and are not supported by all browsers.
Expert Developer Guidance
The following was contributed by Imke Durre and Bryant Korzeniewski, August, 2023:
Vertical profiles of atmospheric temperature, moisture, and wind provide information that is critical to understanding weather conditions and for predicting how these conditions will evolve. They therefore serve as input to most atmospheric models, including weather forecast models, atmospheric reanalyses, and air pollution models. Weather forecasters also rely on these observations when formulating local forecasts since actual local atmospheric conditions may differ from those simulated in forecast models.
While satellite-based observations provide a nearly spatially complete view of atmospheric conditions, the longest available record of atmospheric profiles originates from balloon-borne measurements. Since the early 20th century, profiles of atmospheric conditions have been measured by instrument packages, a.k.a. Radiosondes, tied to a kite or balloon and launched from the ground. Temperature and relative humidity are measured by sensors within a specially-designed housing, i.e., the radiosonde. Wind direction and speed are inferred by tracking the movement of a balloon with either the Global Positioning System (GPS) or, particularly historically, one of several other methods. When that balloon does not have a radiosonde attached to it, it is known as a pilot balloon.
The largest publicly available collection of quality-controlled, globally-distributed, historical radiosonde and pilot balloon observations is the Integrated Global Radiosonde Archive (IGRA; Durre et al. 2006, 2018). First released in 2004, IGRA is maintained and distributed by NOAA’s National Centers for Environmental Information (NCEI). IGRA v2.2, which was released in 2023, consists of a total of more than 50 million soundings from more than 2,800 globally distributed stations, including some ships. The earliest data date back to 1905, and recent data are updated once a day from about 900 stations worldwide. Depending on the location and time, a sounding may contain measurements of temperature, humidity, and/or wind speed and direction, and the height of each observation within the atmosphere is indicated by pressure and/or geopotential height.
In addition to the sounding data, IGRA contains several derived products. These include sounding-derived humidity and stability parameters, monthly means, and the homogeneity-adjusted time series of temperature anomalies that constitute the Radiosonde Atmospheric Temperature Products for Assessing Climate (RATPAC) (Durre et al. 2018). Also included is station history information that can be helpful for interpreting data. Depending on availability, this information can encompass station names and locations, instrumentation, and observing practices employed at various points in time throughout a station’s record.
Key Strengths
The strengths of IGRA lie in its comprehensiveness, quality, accessibility, and suitability for a wide variety of applications. These four strengths are described further below.
● Comprehensiveness: IGRA brings together data from more than 30 disparate historical and real-time sources of vertical profiles measured by radiosondes and pilot balloons. These sources complement each other in terms of time periods covered and spatial extent (Durre et al. 2018). Thanks to a specially-designed rules-based algorithm, data from these sources are merged to create the longest, most complete time series of soundings for each unique location for which data are available. In addition, the latest observations are added during daily updates.
● Quality: A suite of quality control procedures identifies gross inconsistencies, outliers, streaks, and duplicates in the data (Durre et al. 2018). Values, data levels, and soundings that fail at least one of these checks are not included in the final dataset (Durre et al. 2006, 2008, 2018).
● Accessibility: IGRA, including the sounding data, derived products, station history information, and documentation, is available free of charge from NCEI’s website.
● Suitability for applications requiring vertical profiles: As a result of these characteristics, IGRA data can be used for a wide variety of applications that require historical observations of vertical profiles. They have been used as input to, or for the verification of, models that are used in weather and air pollution forecasting. They are also well-suited for investigations of atmospheric structure, analyses of specific weather events, and atmospheric process studies, all of which can aid the development of model and forecast improvements. Finally, they have been used to validate observations from other observing platforms (e.g., satellites) and to detect and monitor long-term changes.
Key Limitations
In order to maintain consistency with the historical record, IGRA does not contain very-high-vertical-resolution radiosonde data that is gradually becoming more available from observing sites around the globe. For inclusion in IGRA, such highly resolved profiles are downsampled to reflect the standard and significant pressure levels that have historically been common. Users interested in very-high-resolution data are referred to links provided in the Related Pages section.
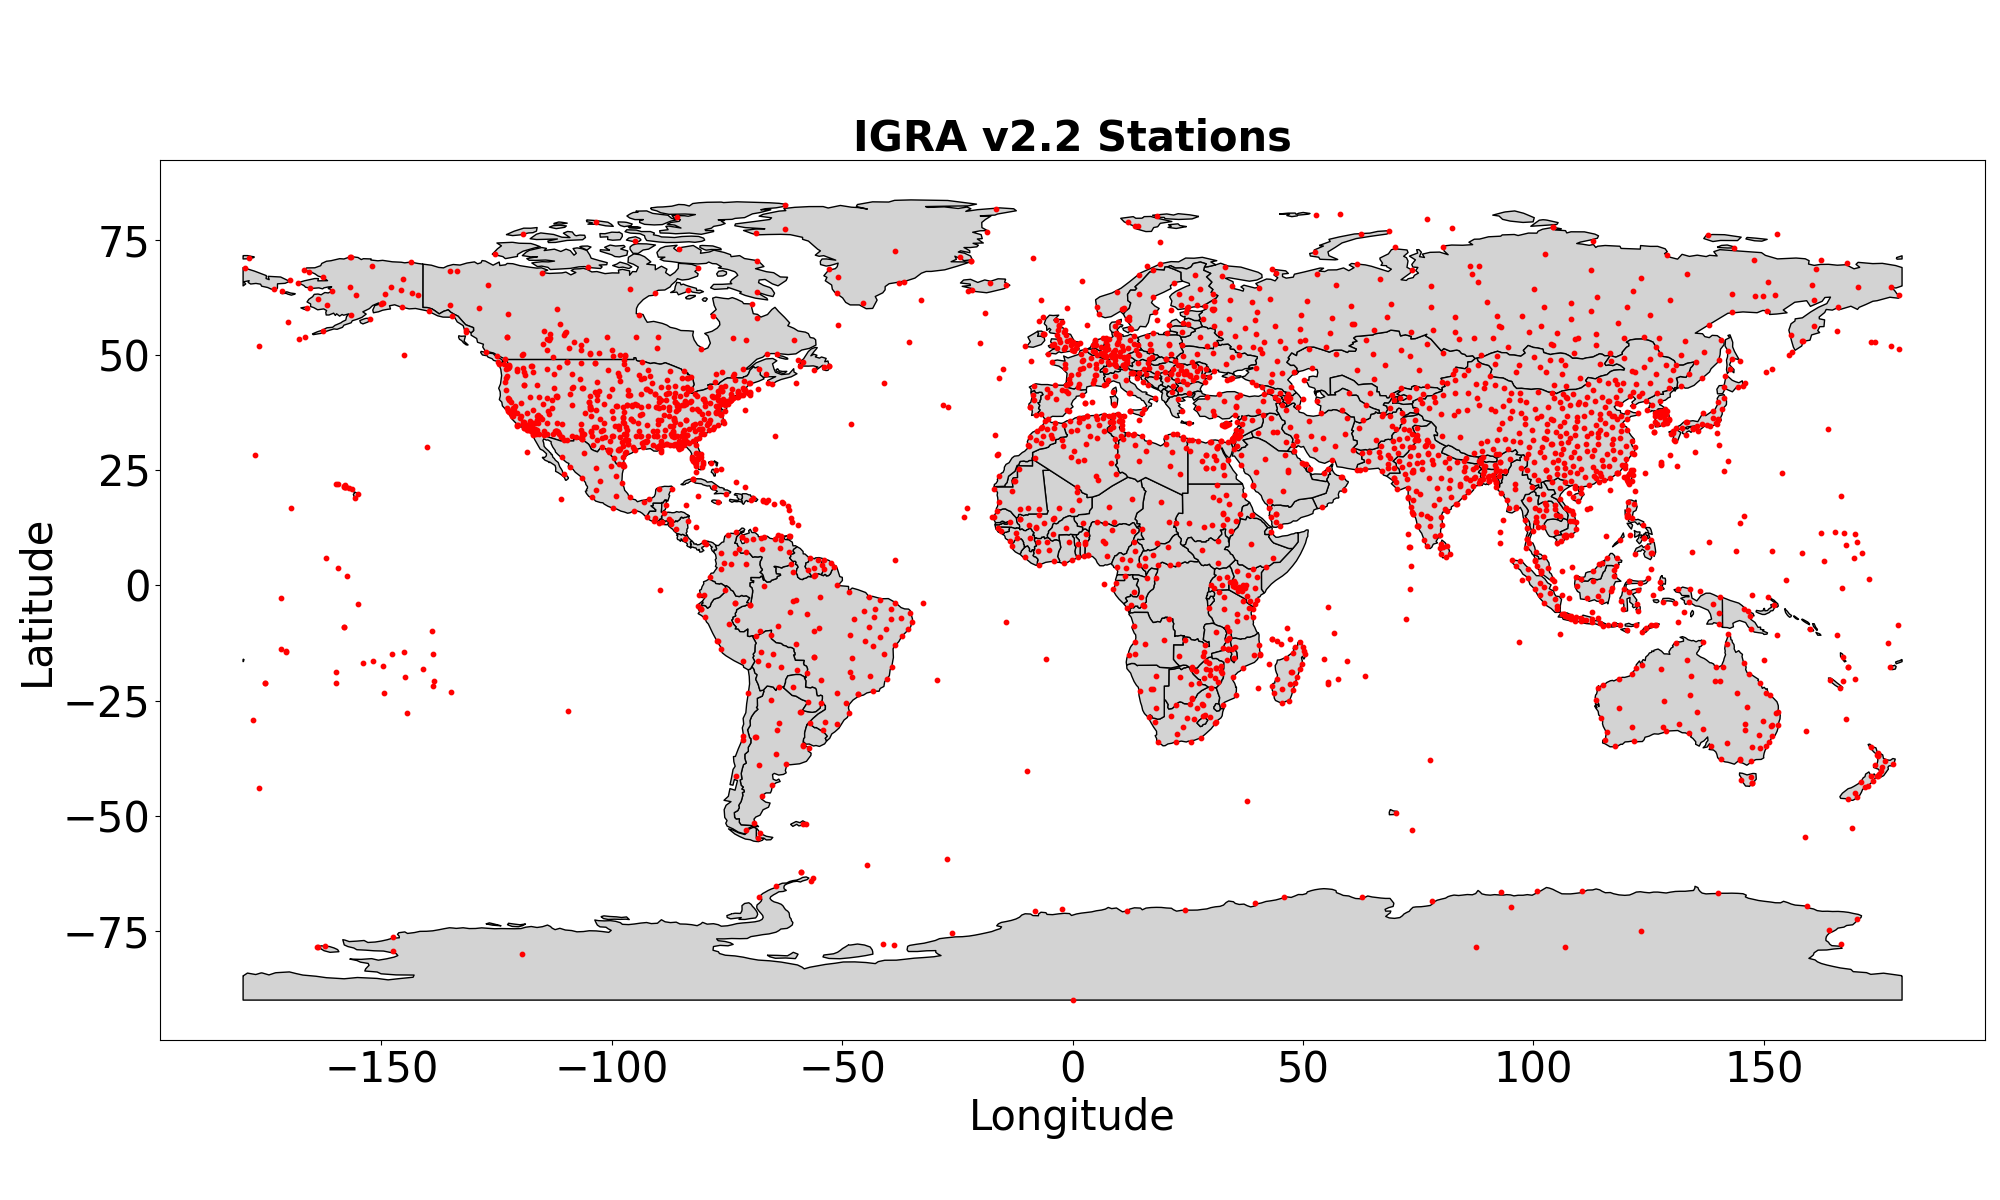
Since 1905, there has been considerable variation over time in the location and density of observing sites, the completeness of data records and station history information, the vertical resolution of profiles, and the height reached by profiles (Durre et al. 2006, 2018). With the growth of the radiosonde network during the first half of the twentieth century, the number of stations with IGRA data increased from fewer than ten between 1905 and 1917 to around 500 by the 1940s and exceeded 1000 by the 1960s (Figure 1). A further increase of approximately 500 stations is associated with the advent of automated transmissions of observations in 1973. The gradual decrease in stations since the late 1970s can be explained primarily by station closures around the world, particularly where the cost of launching radiosondes poses a significant challenge. A comparison of the maps of all and currently active IGRA stations in Figures 2 and 3 illustrates the impact of these closures on the available spatial coverage. The IGRA sounding data, derived parameters, and monthly means have not been adjusted to remove the jumps and other discontinuities that can result from station relocations, equipment changes, or changes in observing practice. Such inhomogeneities can mask the true climatic changes that are reflected in the data. Consequently, users studying long-term trends may wish to use a homogeneity-adjusted dataset such as the global- and hemispheric-scale RATPAC time series or one of the non-NOAA IGRA-derived, homogeneity-adjusted radiosonde datasets that are available elsewhere.
Cite this page
Acknowledgement of any material taken from or knowledge gained from this page is appreciated:
Durre, Imke &, Korzeniewski, Bryant & National Center for Atmospheric Research Staff (Eds). Last modified "The Climate Data Guide: Integrated Global Radiosonde Archive (IGRA).” Retrieved from https://climatedataguide.ucar.edu/climate-data/integrated-global-radiosonde-archive-igra on 2026-07-07.
Citation of datasets is separate and should be done according to the data providers' instructions. If known to us, data citation instructions are given in the Data Access section, above.
Acknowledgement of the Climate Data Guide project is also appreciated:
Schneider, D. P., C. Deser, J. Fasullo, and K. E. Trenberth, 2013: Climate Data Guide Spurs Discovery and Understanding. Eos Trans. AGU, 94, 121–122, https://doi.org/10.1002/2013eo130001
Key Figures
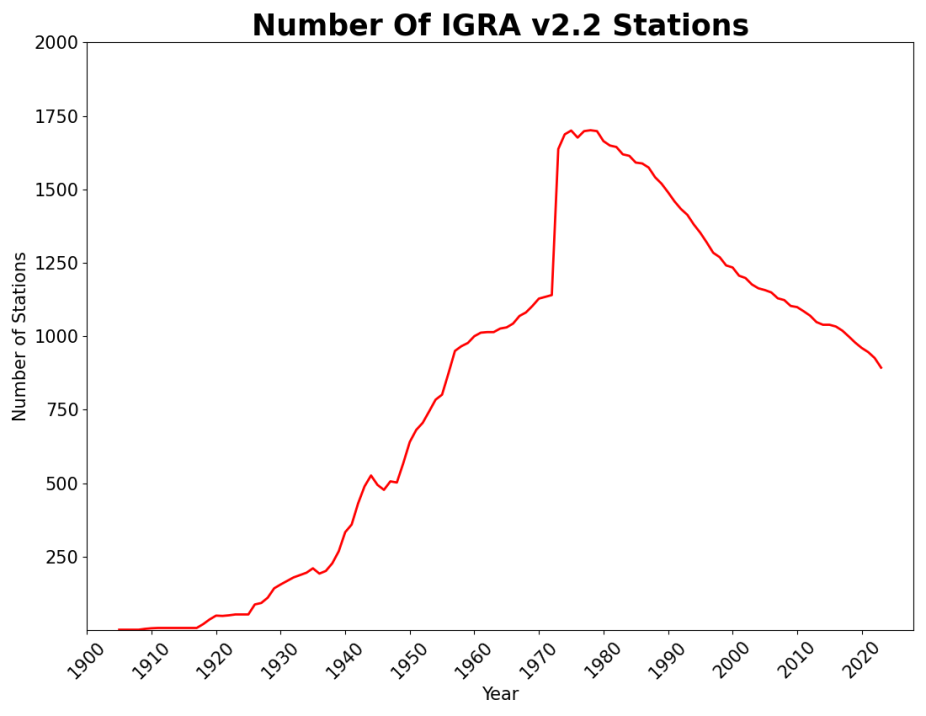
Figure 1: Number of open IGRA stations by year. (credit: Imke Durre and Bryant Korzeniewski)

Figure 2: Map of the locations for all available IGRA v2.2 stations. (credit: Imke Durre and Bryant Korzeniewski)
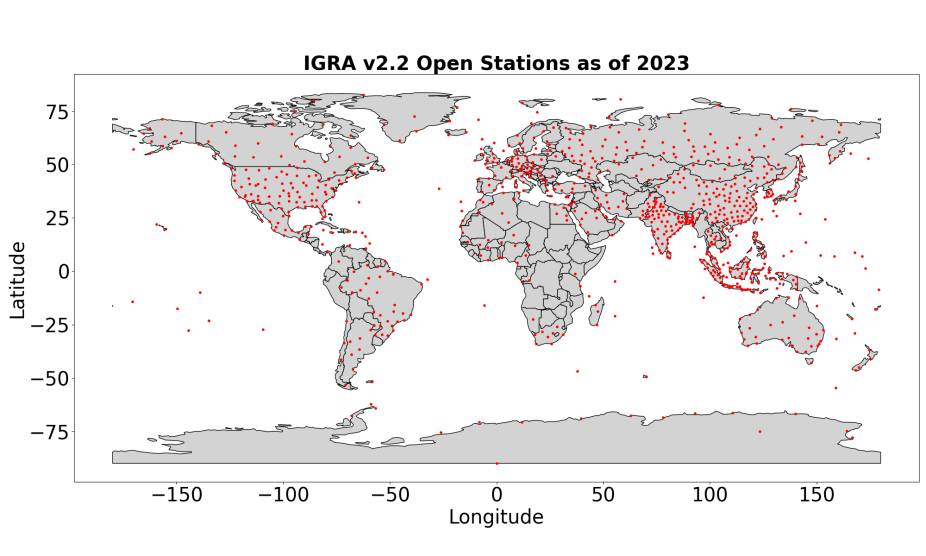
Figure 3: Map of all IGRA v2.2 Stations with Data in 2023 (as of August 2023). (credit: (Imke Durre and Bryant Korzeniewski))
Other Information
- Durre, I., R. S. Vose, and D. B. Wuertz, 2006: Overview of the Integrated Global Radiosonde Archive. Journal of Climate, 19, 53-68. [Overview of IGRA version 1.]
- Durre, I., R. S. Vose, and D. B. Wuertz, 2008: Robust automated quality assurance of radiosonde temperatures. Journal of Applied Meteorology and Climatology, 47, 2081-2095. [This paper describes the temperature quality control procedures that were deve
- 3. Durre, I., X. Yin, R. S. Vose, S. Applequist, J. Arnfield, 2018: Enhancing the Data Coverage in the Integrated Global Radiosonde archive. Journal of Atmospheric and Oceanic Technology, 35, 1753-1770. [Overview of enhancements and data additions that r