JRA-3Q Atmospheric Reanalysis
The Japanese Reanalysis for Three Quarters of a Century (JRA-3Q) is the third generation long-term reanalysis product developed by the Japanese Meteorological Agency (JMA). JRA-3Q is a reanalysis using the JMA global Numerical Weather Prediction (NWP) system as of 12/2018. Compared to the previous generation JRA-55 reanalysis, JRA-3Q benefits from developments of the operational NWP system used to assimilate observational data as well as improvements in the boundary conditions and forcing fields used for the reanalysis. The JRA-3Q product spans the period from September 1947 to present with September 1947 chosen as the date when Typhoon Kathleen brought severe flood damage to Japan. JRA-3Q uses rescued historical observations to extend backwards in time about 10 years earlier than JRA-55.
Key Strengths
Long-term, high quality global atmospheric reanalysis spanning 1947-Present at 0.375° spatial resolution and 6-hourly temporal resolution. Near real-time version provided with ~5 days lag.
Improvements in key atmospheric variables compared with JRA-55 as demonstrated by comparisons with observational products and through improved two-day forecasts of 500-hPa height.
Improves two major problems in the previous generation JRA-55 by (1) reducing the net upward global energy balance bias and (1) reducing a biased decreasing trend in tropical cyclone intensity.
Key Limitations
There is a possible discontinuity in some statistics at June 1985 due to a change in the product used for sea surface temperature boundary conditions. Care should be given in analyzing low-frequency variability and trends of variables influenced by sea surface temperature across this date.
Stratospheric warming after major volcanic eruptions is smaller than expected.
There is a wet precipitation bias across much of the tropics when compared with GPCP, though this bias is reduced compared to JRA-55.
Studies using JRA-3Q data should cite Kosaka et al. (2024) and provide the following text in the acknowledgments: "This report references JRA-3Q reanalysis data from the Japan Meteorological Agency."
- NCAR GDEX access to JRA-3Q (DOI: 10.5065/AVTZ-1H78)
- NCAR GDEX access to near real-time JRA-3Q (DOI: 10.5065/E3QQ-0F24)
- NCAR GDEX access to JRA-3Q monthly statistics (DOI: 10.5065/PH0D-MH18)
- NCAR GDEX access to JRA-3Q diurnal statistics (DOI: 10.5065/CW01-2282)
- NCAR GDEX access to near real-time monthly mean JRA-3Q (DOI: 10.5065/PK9Z-C990)
- NCAR GDEX access to near real-time monthly diurnal JRA-3Q (DOI: 10.5065/4Q9N-SG67)
- NCAR GDEX access to JRA-3Q-COBE (DOI: 10.5065/RM7V-3X70)
- DIAS access to JRA-3Q (DOI: 10.20783/DIAS.645)
- DIAS access to JRA-3Q-COBE (DOI: 10.20783/DIAS.661)
Expert Developer Guidance
What are the typical research applications of this data set?
Reanalysis products are used by JMA as fundamental datasets for investigating past weather disasters, improving seasonal forecasts, and analyzing extreme weather events. The products are also widely used in research in academic fields such as meteorology, climatology, and oceanography, as well as in applied fields such as agricultural meteorology and renewable energy.
What are the most common mistakes that users encounter when processing or interpreting these data?
Reanalysis data contain errors as they are estimates based on an NWP system. Forecast values generally have larger errors than analysis values which are corrected using observational data.
What are the key strengths of this data set?
- High-quality and homogeneous reanalysis. Figure 1 shows time series of root mean square (RMS) errors of two-day forecasts of the geopotential height at 500 hPa averaged over the extratropical Northern and Southern Hemispheres. The decrease in the RMS errors from the Japanese 25-year Reanalysis (JRA-25; Onogi et al. 2007) to JRA-55 to JRA-3Q shows that there was a steady improvement in the performance of the JMA data assimilation systems.
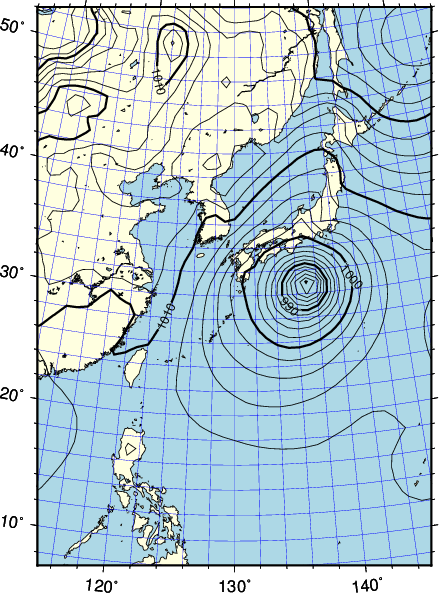
- Long-term full observing system reanalysis covering the period from September 1947 onwards. Extreme weather events before the International Geophysical Year (IGY) (1957–1958) including Typhoon Kathleen in September 1947 (Fig. 2) became analyzable by extending the reanalysis period back in time about 10 years earlier than JRA-55.
- Two major problems of JRA-55 have been addressed. Global energy imbalance with excess upward net energy flux at the top of the atmosphere and at the surface has been significantly reduced (Fig. 3), and a trend of artificial weakening of tropical cyclones (TCs) has been resolved through the use of a method that generates TC bogus based on the JMA operational system (Fig. 4).
What are the key limitations of this data set?
- Stratospheric warming after major volcanic eruptions is smaller than expected.
- Care is needed in using the JRA-3Q products, especially variables that have large sensitivity to lower-boundary conditions, for analyzing low-frequency variability and trends as the sea surface temperature (SST) datasets used in JRA-3Q switched from the Centennial In Situ Observation-based Estimates of the Variability of SSTs and Marine Meteorological Variables Version 2 (COBE-SST2; Hirahara et al. 2014) to the Merged Satellite and In-Situ Data Global Daily Sea Surface Temperature (MGDSST; Kurihara et al. 2006) in June 1985.
What are some comparable data sets, if any?
To enable evaluation of changes in product characteristics following the switch from COBE-SST2 to MGDSST, a sub-product using COBE-SST2 (JRA-3Q-COBE) is also provided for the period from June 1985 to December 1990. Major NWP centers and meteorological research institutes have made an effort to create and improve long-term reanalyses (for a detailed list, see https://reanalyses.org/). Recent state-of-the-art atmospheric reanalyses include the fifth generation of the European Centre for Medium-Range Weather Forecasts (ECMWF) atmospheric reanalysis (ERA5; Hersbach et al. 2020), the Modern-Era Retrospective Analysis for Research and Applications, version 2 (MERRA-2; Gelaro et al. 2017), and the National Centers for Environmental Prediction (NCEP) Climate Forecast System Reanalysis (CFSR; Saha et al. 2014).
Were corrections made to account for changes in observing systems or practices, sampling density, satellite drift, or similar issues?
Bias correction of radiosonde temperatures is applied with RICH with solar elevation dependence (RISE; Haimberger et al. 2012). Variational bias correction (Derber and Wu 1998; Dee and Uppala 2009; Japan Meteorological Agency 2019) is applied to all satellite radiances, but not to other observations.
How useful are these data for characterizing means as well as extremes?
Monthly mean values as well as two-dimensional extreme fields such as 2m maximum temperature, 2m minimum temperature, and 2m maximum wind speed are also included in the JRA-3Q products.
Are there spurious (non-climatic) features in the temporal record?
Stratospheric warming after major volcanic eruptions is smaller than expected. In general, care is needed in using the JRA-3Q products, especially variables that have large sensitivity to lower-boundary conditions, for analyzing low-frequency variability and trends across the two periods (until May 1985 and from June 1985) during which the different SST datasets were used.
How frequently are the data updated?
Near real-time JRA-3Q data are updated with about a five-day delay.
How do I access these data?
JRA-3Q data are available for free of charge for non-commercial purposes under the license of CC-BY-NC-SA 4.0 (Attribution-NonCommercial-ShareAlike) from cooperative organizations. The data is served on the NCAR The Geoscience Data Exchange (GDEX) and the Group on Earth Observations (GEO) Data Integration and Analysis System (DIAS).
Cite this page
Acknowledgement of any material taken from or knowledge gained from this page is appreciated:
National Center for Atmospheric Research Staff (Eds). Last modified "The Climate Data Guide: JRA-3Q Atmospheric Reanalysis.” Retrieved from https://climatedataguide.ucar.edu/climate-data/jra-3q-atmospheric-reanalysis on 2026-07-15.
Citation of datasets is separate and should be done according to the data providers' instructions. If known to us, data citation instructions are given in the Data Access section, above.
Acknowledgement of the Climate Data Guide project is also appreciated:
Schneider, D. P., C. Deser, J. Fasullo, and K. E. Trenberth, 2013: Climate Data Guide Spurs Discovery and Understanding. Eos Trans. AGU, 94, 121–122, https://doi.org/10.1002/2013eo130001
Key Figures
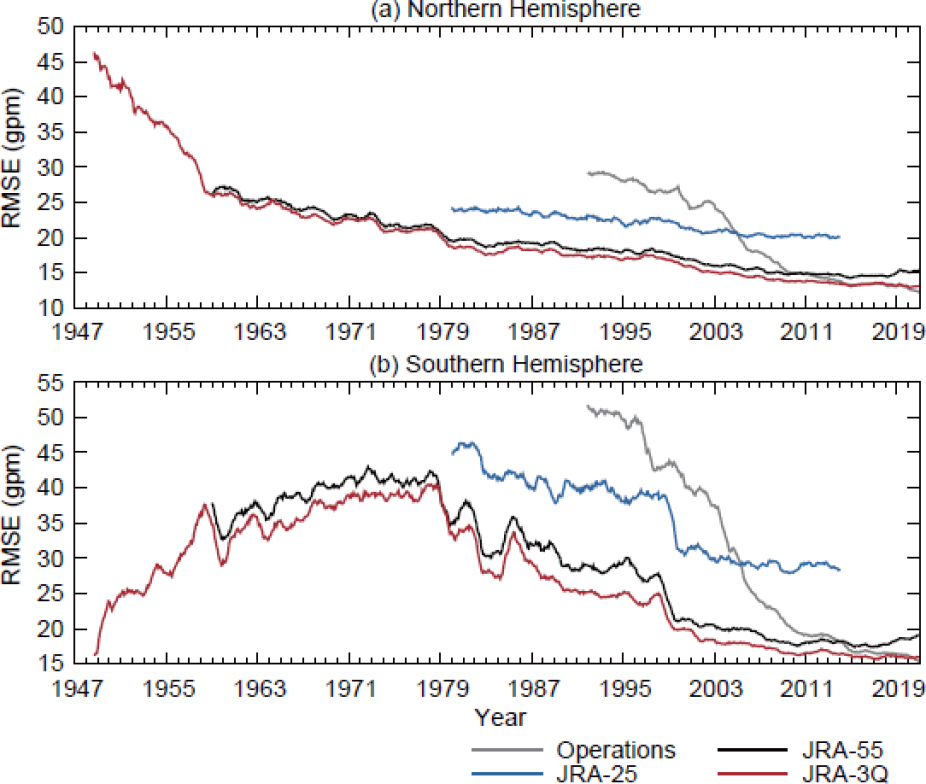
Figure 1: RMS errors of two-day forecasts of the geopotential height at 500 hPa averaged over the extratropics in the (a) Northern and (b) Southern Hemisphere (from 90°N to 20°N and from 20°S to 90°S, respectively) from JRA-3Q, JRA-55, JRA-25, and the JMA operational system, verified against their own analyses. Each value represents the average over the previous 12 months.
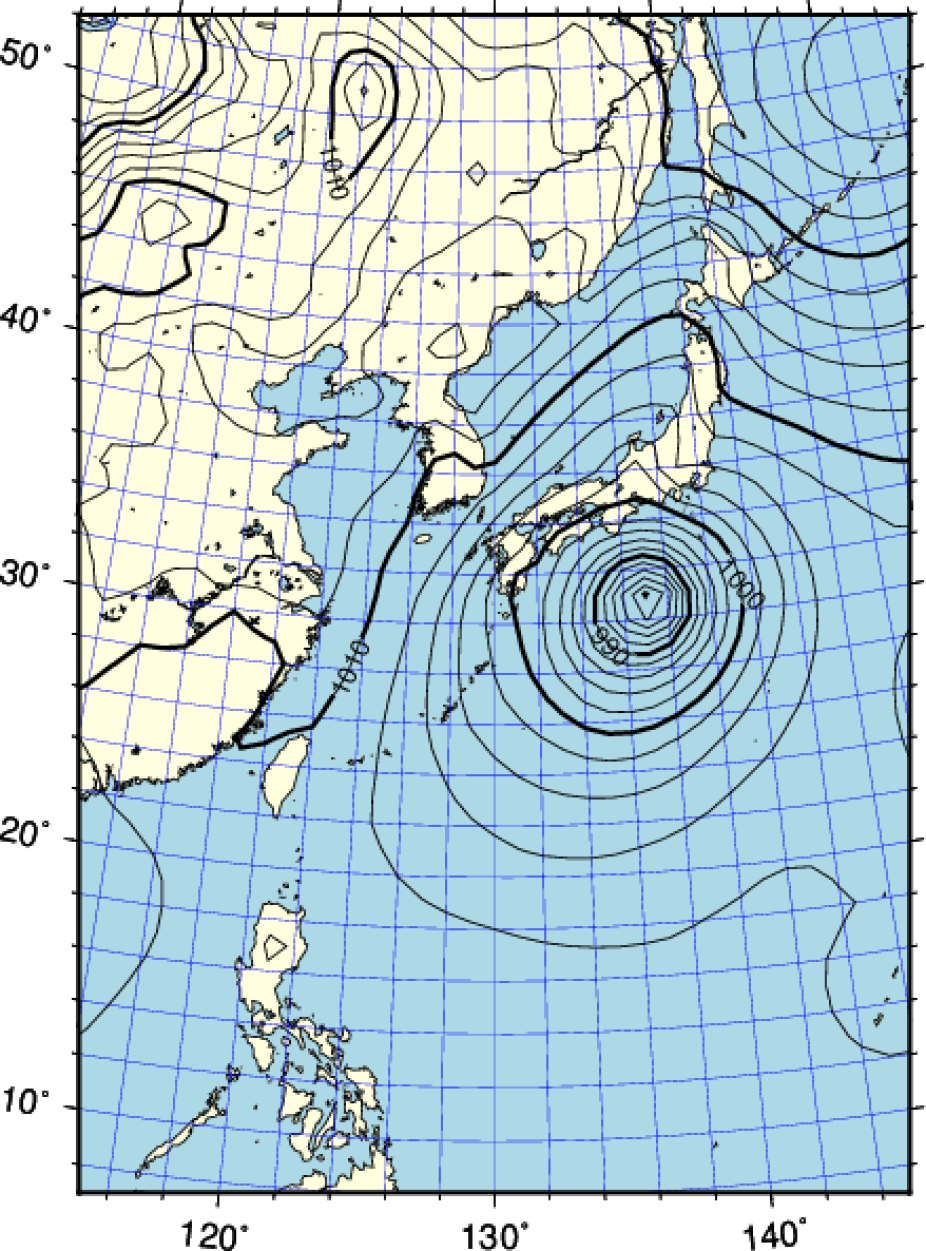
Figure 2a: JRA-3Q field of mean sea level pressure (hPa) from JRA-3Q at 06 UTC on 14 September 1947 showing Typhoon Kathleen
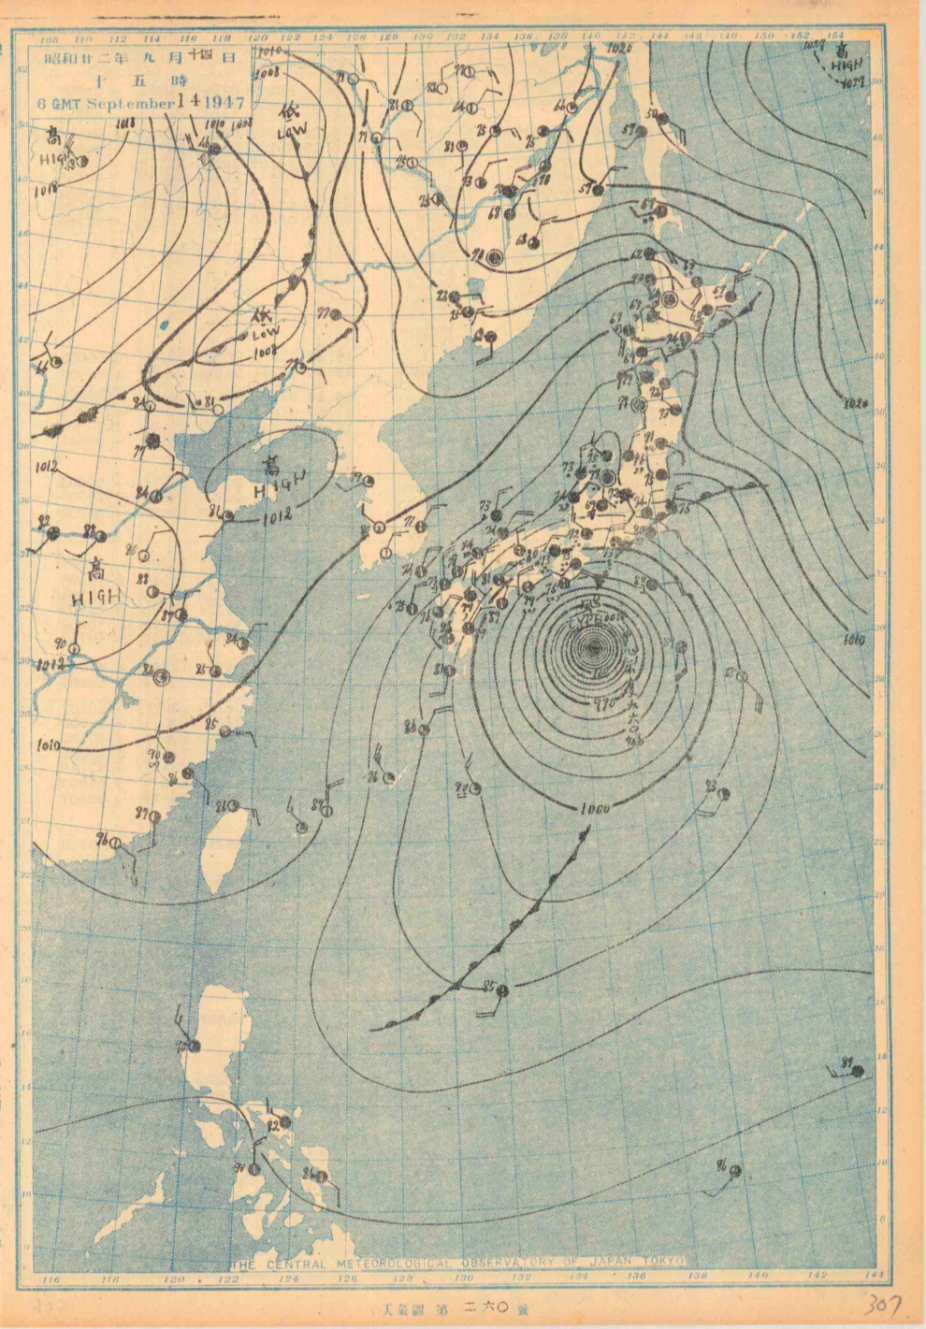
Figure 2b: Analysis field of mean sea level pressure (hPa) from the weather map analyzed at that time (the JMA weather chart).
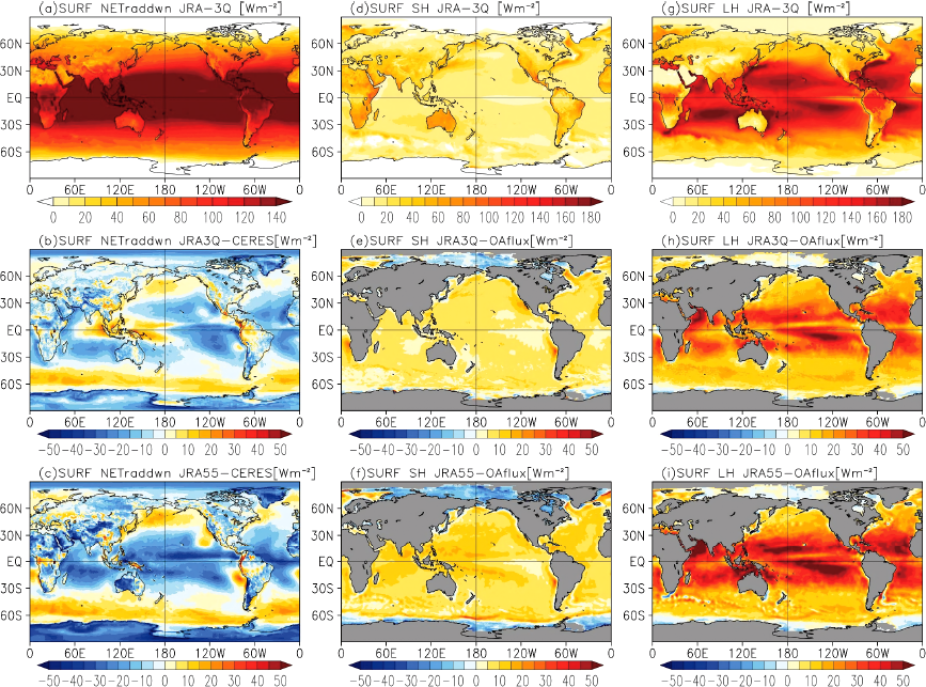
Figure 3: Spatial distributions of (a–c) radiative net heat fluxes, (d–f) sensible heat fluxes, and (g–i) latent heat fluxes at the surface for JRA-3Q (a, d, g), their differences from CERES-EBAF or OAFLUX (b, e, h), and differences of JRA-55 from CERES-EBAF or OAFLUX (c, f, i) averaged over 2002–2008 in units of W m−2.
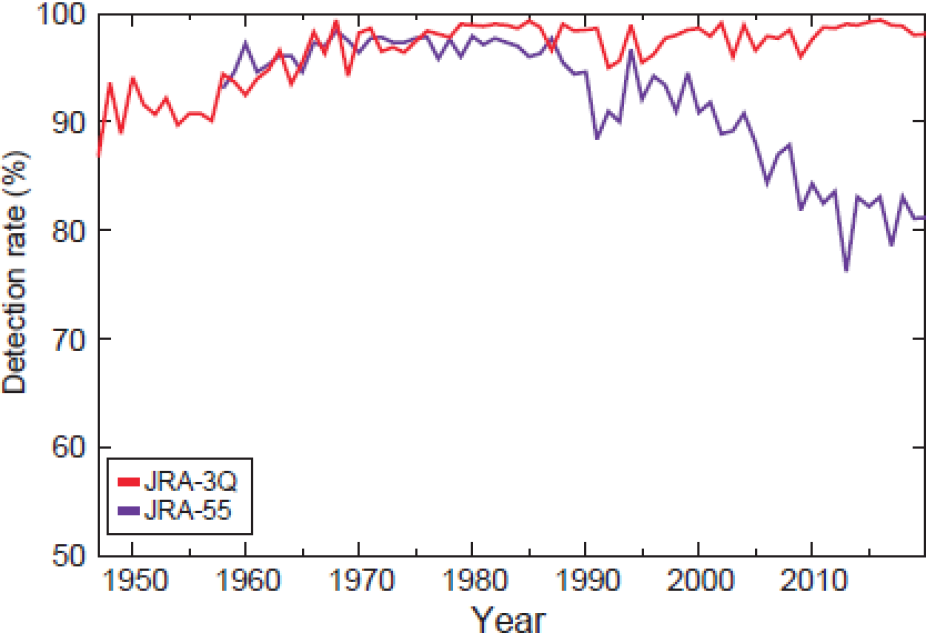
Figure 4: Global tropical cyclone (TC) detection rates in JRA-3Q and JRA-55.