Observations of Glacier Mass Balance: The World Glacier Monitoring Service
Mountain glaciers and ice caps have been studied as sensitive indicators of climate since the 19th century. The recognition of glacier sensitivity to climate led to the development of a global reporting system for glacier terminus change and glacier mass balance during the International Geophysical Year. The World Glacier Monitoring Service (WGMS) has been the repository for this data since 1973. In this capacity, WGMS has an established annual reporting structure, data standardization, and an public database that is updated annually. Glacier mass balance is recognized as the most sensitive and reliable indicator of climate-driven changes to mountain glaciers and ice caps. Glacier terminus change is more readily visible, but is dependent on multi-year variations and has a lagged response time (Johannesson et al. 1989).
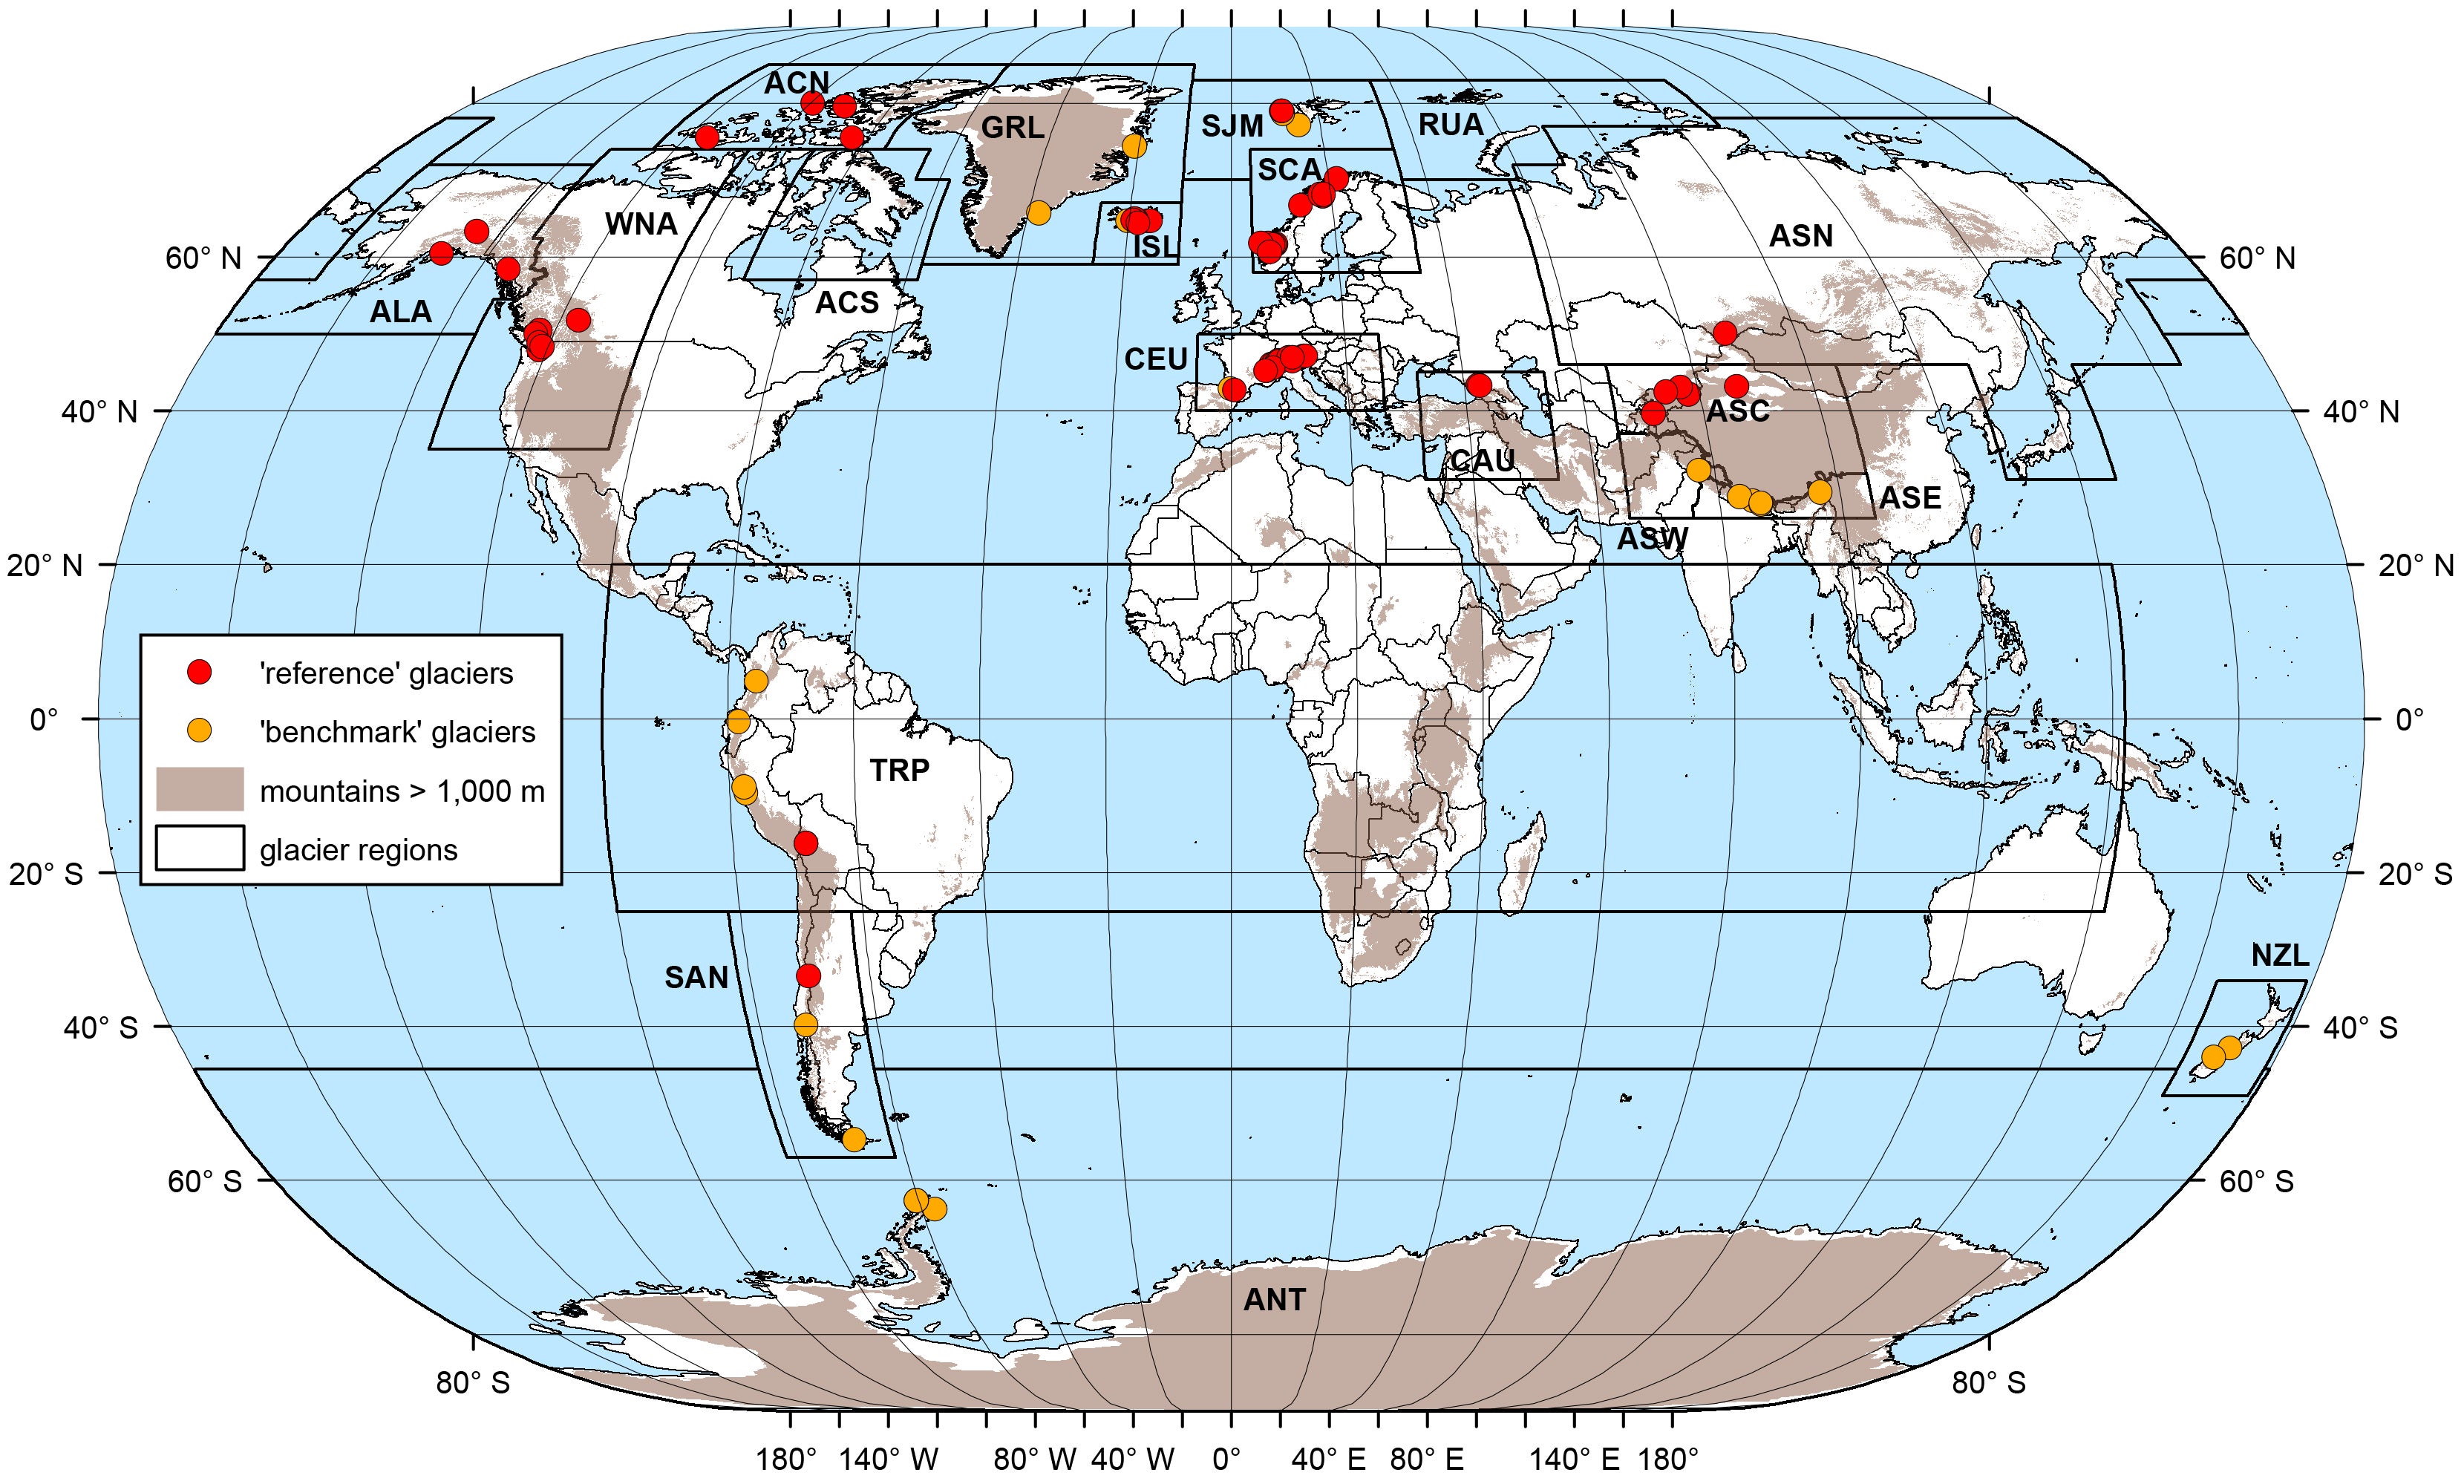
The mass balance of a glacier is the difference between the gain of snow/ice and the loss of snow/ice from the glacier system. The distribution of mass balance across a glacier system and changes in this distribution is a key input for determining glacier dynamics and ongoing terminus behavior (Cogley et al 2011). Accumulation via snowfall, refreezing meltwater, avalanche deposition or wind deposition is the equivalent of income to a glacier system. Ablation via melting, sublimation, calving, or avalanching is equivalent to the expenditure of a glacier system. Together, accumulation and ablation determine the overall mass balance. Glaciers are divided into the ablation zone, and accumulation zone by an equilibrium line as shown on the figure below.
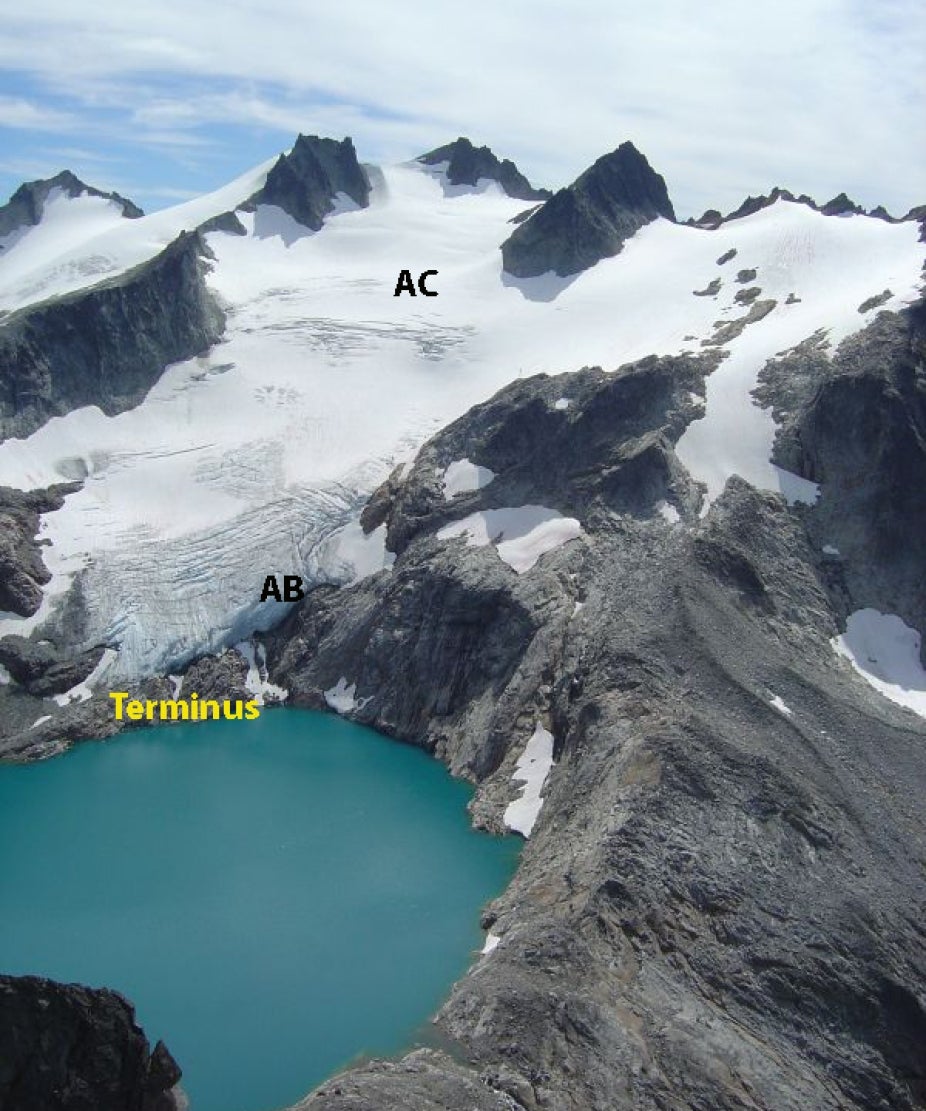
Figure 1: Accumulation (AC) and ablation zone (AB) on Lynch Glacier, Washington (2007).
M. Pelto
The mountain glacier data set with the most consistent long term annual record is the reference glacier data set from the WGMS Glaciological methodology. This glacier mass balance record is part of the Global Climate Observation system. Alpine annual mass balance glaciological observations are reported to WGMS by national representatives with a December 1 annual submission deadline. WGMS "reference" glaciers must have at least thirty continuous years of mass balance observations. WGMS "benchmark" glaciers have at least a ten-year mass balance record and are in regions that lack sufficient reference glaciers. The combination of benchmark and reference glaciers is used to generate regional averages (WGMS, 2023). Global values are calculated using a single averaged value for each of 19 mountain regions, limiting bias from any single observed region (WGMS, 2023). As this dataset expands, the annual values will be recalculated and updated.
Key Strengths
Annual time series of global glacier mass 1976-Present allows for analysis of long-term glacier variability and change
Regional estimates for glacier mass extend as far back as 1915.
Data provided in a standard format and updated annually to ensure future consistency and availability of the data.
Key Limitations
The database of glacier-specific estimates is limited to the glaciers being observed in detail in the field.
Global estimates of glacier mass rely on remote sensing of glaciers, requiring the pooling of many glaciers to fit statistical models.
Dussaillant, I., Hugonnet, R., Huss, M., Berthier, E., Bannwart, J., Paul, F., and Zemp, M. (2025): Annual mass-change estimates for the world’s glaciers. Individual glacier time series and gridded data products. Digital media. https://doi.org/10.5904/wgms-amce-2025-02b.
Dussaillant, I., Hugonnet, R., Huss, M., Berthier, E., Bannwart, J., Paul, F., and Zemp, M. (2025): Annual mass change of the world’s glaciers from 1976 to 2024 by temporal downscaling of satellite data with in-situ observations. Earth System Science Data 17(5): 1977-2006, https://essd.copernicus.org/articles/17/1977/2025/.
Expert User Guidance
The following was contributed by Dr. Mauri S. Pelto, August, 2025:
How is glacier mass balance measured?
Changes in glacier mass balance is quantified by meters water equivalent (m w.e.). This unit represents the mass gained or lost by the glacier if all snow and ice was melted and spread evenly over the surface area of the glacier.
The three primary approaches to determining mass balance are glaciological, geodetic and gravimetric (Cogley et al., 2011). The glaciological method provides glacier-wide mass balance assessment derived from point measurements completed during seasonal or annual field campaigns, extrapolated to unmeasured areas of the glacier. Annual surface mass balance measures have focused on mapping the depth of retained annual snow cover across the glaciers, and the thickness of snow and ice ablated at the surface. The method is applied to a relatively small number of glaciers 110-140 glaciers due to logistical challenges (Zemp et al, 2015). The World Glacier Monitoring Service (WGMS) reference and benchmark glacier system provides a detailed examination of alpine glacier mass balance change from region to region around the world (WGMS, 2023). This system consists of 60 glaciers (Figure 2). The WGMS collects annual mass balance data derived from the glaciological approach, with 100-150 glaciers reporting annually (WGMS, 2023).
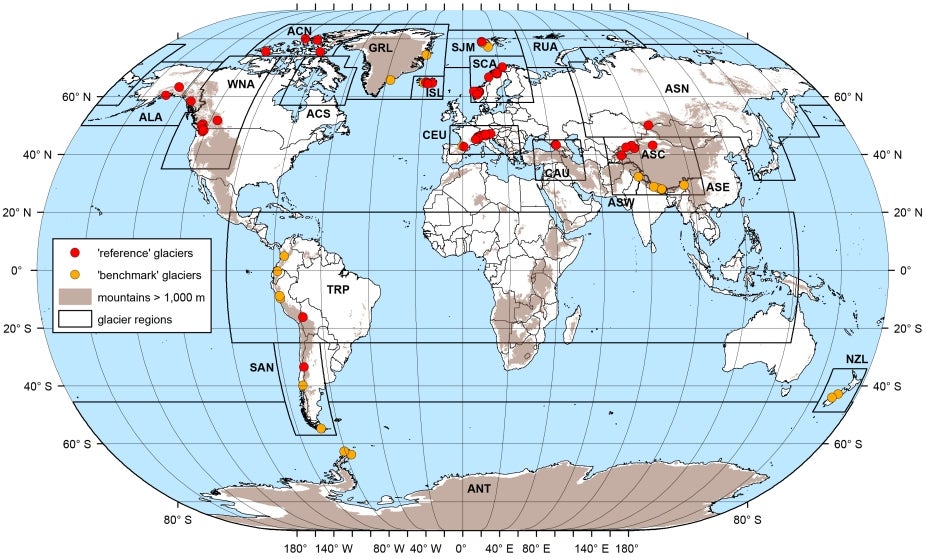
Figure 2: The World Glacier Monitoring Service Network of Reference glaciers.
Geodetic methods quantify glacier ice volume change by repeated mapping over multi-year to decadal periods (The GlaMBIE Team, 2025). Today there is sufficient imagery available to remap glacier surface elevations across most glaciers at sufficient time scale. This approach has not typically been used to assess annual mass balance. However, in recent years geodetic annual balance determinations have become possible.
Gravimetric mass balance is based on measuring changes in the gravitational field, that can be used at a regional level. The Gravity Recovery and Climate Experiment (GRACE) mission 2002-2017 is the most extensive of these surveys providing mass balance estimates at an annual level for a number of glaciated region but not for specific glaciers (Wouters et al 2019).
How do different estimates of glacier mass balance compare?
The 2024 WGMS dataset of submitted glaciological observations includes 142 glaciers from six continents and 27 nations, 140 with a negative balance and two with a positive balance. In 2024, the mean annual mass balance of the 58 global reference glaciers was –1.44 m w.e., and -1.36 m w.e. for all 142 reporting glaciers. This is a similar result to 2023 with mean reference glacier balance of -1.62 m w.e. and -1.35 m w.e. for all 116 reporting glaciers (Figure 5).
| Method | Global Mass Balance (Gt/yr) |
| Glaciological | -277 (2001-2020) |
| DEM | -267 ± 16 (2002-2020) |
| Altimetry | -272 ± 11 (2010-2020) |
| GRACE | -281 ± 30 (2002-2019) |
The 2024 regionalized global average of –1.30 m w.e. exceeds the previous most negative year in 2023, which had a regionalized global average of –1.25 m w.e. This makes 2024 the 37th consecutive year with a global alpine mass balance loss, the 15th consecutive year with a regionalized global mass balance below –0.5 m w.e.
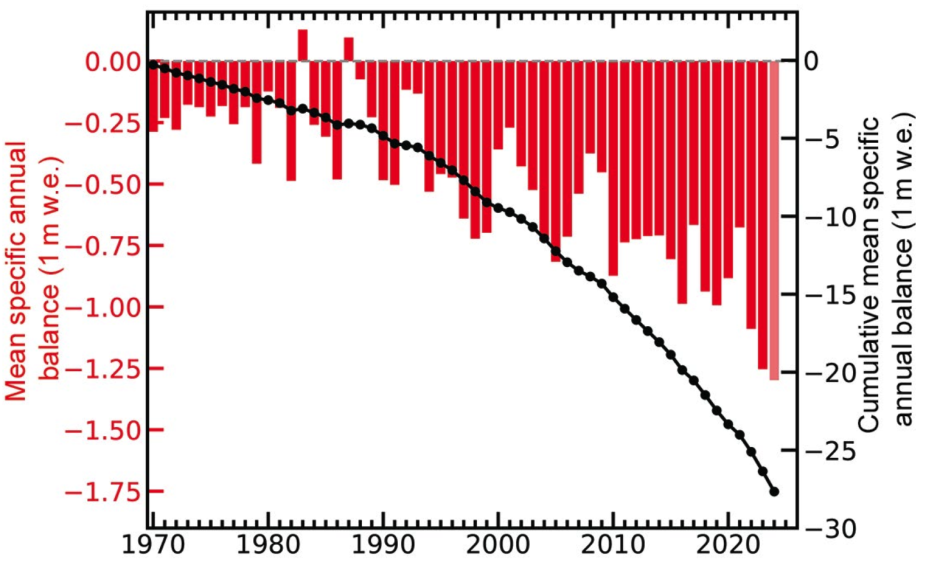
Figure 3: Global Alpine glacier annual mass balance record of reference glaciers submitted to the World Glacier Monitoring Service, with a minimum of 30 reporting glaciers. Global values are calculated using only one single value (averaged) for each of 19 mountain regions to avoid a bias to well observed regions.
M. Pelto
The simple mean mass balance of WGMS records has a slight negative bias compared to geodetic approaches, but this bias has been effectively eliminated with the regionalized approach now used by WGMS (WGMS, 2025). The 2000-2021 mean annual mass balance for this record is 270 Gt/yr.
Repeat Digital Elevation Models (DEMs) identified that glaciers lost 267 ± 16 Gt/yr during 2000-2019 with a mass loss acceleration of 48 ± 16 Gt/yr per decade (Hugennot et al. 2021). This repeat mapping identified that thinning rates of glaciers outside of ice sheet peripheries doubled over the last two decades, which is in line with the doubling of the annual mass balance change identified by WGMS (Hugennot et al 2021; WGMS, 2023).
In a separate global geodetic based assessment Jakob and Gourmelen (2023) used CryoSat-2 interferometric radar altimetry to determine that between 2010 and 2020, glaciers lost a total of 272 ± 11 Gt/yr of ice. They determined that 89% of the loss was from surface mass balance loss and 11% from calving.
Utilizing the full length of the reliable GRACE mission data, Wouters et al (2019) found that glaciers lost mass at a rate of 199 ± 32 Gt/yr from 2002-2016. Intercomparison identified that annual mass balances for 17 glacier regions showed a qualitatively good agreement with published estimates from in situ glaciological observations. Ciraci et al (2020) found for the 2002-2019 that GRACE and GRACE follow on missions an average mass balance loss of 281.5 ± 30 Gt/yr with an acceleration of 50 ± 20 Gt/yr per decade.
The remote sensing geodetic inventories, GRACE and field glaciological observations all provide comparable rates of mass loss and indicate that early 21st-century mass loss rates are historically unprecedented at a global scale (Zemp et al, 2015; GlaMBIE Team, 2025). The most recent intercomparison assessment identified global glaciers annually lost 273 ± 26 Gt/yr in mass from 2000-2023, with loss increasing 36% in the second half of this period (The GlaMBIE Team, 2025).
The number of reference glaciers is small compared to the total number of alpine glaciers (~200,000) in the world but has proven to be a good approximation of global alpine glacier change (WGMS, 2020).
The largest negative mass balances have occurred in one of the last two decades, which depends on the region (WGMS, 2020). The continued large negative annual balances reported indicate that glaciers are not approaching equilibrium (Pelto, 2010). The strong negative mass balance suggests that glaciers of many regions are committed to further volume loss even under current climatic conditions (Zemp et al, 2015). The mass balance challenge glaciers face is visually evident in the lack of retained snow cover on glaciers around the globe in recent years (Fig. 4, more in key figures below). The acceleration of mass balance loss is apparent regardless of datasets used to determine glaciological observations, geodetic observations, or gravimetric observations.

Figure 4: Mountain glaciers around the globe that lost nearly all snow cover in 2022. This illustrates the lack of retained accumulation leading to mass balance loss.
M. Pelto
How do I best access these data?
The most up-to-date data is accessible from the World Glacier Monitoring Service (WGMS) website. Here, you can find time series of individual glaciers as well as other analyses such as the intercomparisons and estimates of other glacier properties.
Cite this page
Acknowledgement of any material taken from or knowledge gained from this page is appreciated:
Pelto, Mauri & National Center for Atmospheric Research Staff (Eds). Last modified "The Climate Data Guide: Observations of Glacier Mass Balance: The World Glacier Monitoring Service.” Retrieved from https://climatedataguide.ucar.edu/climate-data/observations-glacier-mass-balance-world-glacier-monitoring-service on 2026-07-15.
Citation of datasets is separate and should be done according to the data providers' instructions. If known to us, data citation instructions are given in the Data Access section, above.
Acknowledgement of the Climate Data Guide project is also appreciated:
Schneider, D. P., C. Deser, J. Fasullo, and K. E. Trenberth, 2013: Climate Data Guide Spurs Discovery and Understanding. Eos Trans. AGU, 94, 121–122, https://doi.org/10.1002/2013eo130001
Key Figures

Figure 1: Accumulation (AC) and ablation zone (AB) on Lynch Glacier, Washington (2007).

Figure 2: The World Glacier Monitoring Service Network of Reference glaciers.

Figure 3: Global Alpine glacier annual mass balance record of reference glaciers submitted to the World Glacier Monitoring Service, with a minimum of 30 reporting glaciers. Global values are calculated using only one single value (averaged) for each of 19 mountain regions to avoid a bias to well observed regions.

Figure 4: Mountain glaciers around the globe that lost nearly all snow cover in 2022. This illustrates the lack of retained accumulation leading to mass balance loss.
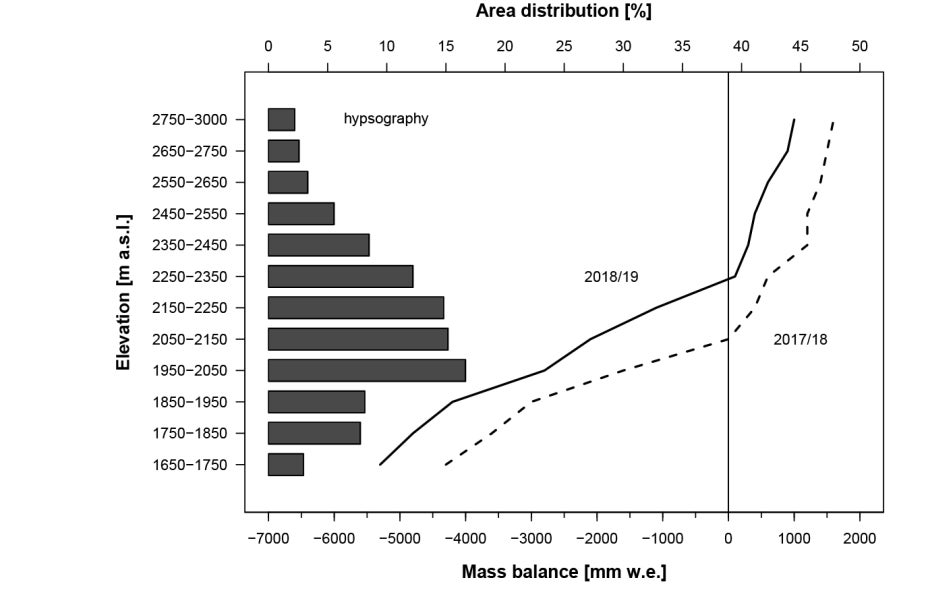
Hypsometry and mass balance gradient of Easton Glacier in 2018 and 2019. Each Reference glacier provides this information every year.

Mass balance maps and measurement network for Easton Glacier in 2018 and 2019.
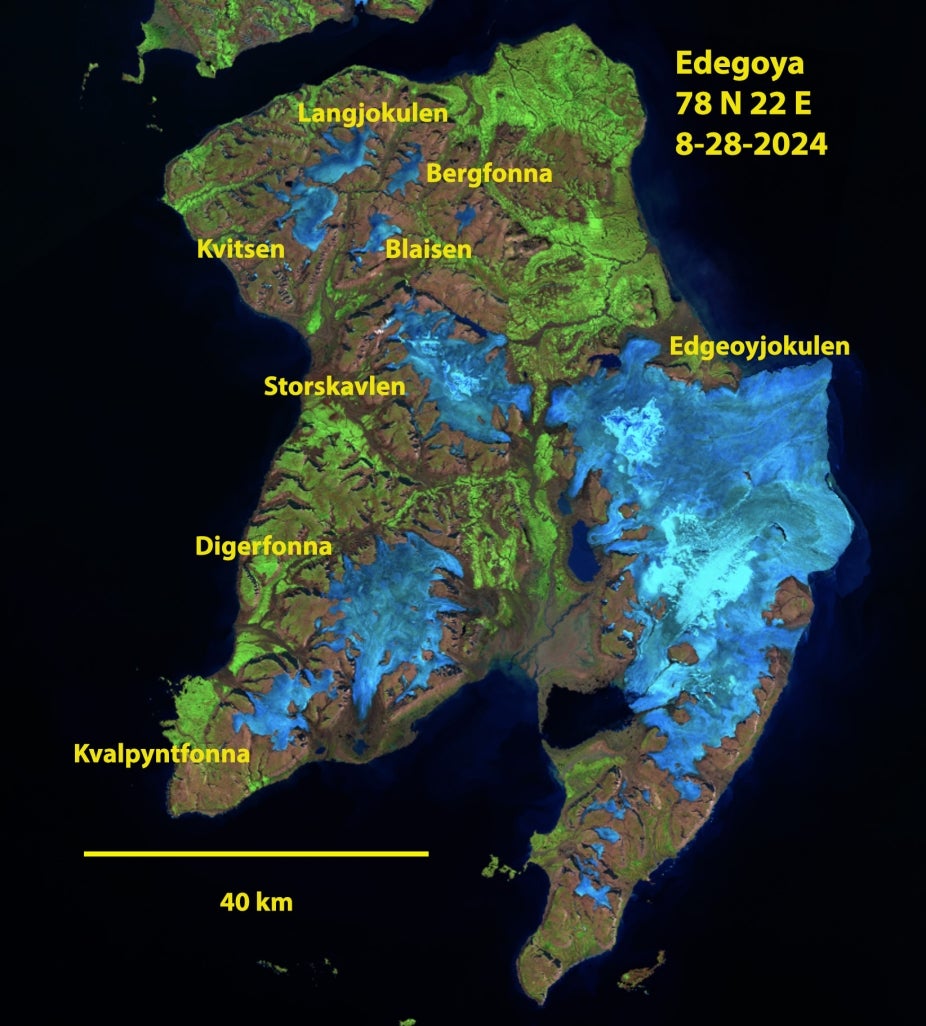
Snow free ice caps on Edgeoya Island Svalbard in Sentinel imagery from August 28, 2024. Glaciers across Svalbard were largely snow free leading to consistent mass balance losses exceeding -1.25 m w.e.
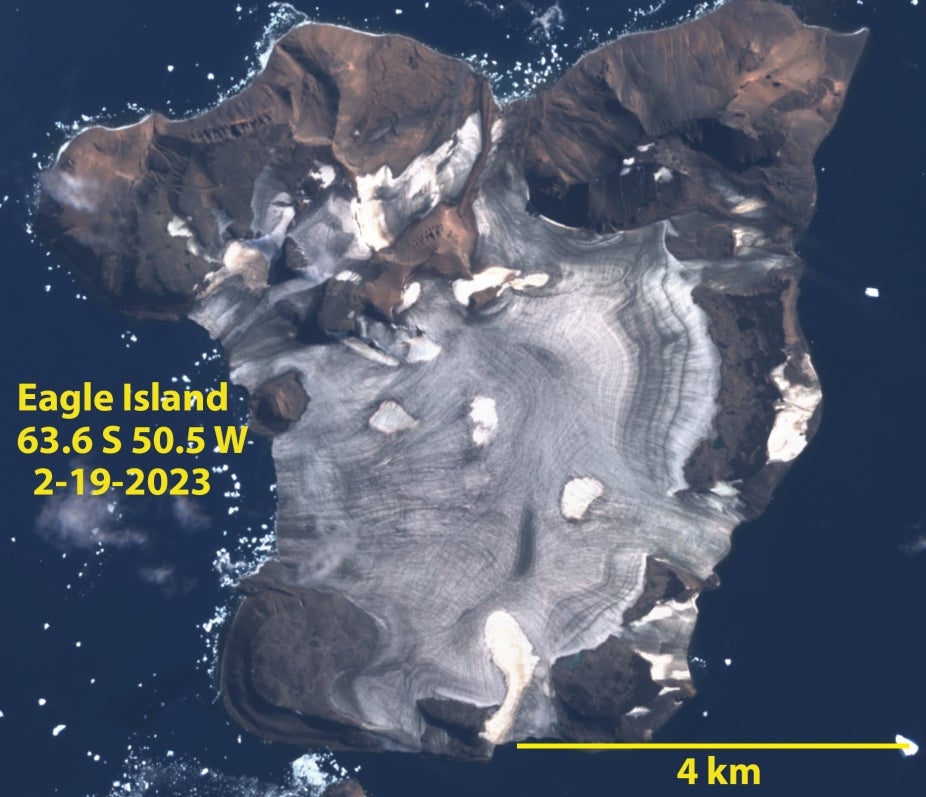
Eagle Island Ice Cap, Antarctica in Sentinel image from summer 2023, with almost no snow cover. These conditions also occurred in 2020 and 2024.