Snow Cover Extent (Northern Hemisphere) Climate Data Record, by Rutgers

Key Strengths
Key Limitations
Expert Developer Guidance
The following was contributed by David Robinson and Thomas W. Estilow, Rutgers University (August 2013):
The data record for the Rutgers University (RU) Northern Hemisphere (NH) Snow Cover Extent (SCE) Climate Data Record (CDR) spans from late 1966 to present. Data prior to June 1999 in the RU NH SCE CDR is based on digitized weekly SCE maps originally created at the National Oceanic and Atmospheric Administration (NOAA) and previously reprocessed at Rutgers. Early NH SCE maps were based on a visual interpretation of photographic copies of shortwave imagery. Analysts incorporated various sources of imagery into the SCE mapping process as they became available (e.g. AVHRR, VAS). In June 1999, weekly NOAA NH SCE maps ceased production, and were replaced by daily SCE output from the Interactive Multisensor Snow and Ice Mapping System (IMS). IMS maps are presently generated at the National Ice Center (NIC) in a manner similar to the former weekly product, but may also include sources of information from stations and satellite microwave products. They also benefit from an improved computer-based mapping toolbox to assist in discerning more local SCE details. To facilitate ongoing updates to the data record, Monday SCE output from the 24 km IMS is acquired from NIC and processed at Rutgers University to generate weekly granules.
Each weekly NH SCE granule represents SCE for seven days spanning from Tuesday-Monday, starting from the beginning of the record on Tuesday October 4, 1966. The NH SCE CDR shows snow boundaries on the last day that the surface in a given region is observed (figure 1). Independent analyses, standard mapping practices, and detailed discussions over the years with members of the mapping team indicate that the SCE depicted on pre-IMS era weekly maps is heavily weighted toward the end of the map week.
Weekly SCE maps were digitized utilizing an 89 × 89 Cartesian grid laid over a NH polar stereographic projection. Grid cell areas range from ~10,700 sq. km near the equator to ~41,800 sq. km near the pole, with a resolution of ~190.5 km at a standard parallel of 60 degrees. Each grid cell in the NH SCE CDR has a binary value, indicating snow covered or snow free conditions. As determined at Rutgers, IMS SCE output best matches the historical weekly product when reduced in resolution using a 42% threshold for SCE. Since June 1999, IMS SCE data are reduced to match the historical 89 × 89 grid using a consistent land/water mask, forming a cohesive, long-term CDR.
The RU NH SCE CDR is reliable at many times and in many regions. These include regions where: 1) skies are frequently clear, a condition commonly found in spring near the snowline, 2) solar zenith angles are relatively low and illumination is high, 3) the snow cover is reasonably stable or changes slowly, and 4) pronounced local and regional signatures are present owing to the distribution of vegetation, lakes and rivers. Under these conditions, the satellite-derived product will be superior to maps of SCE gleaned from station data, particularly in sparsely inhabited regions. Another advantage of the NH SCE CDR is the portrayal of regionally representative snow extent, whereas maps based on ground station reports may be biased, due to the preferred position of weather stations in valleys and in places affected by urban heat islands, such as airports.
The RU NH SCE CDR has the longest period of record of any satellite-derived environmental observation. However, one trade-off is coarse spatial resolution, which means the product is most suitable for continental-scale and large regional climate studies. As human analysts have produced the CDR from visible satellite imagery for almost five decades, changes in mapping methodologies have occurred over time. Efforts have been made at Rutgers to mitigate the effects of mapping changes during production of the historical data, and to enhance consistency during the transition to IMS. Still, there are known inconsistencies over the Tibetan plateau. This is largely due to difficulties in mapping SCE in this area using visible satellite imagery due to snow cover often being patchy in nature and resembling the appearance of frequent cloud cover in the region. Issues with mapping snow in this region using microwave satellite products are well known and station coverage is exceedingly sparse. Later in the satellite record, higher resolution imagery collected at a higher frequency from multiple sources (particularly animated imagery) has improved mapping in the region.
So too has the IMS product reduced earlier issues with defining snow extent in regions where mountains commonly align in a linear or curvilinear manner (e.g. Sierra Nevada, Himalayas, Alps), The major issue in these regions had to do with the digitization process, as often cells would be considered snow covered despite the narrow snow covered mountains comprising less than 50% of an otherwise snow free cell. The higher spatial resolution of the IMS grid provides a more realistic depiction of SCE. The Rutgers CDR effort has taken the earlier over mapping of SCE into account and adjusted earlier gridded maps accordingly.
Despite the recent development of the more consistent RU NH SCE CDR, users are warned not to over interpret the data in both spatial and temporal senses. For instance, analyses are not recommended on a grid cell dimension, or even over several grid cells, including within non-mountainous regions. Temporally, a user should not conduct an evaluation that examines one or several grid cells over time, be it over the course of a given year and especially over years within such a small area. For instance, do not expect to see a meaningful time series of SCE over several grid cells that encompass the Alps.
Over the years there have been attempts to characterize the uncertainty inherent in the weekly snow cover maps. This has mostly included regional case studies that utilized relatively dense arrays of station observations or independent mapping undertaken with visible imagery. Brown and Robinson (2011) conducted the most recent and comprehensive analysis, where estimates of uncertainty were explicitly derived through the statistical analysis of multiple datasets. The analysis indicates a 95% confidence interval in Northern Hemisphere spring SCE of ±3–5%. The multi-dataset analysis shows larger uncertainties monitoring spring SCE over Eurasia than North America due to the more complex regional character of the snow cover variability and larger between-dataset variability over northern Europe and north-central Russia.
The NOAA maps and thus the RU NH SCE CDR are unique in terms of their hemispheric scale, longevity and relative accuracy. There are other hemispheric products generated from satellite microwave data. However, at best, they extend back to 1979 and do not to depict snow extent as completely as visible products due to difficulties in discerning wet, patchy or thin snow cover. There are products produced from NASA MODIS visible data using automated methods. While maps are generated in a systematic manner, conservative cloud detection makes daily maps rather incomplete and multi-day products still depict incomplete coverage. There are also maps generated from combinations of imagery and station observations, however they lack long-term coverage or consistency or are not hemispheric in coverage. Despite the limitations of each mapping approach, including the NOAA/Rutgers CDR, the various map products complement one another. A fused multi-source snow data product is currently being created and will soon be available through the National Snow and Ice Data Center.
Research applications utilizing the RU NH SCE CDR include studies focusing on relationships between snow cover and the hydrologic system, atmospheric dynamics, and sea ice. Seasonal cycle analyses, forced model simulations, and model intercomparison/validation efforts employ the SCE CDR. These data have also been used to initialize weather prediction models, estimate snow melt runoff, analyze surface albedo and for numerous additional studies conducted at research centers throughout the world. Maps are also used in an operational mode, in particular through the initialization of weather forecast models. The RU NH SCE CDR is available in several formats, making it rather straightforward to utilize in comparative studies utilizing model output.##
Cite this page
Acknowledgement of any material taken from or knowledge gained from this page is appreciated:
Estilow, Thomas W. &, Robinson, David & National Center for Atmospheric Research Staff (Eds). Last modified "The Climate Data Guide: Snow Cover Extent (Northern Hemisphere) Climate Data Record, by Rutgers.” Retrieved from https://climatedataguide.ucar.edu/climate-data/snow-cover-extent-northern-hemisphere-climate-data-record-rutgers on 2026-02-26.
Citation of datasets is separate and should be done according to the data providers' instructions. If known to us, data citation instructions are given in the Data Access section, above.
Acknowledgement of the Climate Data Guide project is also appreciated:
Schneider, D. P., C. Deser, J. Fasullo, and K. E. Trenberth, 2013: Climate Data Guide Spurs Discovery and Understanding. Eos Trans. AGU, 94, 121–122, https://doi.org/10.1002/2013eo130001
Key Figures
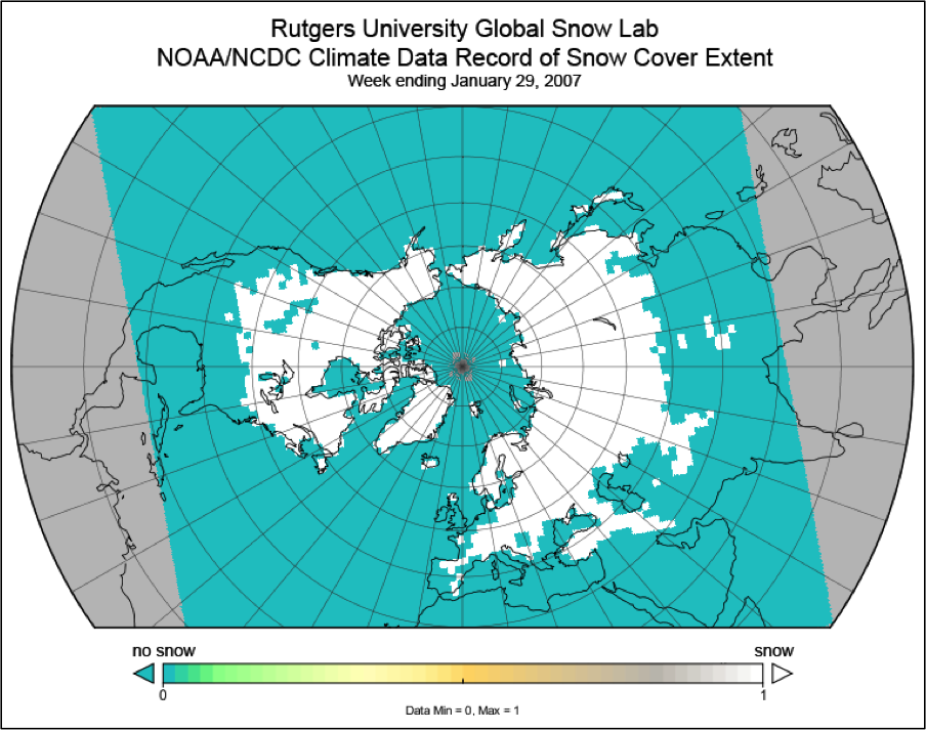
Nh Snow Cover Extent for week ending January 29, 2007. Credit: Figure Contributed by D. Robinson.
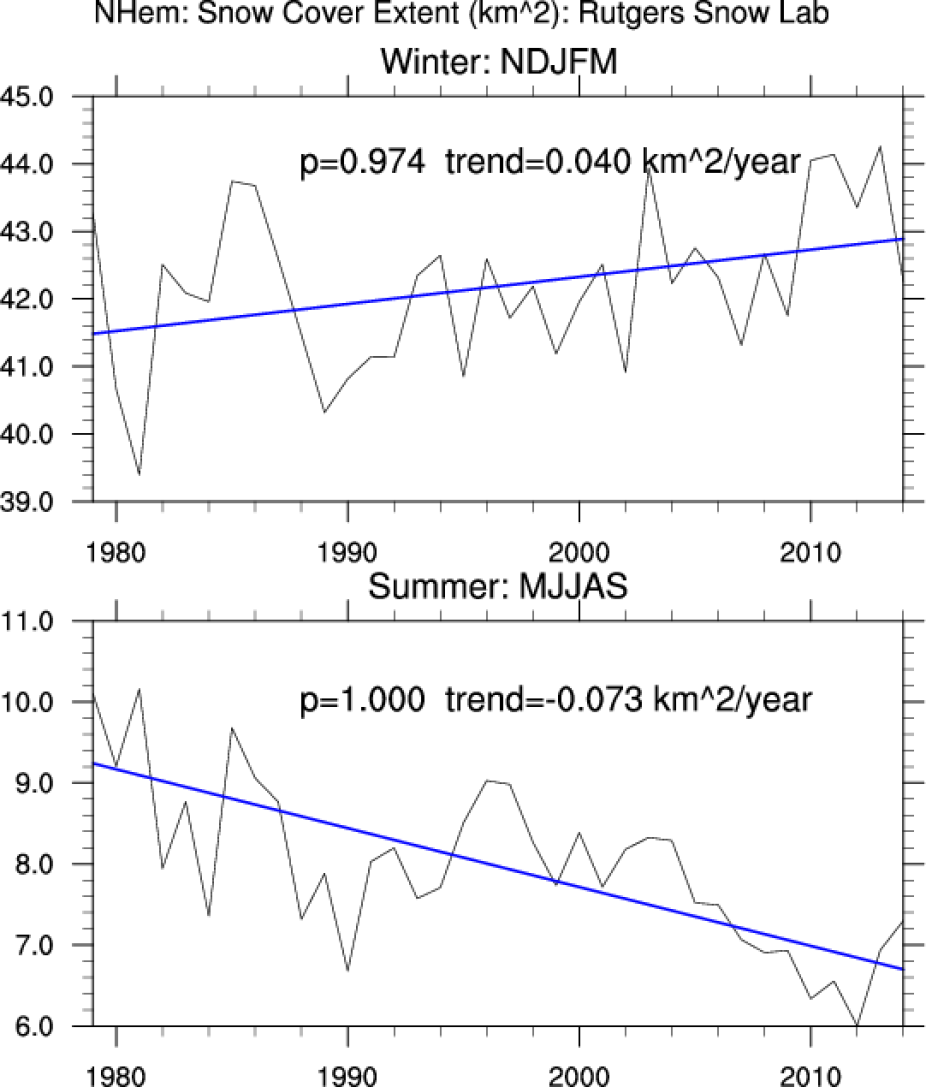
Trend significance via the Mann-Kendall test and Theil-Sen robust estimates of linear trend for 1979-2014 for N. Hemisphere snow extent. (D. Shea; Climate Data Guide)