NASA MERRA
The Modern Era Retrospective-Analysis for Research and Applications (MERRA) was undertaken by NASA’s Global Modeling and Assimilation Office with two primary objectives: to place observations from NASA’s Earth Observing System satellites into a climate context and to improve upon the hydrologic cycle represented in earlier generations of reanalyses. MERRA was generated with version 5.2.0 of the Goddard Earth Observing System (GEOS) atmospheric model and data assimilation system (DAS), and covers the modern satellite era from 1979 to the present. Specifically, the GEOS-DAS Version 5 implements Incremental Analysis Updates (IAU) to slowly adjust the model states toward the observed state.
The original MERRA has been replaced by MERRA-2.
Key Strengths
Significant improvement in precipitation and water vapor climatology over older reanalyses
The IAU procedure in which the analysis correction is applied to the forecast model gradually ameliorates precipitation spin-down during early stages of the forecast, and allows for higher frequency output including selected hourly fields
Provides vertical integrals and analysis increment fields for the closure of atmospheric budgets
Key Limitations
Changes in the observing system strongly affect trends in many fields (as for other reanalyses); for example P-E exhibits spurious increases associated with assimilating radiances from the AMSU starting in 1998 and to a lesser extent, SSM/I in 1987
Spatial discontinuity in central African moisture fields associated with rawinsonde input
The assimilation routine is “frozen” and will not be updated for newer satellite instruments, so quality will eventually degrade as current instruments expire
Research
Expert Developer Guidance
The summary information was written with help from Richard Cullather. Any errors are ours.
Cite this page
Acknowledgement of any material taken from or knowledge gained from this page is appreciated:
National Center for Atmospheric Research Staff (Eds). Last modified "The Climate Data Guide: NASA MERRA.” Retrieved from https://climatedataguide.ucar.edu/climate-data/nasa-merra on 2026-06-30.
Citation of datasets is separate and should be done according to the data providers' instructions. If known to us, data citation instructions are given in the Data Access section, above.
Acknowledgement of the Climate Data Guide project is also appreciated:
Schneider, D. P., C. Deser, J. Fasullo, and K. E. Trenberth, 2013: Climate Data Guide Spurs Discovery and Understanding. Eos Trans. AGU, 94, 121–122, https://doi.org/10.1002/2013eo130001
Key Figures
Taylor diagrams of annual mean precipitation from reanalyses using GPCP and CMAP as observing references. Red and blue lines show limits of expected high and low correlation determined by comparing GPCP and CMAP. From Bosilovich et al. (2011) and contributed by R. Cullather.

Climatological (1989-2010) total water vapor for January and July. [Climate Data Guide; D. Shea]

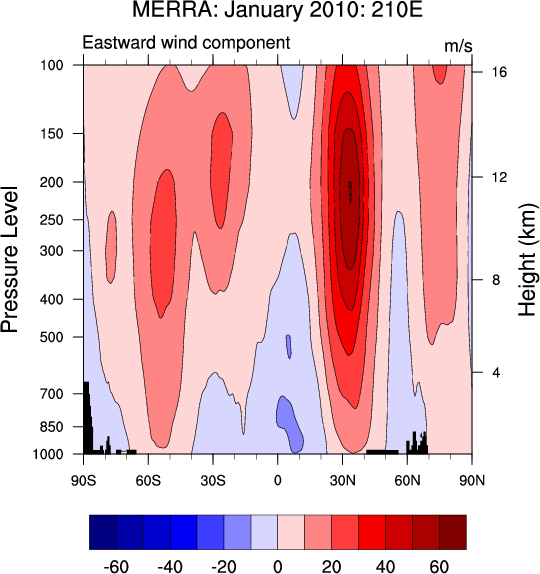
Latitude-pressure cross section of mean zonal wind at 210E for January 2010. The black filled areas indicate topography. [Climate Data Guide; D. Shea]

Longitude-pressure cross section of mean meridional wind at 45N for January 2010. The black filled areas indicate topography. [Climate Data Guide; D. Shea]
Other Information
- Rienecker, Michele M., and Coauthors, 2011: MERRA: NASA’s Modern-Era Retrospective Analysis for Research and Applications. J. Climate, 24, 3624–3648.
- J. Climate Special Collection on MERRA: comprehensive assessment
- Trenberth, K. E., J. T. Fasullo, and J. Mackaro, 2011: Atmospheric moisture transports from ocean to land and global energy flows in reanalyses
- Bosilovich, M.G., F.R. Robertson and J. Chen, 2011: Global Energy and Water Budgets in MERRA, Accepted to the Journal of Climate
- Bosilovich, M. G., J. Chen, F. R. Robertson and R. F. Adler, 2008: Evaluation of Global Precipitation in Reanalyses. J. Appl. Meteor and Climate 47, 2279-2299
- Cullather, Richard I., Michael G. Bosilovich, 2011: The Moisture Budget of the Polar Atmosphere in MERRA. J. Climate, 24, 2861–2879
- Robertson, F. R., M. G. Bosilovich, J. Chen and T. L. Miller 2011: The effect of satellite observing system changes on MERRA water and energy fluxes. J. Climate, 24, 5197–5217