Arctic System Reanalysis (ASR)
The Arctic System Reanalysis is a multi-agency, university-led retrospective analysis (reanalysis) of the Greater Arctic. ASR is produced using high-resolution versions of the Polar Weather Forecast Model (PWRF) and the WRF-VAR and High Resolution Land Data Assimilation (HRLDAS) data assimilation systems that have been optimized for the Arctic. ASR is a comprehensive integration of the regional climate of the Arctic, currently for the period 2000-2012, with two versions: ASRv1 – 30 km and ASRv2 – 15 km; both are available through the NCAR Research Data Archive. Both versions have 29 pressure levels (71 model levels), 27 surface and 10 upper air analysis variables, 74 surface and 16 upper air forecast variables, and 3 soil variables. Both the u- and v- winds relative to grid and relative to earth are present in the final version.
New features in ASRv2 compared to ASRv1 are higher horizontal resolution, updated model physics including sub-grid scale cloud fraction interaction with radiation, and a dual outer loop routine for more accurate data assimilation. Surface and pressure level products are available at 3-hourly and monthly-mean timescales. ASRv2 will be updated through 2016, then re-assimilated (2000-2016) using the most recent version of Polar WRF and WRFDA (3.9.1). This newer version, ASRv2.1, should be available starting in mid-2018 and will be kept up-to-date through 2020 with a delay of ~3 months. [text credit: Aaron Wilson and David Bromwich]
Key Strengths
Key Limitations
ASRv1: : Bromwich, D., L. Bai, K. Hines, S. Wang, Z. Liu, H. Lin, Y. Kuo, and M. Barlage. 2012. Arctic System Reanalysis (ASR) Project. Research Data Archive at the National Center for Atmospheric Research, Computational and Information Systems Laboratory. https://doi.org/10.5065/D6K072B5. Accessed† dd mmm yyyy.
ASRv2: National Center for Atmospheric Research/University Corporation for Atmospheric Research, and Polar Meteorology Group/Byrd Polar Research Center/The Ohio State University. 2017. Arctic System Reanalysis version 2. Research Data Archive at the National Center for Atmospheric Research, Computational and Information Systems Laboratory. http://rda.ucar.edu/datasets/ds631.1/. Accessed† dd mmm yyyy.
Cite this page
Acknowledgement of any material taken from or knowledge gained from this page is appreciated:
National Center for Atmospheric Research Staff (Eds). Last modified "The Climate Data Guide: Arctic System Reanalysis (ASR).” Retrieved from https://climatedataguide.ucar.edu/climate-data/arctic-system-reanalysis-asr on 2026-02-14.
Citation of datasets is separate and should be done according to the data providers' instructions. If known to us, data citation instructions are given in the Data Access section, above.
Acknowledgement of the Climate Data Guide project is also appreciated:
Schneider, D. P., C. Deser, J. Fasullo, and K. E. Trenberth, 2013: Climate Data Guide Spurs Discovery and Understanding. Eos Trans. AGU, 94, 121–122, https://doi.org/10.1002/2013eo130001
Key Figures
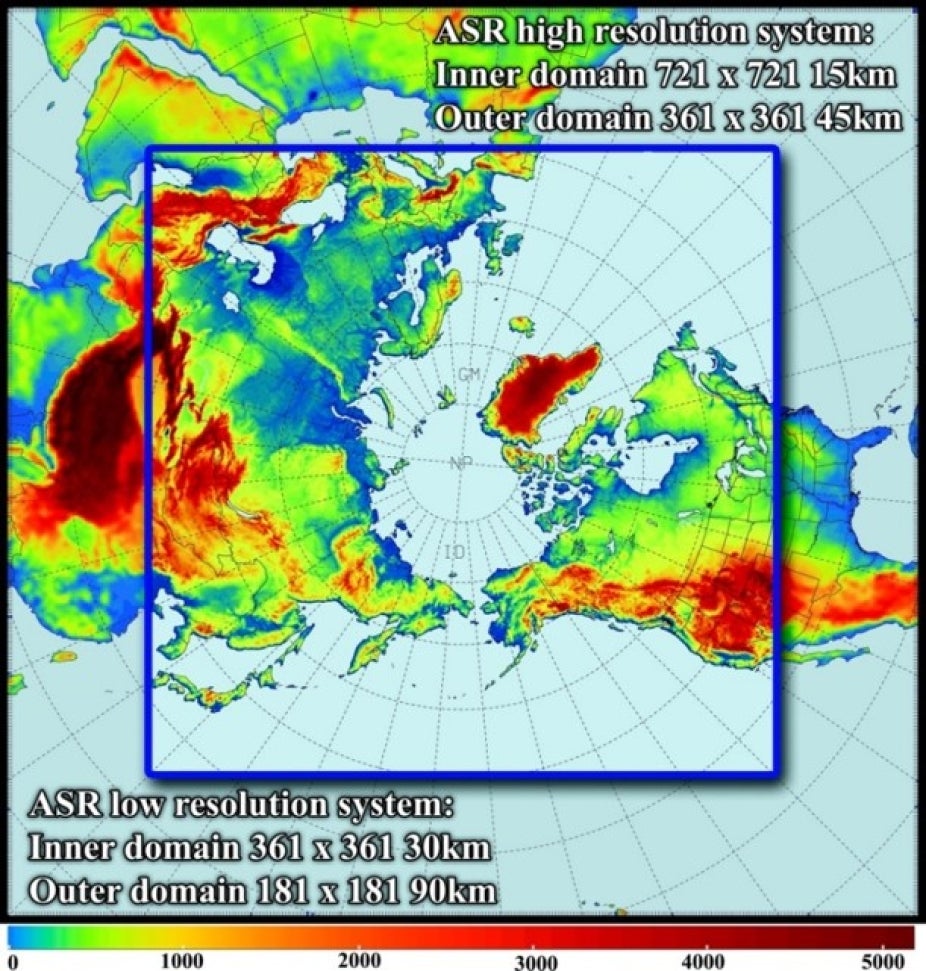
Figure 1: ASR inner and outer domains with terrain height (shaded). The number of grid points in each direction and horizontal resolution are provided in the top-right (lower-left corner) for ASRv2 (ASRv1). (contributed by A. Wilson)

Figure 2: Comparison showing left) ASRv2 mean 700 hPa relative humidity (%) and right) difference (%) between ASRv2 and ERAI for the period December 2006 – November 2007. Where the 700 hPa pressure level exists below ground based on the annual average surface pressure have been masked in gray. (contributed by A. Wilson)
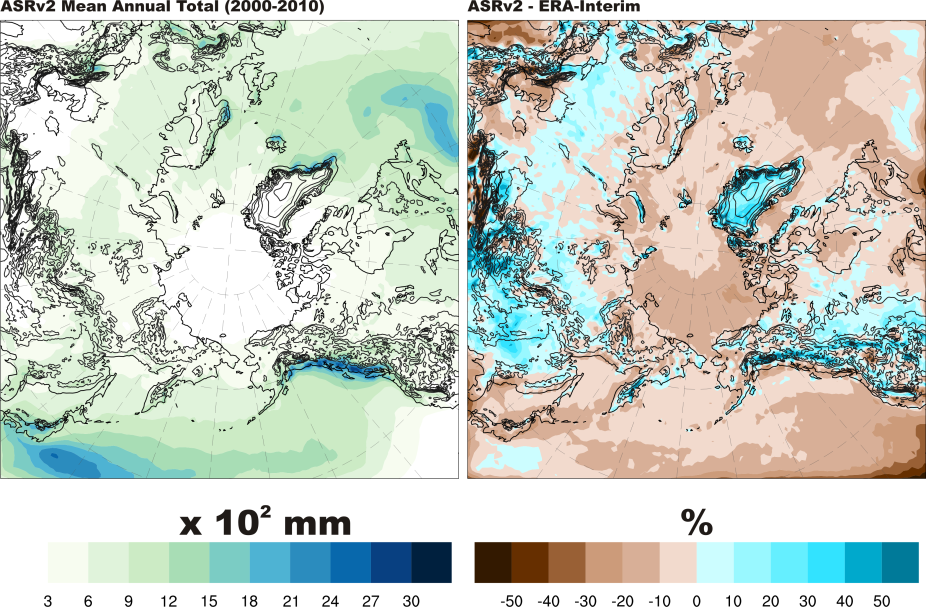
Figure 3: left) ASRv2 mean annual total precipitation (x 102 mm) and right) difference (%) between ASRv2 and ERAI for the period 2000-2010. (contributed by A. Wilson)
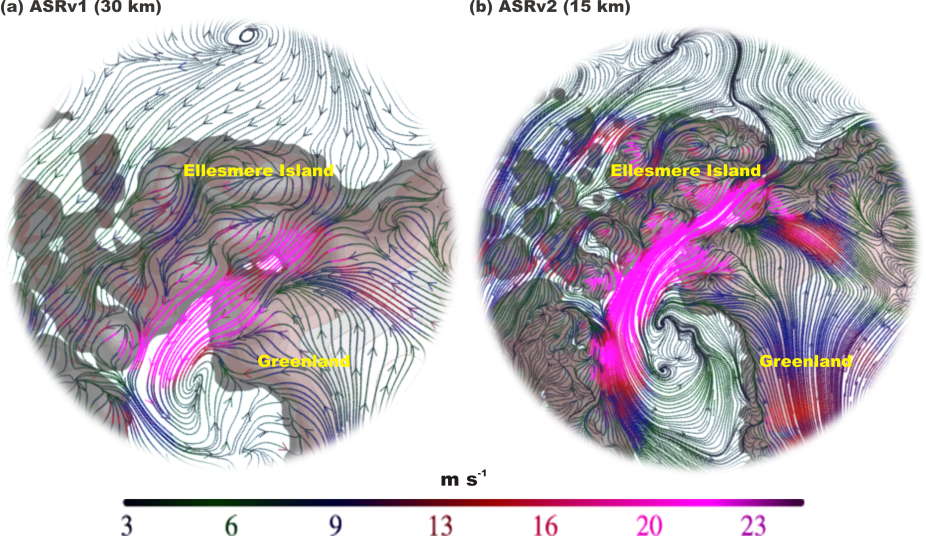
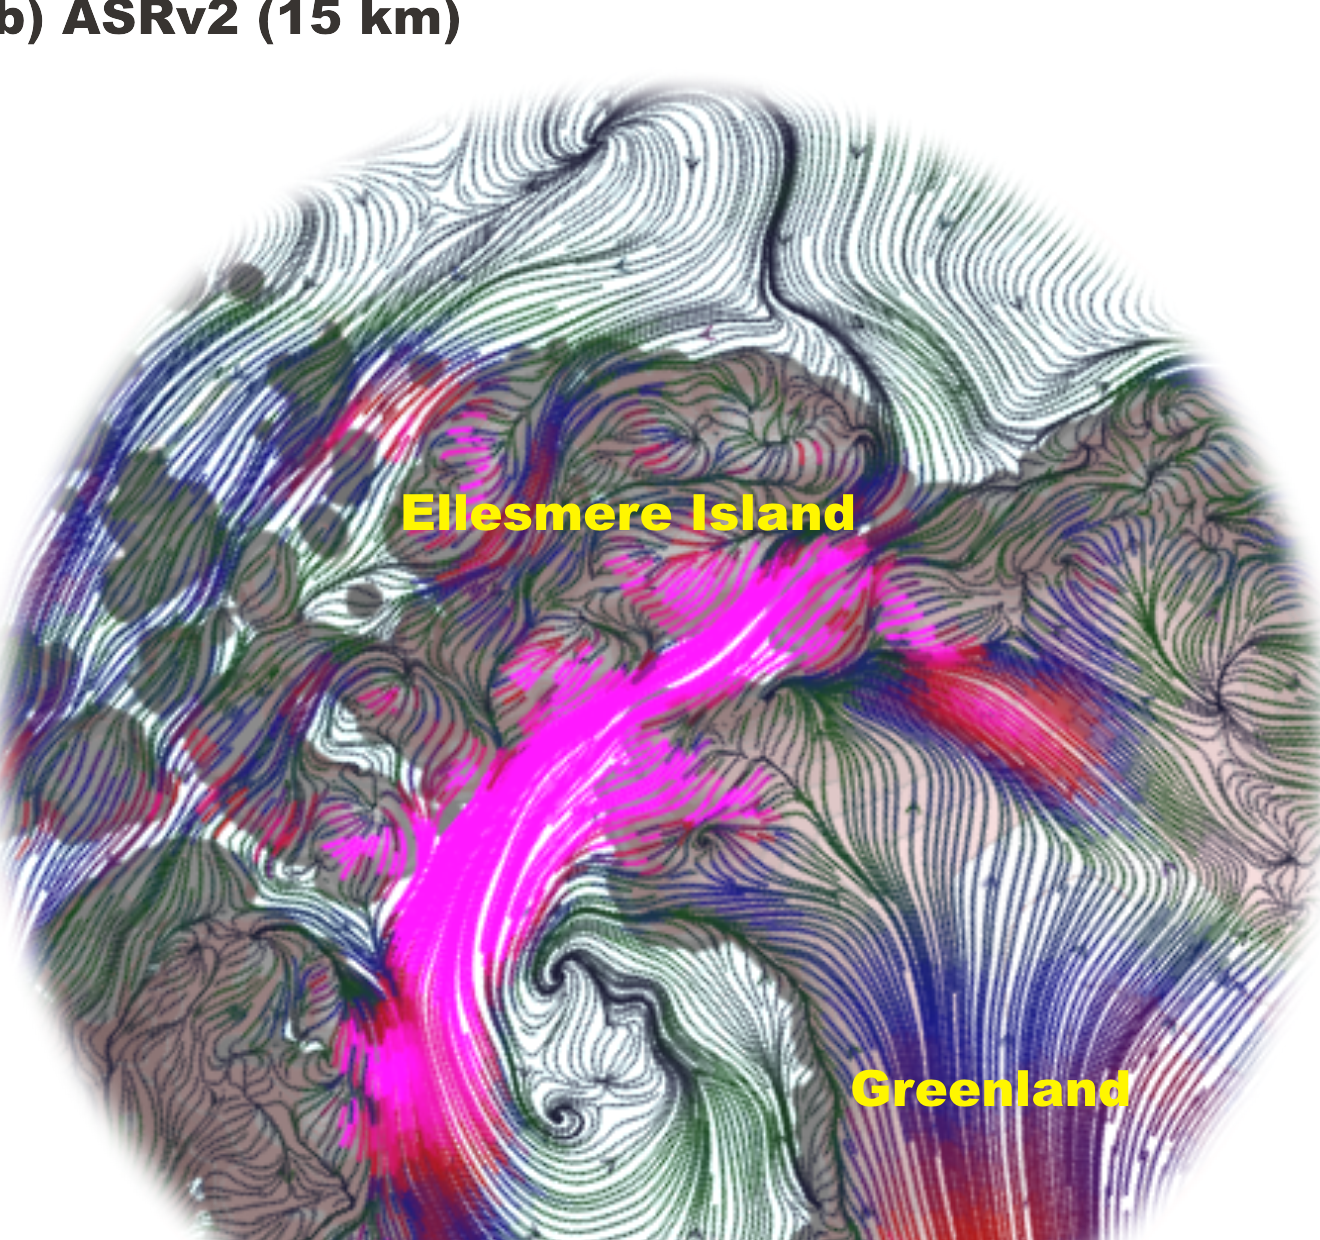
Figure 4: Streamlines and wind speeds (colors) at 10-m for an intense orographically channeled wind event in Nares Strait on 9 February 2007 as captured by a) ASRv1 and b) ASRv2. Orographic channeling in Nares Strait may help generate persistent winter North Water polynya. ASRv2 resolves the orography of Nares Strait and thus the winds are much stronger (> 20 m s-1 ) and more continuous than ASRv1 (~15 m s-1). The katabatic winds over Greenland feed into the wind flow at two locations in ASRv2. There are multiple centers in the low over Baffin Bay in ASRv2 compared to the single center in ASRv1. (contributed by A. Wilson)
Other Information
- Bromwich, D. H., A. B. Wilson, L. Bai, G. W. K. Moore, and P. Bauer, 2016: A comparison of the regional Arctic System Reanalysis and the global ERA-Interim Reanalysis for the Arctic. Q. J. R. Meteorol. Soc., 142, 644-658, doi: 10.1002/qj.2527.
- Bromwich, D., Y.-H. Kuo, M. Serreze, J. Walsh, L.S. Bai, M. Barlage, K. Hines, and A, Slater, 2010: Arctic System Reanalysis: Call for community involvement. EOS Trans. AGU, 91, 13-14.
- Bromwich, D. H., K. M. Hines, and L.-S. Bai, 2009: Development and testing of Polar WRF: 2. Arctic Ocean. J. Geophys. Res., 114, D08122, doi:10.1029/2008JD010300.
- Hines, K. M., D. H. Bromwich, L.-S. Bai, M. Barlage, and A. G. Slater, 2011: Development and testing of Polar WRF. Part III. Arctic land. J. Climate, 24, 26-48, doi:10.1175/2010JCLI3460.1.
- Hines, K. M., and D. H. Bromwich, 2008: Development and Testing of Polar WRF. Part I. Greenland Ice Sheet Meteorology. Mon. Wea. Rev., 136, 1971-1989, doi: 10.1175/2007MWR2112.1.
- Kohnemann, S. H. E., G. Heinemann, D. H. Bromwich, and O. Gutjahr, 2017: Extreme warming in the Kara Sea and Barents Sea during the winter period 2000-2016. J. Clim., 30, 8913-8927, doi: 10.1175/JCLI-D-16-0693.1
- Kolstad, E. W., 2017: Higher ocean wind speeds during marine cold air outbreaks. Q. J. R. Meteorol. Soc., 143, 2084-2092, doi: 10.1002/qj.23068.
- Moore, G. W. K., D. H. Bromwich, A. B. Wilson, I. Renfrew, and L. Bai, 2016: Arctic System Reanalysis improvements in topographically-forced winds near Greenland. Q. J. R. Meteorol. Soc., 142, 2033-2045, doi: 10.1002/qj.2798
- Moore, G. W. K., I. A. Renfrew, B. E. Harden, and S. H. Nernild, 2015: The impact of resolution on the representation of southeast Greenland barrier winds and katabatic flows. Geophys. Res. Letts., 42, doi: 10.1002/2015GL063550.
- Moore, G. W. K., 2014: A new look at Southeast Greenland barrier winds and katabatic flow. US CLIVAR Variations Newsletter, 12, No. 2, 13-19.
- Moore, G. W. K., 2013: The Novaya Zemlya Bora and its impact on Barents Sea air-sea interaction. Geophys. Res. Letts., 40, 3462-3467, doi: 10.1002/grl.50641.
- Rampal, P., S. Bouillon, E. Ólason, and M. Morlighem, 2015: neXtSIM: a new Lagrangian sea ice model, The Cryosphere Discuss., 9, 5885-5941, doi:10.5194/tcd-9-5885-2015.
- Smirnova, J., and P. Golubkin, 2017: Comparing polar lows in atmospheric reanalyses: Arctic System Reanalysis versus ERA-Interim. Mon. Wea. Rev., 145, 2375-2383, doi: 10.1175/MWR-D-16-0333.1
- Tilinina, N., S. K. Gulev, and D. H. Bromwich, 2014: New view of Arctic cyclone activity from the Arctic System Reanalysis. Geophys. Res. Letts., 41, doi: 10.1002/2013gl058924.
- Tuononen, M., V. A. Sinclair, and T. Vihma, 2015: A climatology of low-level jets in the mid-latituesand polar regions of the Northern Hemisphere. Atmos. Sci. Let., 16, 492-499, doi: 10.1002/asl.587.
- Wesslén C. et al (2014): The Arctic summer atmosphere: An evaluation of reanalyses using ASCOS data. Atmos. Chem. Phys., 14, 2605-2624
- Wilson, A. B., D. H. Bromwich, K. M. Hines, 2012: Evaluation of Polar WRF forecasts on the Arctic System Reanalysis domain. 2. Atmospheric hydrologic cycle. J. Geophys. Res., 117, D04107, doi: 10.1029/2011JD016765.
- Wilson, A. B., D. H. Bromwich, K. M. Hines, 2011: Evaluation of Polar WRF forecasts on the Arctic System Reanalysis domain: Surface and upper air analysis. J. Geophys. Res., 116, D11112, doi: 10.1029/2010JD015013.