CAM6+DART Reanalysis and Surface Forcings
The CAM6+DART (Community Atmospheric Model version 6 + Data Assimilation Research Testbed) Reanalysis is an 80-member global atmospheric reanalysis with 6 hourly output from 2011-2020 on an approximately 1° lon-lat grid. This ensemble has two major features making it useful for model development and research. First, the 80 member ensemble is constructed to effectively span the atmospheric uncertainty remaining after assimilating observations. Second, the reanalysis provides all necessary variables to perform hindcast and data assimilation studies in each of the component models of the Community Earth System Model version 2 (CESM2). This reanalysis assimilates atmospheric observations of temperature, wind, and refractivity (a proxy for density) into the CAM6 atmospheric model using ensemble Kalman filter data assimilation.
Key Strengths
A large ensemble size of 80 allows for the provision of the ensemble mean ("best estimate") and standard deviation, which enables an assessment of observationally-constrained uncertainty.
The resulting 6-hourly atmospheric output has all necessary forcing variables for the CESM 2 and 3 component models, making further research that requires atmospheric forcing easy to implement.
The reanalysis also provides the data assimilation scheme's estimates of observational uncertainty, providing an additional tool to understand uncertainty.
The data set includes weekly restart file sets that are consistent with observations and can be used as hindcast initial conditions for the atmosphere, land, and sea ice.
Key Limitations
The CAM6+DART Reanalysis covers only 10 years (2011-2020). The CAM4+DART Reanalysis adds another previous decade, but is limited to the atmosphere-to-surface forcing files and the resolution is ~2 degrees, the underlying atmospheric model is different, and there is a discontinuity at the time boundary.
CESM2.1 (CAM6) was developed as a climate model, rather than a short-term forecast model, so it may be missing some features which other reanalyses use to improve their reanalyses of weather-scale atmospheric variability.
The number of observations assimilated is smaller than used by the operational centers. Variables assimilated are temperature and wind speed from radiosondes, aircraft, and satellites, as well as GPS radio occultation profiles of refractivity which provide an estimate of air density.
Raeder, K., Hoar, T.J., El Gharamti, M. et al. A new CAM6 + DART reanalysis with surface forcing from CAM6 to other CESM models.
Sci Rep 11, 16384 (2021). https://doi.org/10.1038/s41598-021-92927-0
Expert Developer Guidance
The following was submitted by Kevin Raeder, April, 2026:
What are the key strengths of this data set?
This reanalysis has unique characteristics, which can provide advantages for some applications:
- The ensemble size is larger than most (80).
- The primary product is 6-hourly ensemble of atmospheric forcing (fluxes) of the atmosphere on "surface" models such as the land, ocean, and sea ice. The files are in native CESM format, so that they can easily be applied to any surface model which is interfaced to the Community Earth System Model (CESM), both versions 2 and 3.
- In addition to the ensemble mean, which provides a "best guess" about the state of the atmosphere, which is the standard reanalysis product, it also provides objective uncertainty estimates in the form of the ensemble standard deviation. That varies with time, location, and model state variable, so it provides a wealth of information about the quality and usefulness for a researcher's application.
- While no land surface or sea ice observations were assimilated, the ensemble land and sea ice models were active and forced by the ensemble atmospheric forcing, so they are consistent with the actual weather (caveat the sea ice extent is specified by an external reanalysis).
- Another unique feature is the archive of the ensemble mean of model estimates of the observations. These are at the observation locations rather than at the model grid points. (The members’ estimates are included, but they are “inflated” values, which are crucial for good assimilation, but don’t represent the atmospheric state.)
What are the key limitations of this data set?
The general limitations of reanalyses apply, with a few specific limtations:
- The CAM6+DART Reanalysis (CESM’s Community Atmosphere Model + Data Assimilation Research Testbed) covers only 10 years (2011-2020).
- The CAM4+DART Reanalysis adds another previous decade, but the output is limited to the atmosphere-to-surface forcing files and the resolution is ~2 degrees. There is also a discontinuity at the time boundary between the 2 reanalyses, which should be evaluated for significance in the context of a research question.
- The set of variables is much smaller than most (operational) reanalyses, and varies with the frequency desired (6-hourly or weekly). For example, high resolution soil property data (e.g. vertical profiles of daily soil temperature and soil moisture) are available only weekly, which limits the utility for examining cross-boundary correlations for strongly-coupled DA diagnostics.
- The model resolution is ~1 degree with 32 layers in the vertical (up to ~3 hPa).
CESM2.1 (CAM6) was developed as a climate model, rather than a short-term forecast model, so it may be missing some features which other reanalyses use to improve their reanalyses. - The number of observations is smaller than used by the operational centers; ~3 million/day. These include observations of temperature and winds from radiosondes, aircraft, AIRS soundings, and satellites drift winds, and GPS radio occultation profiles of refractivity, Specific humidity observations and geopotential height observations were not assimilated, but were evaluated, so they can be used as "withheld" observations to evaluate the quality of the assimilations.
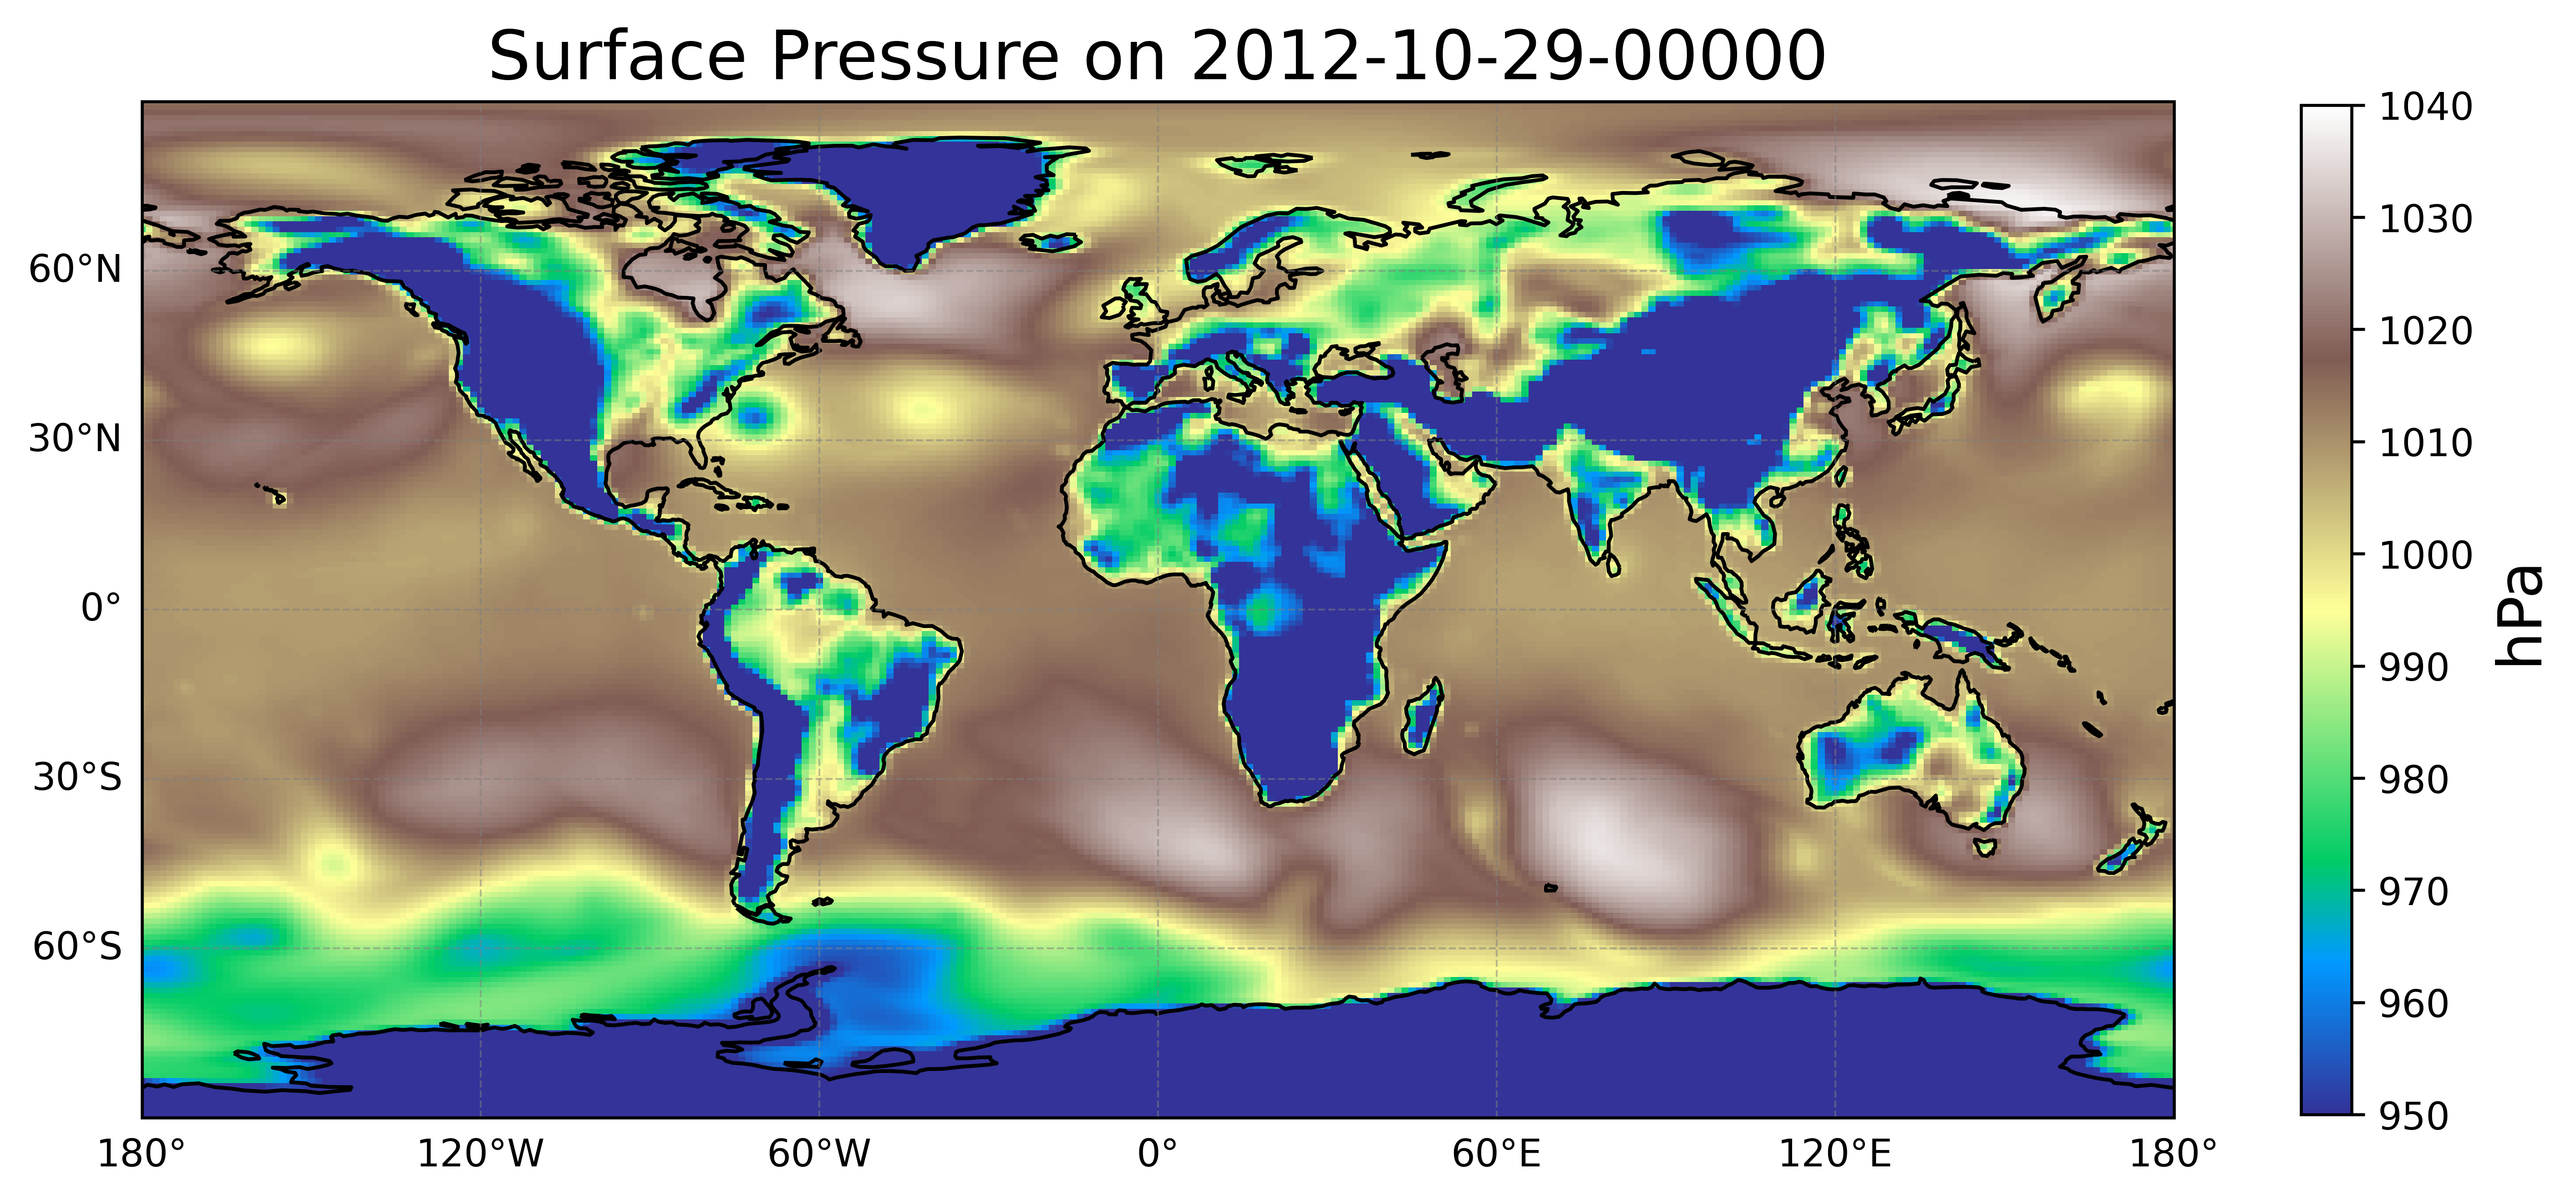
Despite these limitations, the quality of the reanalysis is generally good, especially for research that is not focused on fine details of the atmospheric states. For example, a 1-degree resolution atmospheric model doesn't fully resolve hurricanes, but the ensemble-mean surface pressure in the CAM6+DART Reanalysis' Hurricane Sandy shortly before landfall on the eastern coast of North America on 0Z 10/29/2012 has a value of 956.6 ± 3.4 hPa, compared with the observed value of 950 hPa. This is a reasonable match, especially as the 1 degree grid of the reanalysis provides an average over a large area whereas the observed measurement is at finer scale.
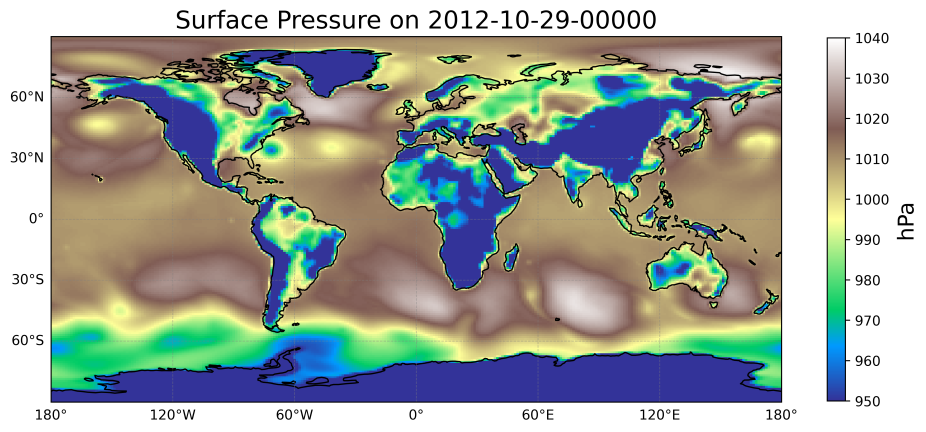
Figure 1: Ensemble mean surface pressure from the CAM6+DART reanalysis at 0Z 10/29/2021, shortly before Hurricane Sandy made landfall.
K. Raeder
What are the typical research applications of this data set?
The main use is in data assimilation (DA) experiments which use "surface" model components of CESM as the forecast model:
- CLM (Community Land Model)
- CTSM (Community Terrestrial Systems Model)
- POP (Parallel Ocean Program)
- MOM6 (Modular Ocean Model version 6)
- CICE (Community Ice CodE)
- and any others interfaced to CESM
Successful DA with these model components requires both realistic forcing from the atmosphere and variability in the forcing, as embodied in the ensemble. Instead of running the expensive ensemble of atmospheres in parallel with the surface model(s), the atmospheric forcing is archived and re-used as often as needed.
Because the active land and sea ice components were coupled to the atmospheric forcing there is the potential to diagnose cross boundary correlations (e.g. land-atmosphere interactions) for potential strongly-coupled DA applications.
There are complete "observation space" diagnostics, which reveal model biases relative to each observation type. These can be used to diagnose weak areas in the models, which should be the target of model development.
There are weekly ensembles of restart files for CAM6, CLM5, and CICE, which can be used to start CESM hindcasts from actual weather conditions on a date of interest. The atmospheric forcing data can be used as boundary conditions for the surface components in these hindcasts. The hindcasts can span time scales from hours to seasonal.
This reanalysis has a data set of 10^10 observations which are labeled with a variety of metadata, most importantly "whether the observation was assimilated", but also observation platform, location, time and the model estimate of the observation. This could be useful in machine learning and artificial intelligence training exercises.
What are the most common mistakes that users encounter when processing or interpreting these data?
In addition to the temperature bias described in the question about uncertainty, users have reported that surface quantities generated by CAM may not match observations well. Snow cover is one example. No observations of precipitation or moisture were assimilated into CAM6, so it was free to precipitate in a way that was consistent with the modeled dynamical variables.
What are some comparable data sets, if any?
The ERA5 (ECMWF reanalysis version 5) contains a 10 member ensemble. It is available from 1940 to near present day. However, it was not created as a consistent sample of equally likely realizations of the true atmosphere. In contrast, the CAM6+DART Reanalysis explicitly represents these distributions at all stages using ensemble samples.
How is uncertainty characterized in these data?
The uncertainty is characterized in much more detail than most reanalyses. This is based on the ensemble nature of the algorithms. The ensembles are consistent samples of the analysis and short term forecast errors. The data set includes the ensemble standard deviation for every state variable (PS, T, US, VS, Q, CLDLIQ, CLDICE = surf. pressure, temperature, wind components, specific humidity, cloud liquid and ice) at every model grid point with a 6-hourly frequency. This uncertainty is the result of a balance between the uncertainties in the observations (provided by the instrument manufacturers and users) and in the model error growth. The balance is automatically calculated based on Bayesian theory in an Ensemble Kalman Filter framework. Other sources of uncertainty, such as parametric and model structure in addition to representativeness error, are not accounted for. Some of this is mitigated by DART’s ensemble inflation algorithms, but the degree is difficult to quantify.
In addition, there is a complete set of observation space diagnostics, which include the bias, RMSE, and "total spread" of the reanalysis relative to each observation type as a function of time, region, and vertical layer in the atmosphere. These are viewable on the DART website. The "total spread" is the combination of the observation uncertainty with the ensemble uncertainty (standard deviation). These statistics give a broader view of the uncertainty than the state space ensemble does. The original data can be reprocessed by users to focus on their features of interest, if the default regions and levels are not sufficient. This picture shows a persistent cold bias of CAM6, which is consistent with comparisons to other observation types, so it seems to represent a model flaw.
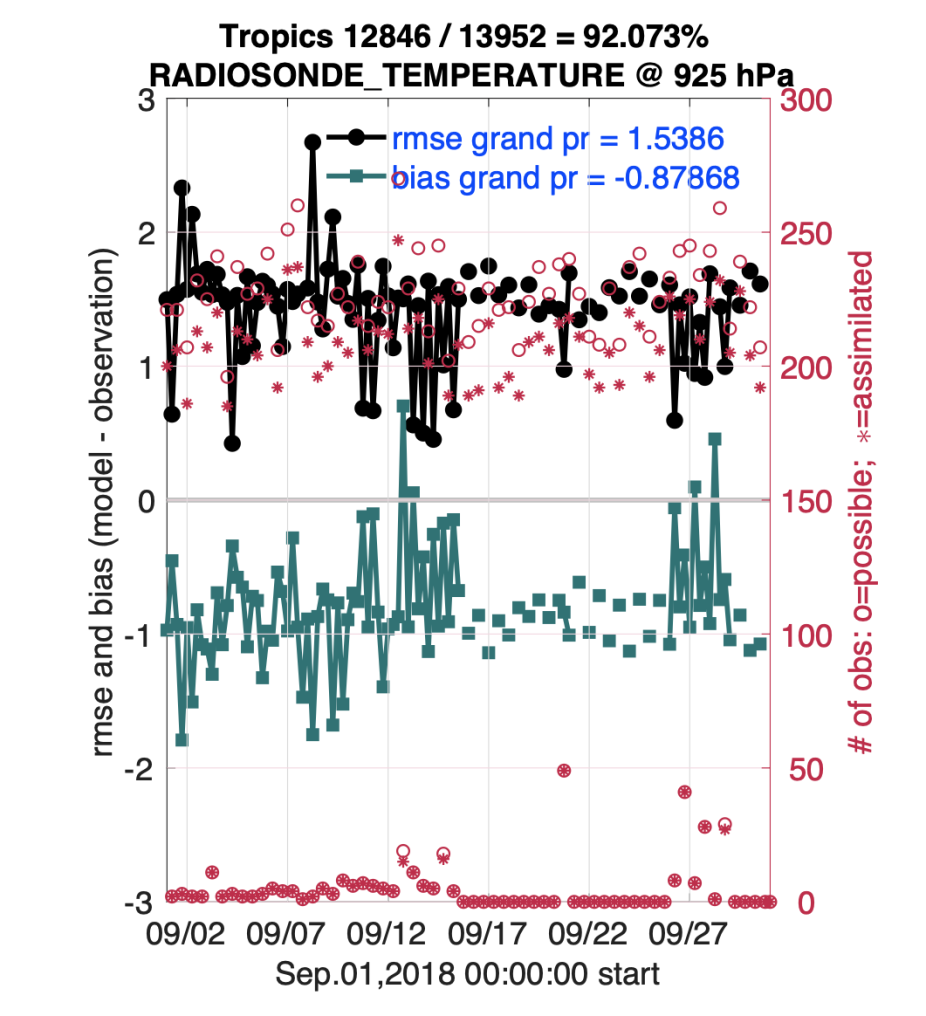
Figure 2: An example summary of the diagnostic information available in the observation space diagnostics of the reanalysis for a single layer, region, and month (925 hPa, Tropics, Sept 2018) relative to radiosonde observations. The root-mean-square-error (black) and bias (green) of the reanalysis ensemble-mean estimated observations relative to the actual observations show variability within overall stability. The number of observations available (red circles) and assimilated (red *) provide context; times with nearly all of the observations assimilated indicate that the assimilation is working well, times with few observations assimilated can suffer from "small number statistics" variability. These figures for all layers, regions, and time periods can be viewed on the DART webpage.
K. Raeder
Were corrections made to account for changes in observing systems or practices, sampling density, satellite drift, or similar issues?
Platform biases, including satellite drift, are not corrected by the data assimilation procedure; we rely on the providers of the observations to make those corrections and to provide estimates of the mostly random observation errors, which can evolve with time and affect how closely the reanalysis is pulled to the observations.
This reanalysis used observations from the National Centers for Environmental Prediction PREPBUFR files, which contain the entire set of data that is input into the analysis step of a particular NCEP model run. In particular, it uses wind and temperature observations from weather balloons, aircraft, and satellites. It also used observations of temperature from AIRS satellites and atmospheric refractivity from GPS satellites. These had various levels of quality control and correction applied to them by the data providers. In addition the data assimilation method excluded observations which appeared to be erroneous outliers; observations farther than 3 standard deviations from the ensemble mean.
DART’s algorithms, such as adaptive ensemble inflation, automatically adjust to changes in frequency and distribution of the remaining observations. The ensemble uncertainty is inversely correlated with the observation density. But the combination of information from several platforms and the model enables many platform biases to cancel each other in the reanalysis. In any case, the observation space diagnostics show the bias of the reanalysis relative to each observation platform. Examining those side-by-side can reveal the biases of the observation platforms relative to each other. Choosing the most reliable observation platforms is a matter for observations experts.
How useful are these data for characterizing means as well as extremes?
A strength of this relatively large ensemble (80-member) reanalysis is its ability to illustrate the possible extremes at a given time, as constrained by the observational network. Smaller ensembles are less able to sample the tails of the probability distribution.
As in any reanalysis, the limited time span means that it does not necessarily capture extremes which may happen outside of that time span. But it is adept at capturing extremes within the time span, which the model may be unable to represent without correction by the observations.
Model shortcomings, such as overly persistent drizzle, or incorrect diurnal timing of convection, may also limit the usefulness of the description of the extremes. Using observations alongside the reanalysis can partially correct these, given that there are sufficient observations.
The ensemble mean is less vulnerable to the factors which may degrade the description of the extremes.
How does one best compare these data with model output?
The "state space" output is in NetCDF files:
- Month-long time series of model state variables {PS, T, US, VS, Q, CLDLIQ, CLDICE} means and ensemble standard deviations with a 6-hourly frequency.
- Month-long time series of the ensemble of atmospheric forcing on surface models. The frequencies range from hourly to 4 times daily. These would most easily be compared with the same output from CESM. Identifying comparable variables in other models involves some challenges, including variable names which are difficult to parse, not well-documented, and which changed when CESM transitioned to the NUOPC framework.
- Similarly for selected CLM history file fields which describe plant growth in CLM5. (Raeder et al. 2021)
- Weekly ensembles of instantaneous restart files; CAM initial and restart files, CLM and CICE restart files. These have many variables in addition to the state variables. Statistics of these fields can be calculated using common tools for processing NetCDF and compared with the same statistics from model output.
The ensemble standard deviation provides important context for judging whether external model output (not part of the CAM6+DART Reanalysis) is consistent with the reanalysis. This ensemble uncertainty should be combined with the external model uncertainty to yield a total uncertainty (similar to “total spread” in “How is uncertainty characterized”, above) . Only external model output which differs from these data by more than the total uncertainty should be viewed as inconsistent with it.
Are there spurious (non-climatic) features in the temporal record?
We have not done a thorough evaluation of the non-climatic features in the data, but there are a few known.
- No observations were assimilated near the top of the model because the damping in that region interferes with the assimilation. So reanalysis data above 36 hPa is mostly model data.
- One persistent bias is the low level temperature cold bias, which is O(< 1 K).
- The observation network evolves with time, which can have several effects which are not results of changes in the Earth system. Examples include changes in the bias, RMSE, and total spread in the reanalysis, which can also be spatially heterogeneous.
- There will be a disequilibrium between years 2010 and 2011 bridging the gap between the CAM4 and CAM6 reanalysis.
We welcome any contributions others discover!
The most effective way to identify biases in the reanalysis is to examine the observation space diagnostics, while keeping several things in mind:
- Each observation type and the model may individually be biased. The reanalysis is a blending of these and it's not always possible to decide which is more biased.
- The total spread provides a measuring stick for judging whether a bias is meaningful.
- The "noise" in the time series often arises from some times having small numbers of observations assimilated. The statistics at those times are not reliable and should be ignored.
How do I access these data?
A thorough description of how to access the data of interest can be found in Raeder et al. (2021), with an update; the data are now publicly accessible through NSF NCAR's GDEX (Geoscience Data Exchange) here instead of the Research Data Archive. The GDEX repository has software which can be used to access/download files: csh, python, globus, jupyter, etc.
Users of NCAR's supercomputer (as of 2026) can find the data in
/gpfs/csfs1/cisl/dares/Reanalyses/f.e21.FHIST_BGC.f09_025.CAM6assim.011/
which have the same organization as the GDEX site.
The CLM5 plant growth time series have been converted to ZARR and are available through Amazon Web Services (see here for details).
How frequently are the data updated?
The reanalysis is not updated, but can be extended if there is sufficient community interest.
Can you recommend any cloud platforms and/or online plotting tools where one can visualize and interact with these data?
The default observation space evaluations are viewable on the DART webpage. The input data for those pictures are available from the GDEX date repository #345 mentioned above, as are all of the model space output files mentioned in this description.
Is there any publicly available code that illustrates how to access and analyze these data? If so, where?
The DART software suite includes Matlab scripts and pyDARTdiags (python scripts) for manipulating DART’s observation files and generating observation space diagnostic pictures.
Key Reference
Raeder, K., Hoar, T. J., El Gharamti, M., Johnson, B. K., Collins, N., Anderson, J. L., Steward, J. & Coady, M. (2021). A new CAM6+ DART reanalysis with surface forcing from CAM6 to other CESM models. Scientific Reports, 11(1), 16384. 10.1038/s41598-021-92927-0
Cite this page
Acknowledgement of any material taken from or knowledge gained from this page is appreciated:
Raeder, Kevin & National Center for Atmospheric Research Staff (Eds). Last modified "The Climate Data Guide: CAM6+DART Reanalysis and Surface Forcings.” Retrieved from https://climatedataguide.ucar.edu/climate-data/cam6dart-reanalysis-and-surface-forcings on 2026-07-07.
Citation of datasets is separate and should be done according to the data providers' instructions. If known to us, data citation instructions are given in the Data Access section, above.
Acknowledgement of the Climate Data Guide project is also appreciated:
Schneider, D. P., C. Deser, J. Fasullo, and K. E. Trenberth, 2013: Climate Data Guide Spurs Discovery and Understanding. Eos Trans. AGU, 94, 121–122, https://doi.org/10.1002/2013eo130001
Key Figures

Figure 1: Ensemble mean surface pressure from the CAM6+DART reanalysis at 0Z 10/29/2021, shortly before Hurricane Sandy made landfall.

Figure 2: An example summary of the diagnostic information available in the observation space diagnostics of the reanalysis for a single layer, region, and month (925 hPa, Tropics, Sept 2018) relative to radiosonde observations. The root-mean-square-error (black) and bias (green) of the reanalysis ensemble-mean estimated observations relative to the actual observations show variability within overall stability. The number of observations available (red circles) and assimilated (red *) provide context; times with nearly all of the observations assimilated indicate that the assimilation is working well, times with few observations assimilated can suffer from "small number statistics" variability. These figures for all layers, regions, and time periods can be viewed on the DART webpage.