GHCN (Global Historical Climatology Network) Related Gridded Products

Long time series of gridded surface temperature and precipitation data derived from homongenized station data. The gridded anomalies were produced from GHCN-M bias corrected data. GHCN data and CAMS (Climate Anomaly Monitoring System) are combined to produce a high resolution 'real-time' product.
Key Strengths
Cite this page
Acknowledgement of any material taken from or knowledge gained from this page is appreciated:
National Center for Atmospheric Research Staff (Eds). Last modified "The Climate Data Guide: GHCN (Global Historical Climatology Network) Related Gridded Products.” Retrieved from https://climatedataguide.ucar.edu/climate-data/ghcn-global-historical-climatology-network-related-gridded-products on 2026-02-22.
Citation of datasets is separate and should be done according to the data providers' instructions. If known to us, data citation instructions are given in the Data Access section, above.
Acknowledgement of the Climate Data Guide project is also appreciated:
Schneider, D. P., C. Deser, J. Fasullo, and K. E. Trenberth, 2013: Climate Data Guide Spurs Discovery and Understanding. Eos Trans. AGU, 94, 121–122, https://doi.org/10.1002/2013eo130001
Key Figures

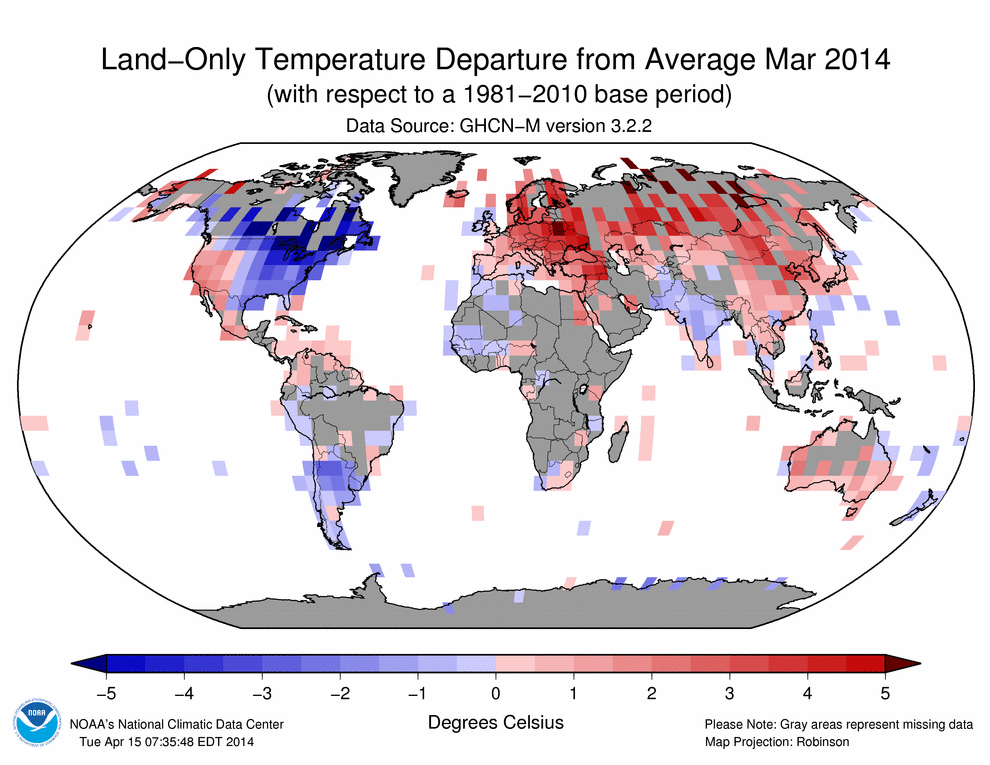
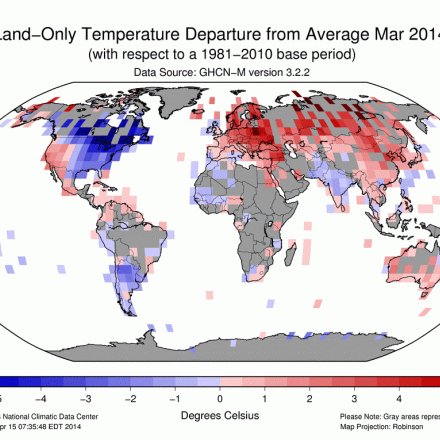
GHCN-M temperature anomalies for March 2014 (source: https://www.ncdc.noaa.gov/temp-and-precip/ghcn-gridded-products.php)

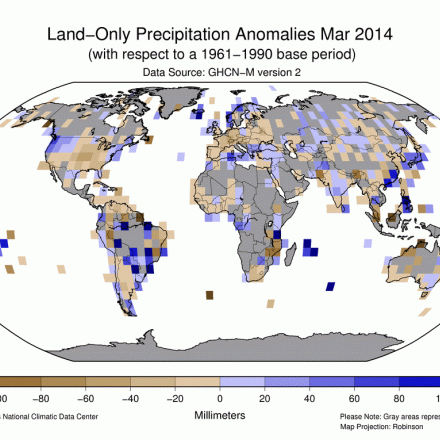
GHCN precipitation anomalies for March 2014 (source: https://www.ncdc.noaa.gov/temp-and-precip/ghcn-gridded-products.php)

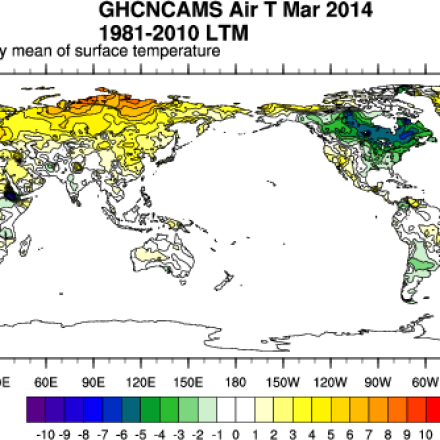
GHCN-CAMS high resolution (0.5x0.5) analyzed global land surface temperatures for March 2014. (source: http://www.esrl.noaa.gov/psd/data/gridded/data.ghcncams.html)
Other Information
- Lawrimore, J. H. et al ((2011), An overview of the Global Historical Climatology Network monthly mean temperature data set, version 3, J. Geophys. Res., 116, D19121
- Menne, M.J., and C.N. Williams Jr. (2009): Homogenization of temperature series via pairwise comparisons. Journal of Climate, 22(7), 1700-1717
- Fan, Y., and H. van den Dool (2008): A global monthly land surface air temperature analysis for 1948 – present, J. Geophys. Res. , 113 , D01103
- Peterson, T.C., and R.S. Vose (1997): An overview of the Global Historical Climatology Network temperature database. Bulletin of the American Meteorological Society, 78 (12), 2837-2849
- Menne, M.J. et al (2012): An Overview of the Global Historical Climatology Network-Daily Database ; ournal of Atmospheric and Oceanic Technology Volume 29, Issue 7 (July 2012) pp. 897-910
- Menne, M.J, et al (2009): he U.S. Historical Climatology Network Monthly Temperature Data, Version 2. BAMS: v 90, Issue 7, pp. 993-1007