Global dataset of solar-induced chlorophyll fluorescence (GOSIF)
GOSIF is a global, gridded dataset of solar-induced chlorophyll fluorescence (SIF). SIF, an energy flux re-emitted by plants a few nanoseconds after light absorption, exhibits a strong linear relationship with gross primary production (GPP) at the ecosystem scale and thereby is a strong proxy of GPP. The GOSIF dataset (Li and Xiao, 2019a) provides 8-day SIF data globally at 0.05-degree spatial resolution. This product is derived from discrete SIF observations based on the Orbiting Carbon Observatory-2 (OCO-2) using a machine learning method. The generation of GOSIF also makes use of spatially and temporally continuous data on enhanced vegetation index (EVI) derived from the Moderate Resolution Imaging Spectroradiometer (MODIS) and meteorological reanalysis data (air temperature, vapor pressure deficit, shortwave solar radiation) from MERRA-2.
Expert Developer Guidance
The following was contributed by Jingfeng Xiao and Xing Li, June, 2023:
GOSIF data product
GOSIF is a global, gridded dataset of solar-induced chlorophyll fluorescence (SIF) produced by the Global Ecology Group at University of New Hampshire. SIF, an energy flux re-emitted by plants a few nanoseconds after light absorption, exhibits a strong linear relationship with gross primary production (GPP) at the ecosystem scale and thereby is a strong proxy of GPP. The GOSIF dataset (Li and Xiao, 2019a) provides 8-day SIF data globally at 0.05-degree spatial resolution (Figure 1). This product is derived from discrete SIF observations based on the Orbiting Carbon Observatory-2 (OCO-2) using a machine learning method. The generation of GOSIF also makes use of spatially and temporally continuous data on enhanced vegetation index (EVI) derived from the Moderate Resolution Imaging Spectroradiometer (MODIS) and meteorological reanalysis data (air temperature, vapor pressure deficit, shortwave solar radiation) from MERRA-2.
Original OCO-2 SIF soundings are very sparse both spatially and temporally and are also only available since September 2014. These discrete observations can be directly aggregated to gridded data. However, even with coarse spatial (e.g., 1 degree) and temporal (e.g., monthly) resolutions, the resulting gridded data still have substantial data gaps (Figure 2). By contrast, GOSIF consists of global, gridded SIF estimates with finer spatial (0.05 degree) and temporal (8 day) resolutions, and they are not only spatially and temporally continuous (Figure 2) but also available for a much longer period (2000-2022). GOSIF also has much finer spatial resolution than gridded SIF products based on SIF satellite missions prior to OCO-2 such as GOME-2 and GOSAT (e.g., 0.5-2 degree).
The machine learning model used to develop GOSIF was trained using nadir SIF observations. Nadir SIF accounts for the portion of SIF escaping from the canopy that is detected by the sensor. Although converting directional SIF to total canopy SIF may yield a higher consistency between SIF and GPP, using observations for a standard viewing geometry (e.g., nadir) can minimize the directional effects of SIF.
As of this writing (May 2023), GOSIF data are available every 8 days for the period from February 2000 to December 2022. Temporally aggregated data at monthly and annual time steps are also provided. This 23-year SIF dataset makes it feasible to conduct research at interannual and decadal timescales. A widely-used scientific file format – GeoTIFF is adopted for GOSIF, which facilitates its use by users from various research areas.
The GOSIF dataset has been used by the research community to study ecosystem functioning (e.g., Gang et al., 2020), productivity (e.g., Shekhar et al., 2022), carbon cycling (e.g., Wang et al., 2023), phenology (e.g., Fu et at., 2022), and impacts of long-term trends and variability in the climate system (e.g., drought) (e.g., Li et al., 2020). This dataset has also been used to evaluate terrestrial biosphere models and Earth system models (e.g., Uribe et al., 2021). For instance, Qiu et al., (2022) used multiple datasets including vegetation indices, GOME-2 SIF and GOSIF to monitor drought impacts on crop productivity of the U.S. Midwest. This study demonstrated that SIF based on the GOSIF dataset has a better performance for monitoring the responses of crop productivity to drought than vegetation indices derived from MODIS and SIF based on GOME-2.
GOSIF versus vegetation indices
SIF offers an emerging technique for monitoring photosynthesis compared to satellite-derived vegetation indices (Yang et al., 2015; Li et al., 2018). A variety of satellite-derived vegetation indices, including the normalized difference vegetation index (NDVI) (Rouse et al., 1974) and EVI (Huete et al., 2002), have been developed since the 1970s and have been traditionally used in ecosystem studies. SIF, an energy flux re-emitted by plants during the photosynthesis process, is more directly related to photosynthesis and thereby is able to better capture plant responses to water and heat stresses. Many studies have shown that SIF including GOSIF indeed outperforms vegetation indices. Some studies, however, have indicated that a relatively new vegetation index — the near-infrared reflectance of vegetation (NIRv) (Badgley et al., 2017) has a similar performance to SIF (Li et al., 2018; Zhang et al., 2022). It still remains debatable to what extent SIF can better track the seasonal and interannual variations of GPP than the vegetation indices particularly NIRv. Meanwhile, there is also evidence that SIF and NIRv contain complementary information (e.g., on photosynthesis versus canopy structure) (Zeng et al., 2022). Future investigations are needed to reveal the unique contributions of SIF data products like GOSIF relative to vegetation indices products and the synergy between these two different types of techniques.
Limitations, interpretations, and potential improvement
The accuracy of the GOSIF dataset has been evaluated using independent SIF observations based on OCO-2. GOSIF has reasonable accuracy (Figure 3); it has high performance for deciduous needleleaf forests, deciduous broadleaf forests, mixed forests, woody savannas, savannas, and croplands (all with R2 greater than 0.75) and a moderate performance for evergreen broadleaf forests (R2 = 0.43, RMSE = 0.08 W m−2 μm−1 sr−1) and open shrublands (R2 = 0.46, RMSE = 0.06 W m−2 μm−1 sr−1) (Li and Xiao, 2019a). GOSIF does not provide uncertainty information on a per-pixel basis, which might limit some applications that require per-pixel uncertainty estimates.
GOSIF has been used to understand the interannual variability and long-term trends in SIF and photosynthesis (e.g., Figure 4) (e.g., Li and Xiao, 2019a; Zhao et al., 2022). It should be noted that well capturing these temporal changes in SIF and other fluxes (e.g., carbon fluxes, evapotranspiration) remains a grand challenge for machine learning methods and other approaches (e.g., terrestrial biosphere models). The interannual variability and trends in SIF based on the GOSIF dataset should therefore be interpreted with caution.
Compared to previous gridded SIF products based on GOME-2 and GOSAT data (e.g., 0.5-2 degree), GOSIF has a much finer spatial resolution (0.05 degree), which is sufficient for numerous regional to global scale studies. Some applications, particularly studies at regional scales, might benefit from having a resolution finer than 0.05 degree and thereby more spatial details. Future similar products could consider the use of an even finer resolution like 500 m (i.e., the native resolution of MODIS surface reflectance and vegetation indices products).
Since GOSIF was initially developed in 2018, the machine learning model was trained with two years of OCO-2 SIF data (2015-2016) while tested with the data in 2017. A much longer OCO-2 SIF record is now available. If the machine learning model could be re-trained with the entire OCO-2 SIF record, the resulting GOSIF dataset might be able to better capture the interannual variability and long-term trends in SIF.
Data continuity
GOSIF is not designed to be an operational dataset due to the lack of sustained funding. Nevertheless, to date, the developers have managed to extend the dataset on an annual basis since its initial release in 2019. This dataset is also anticipated to continue to be extended annually in the near future to meet the needs of the research community.
Despite its value, GOSIF faces a challenge — potential discontinuity. This product relies on MODIS data directly. However, the mission duration of both Terra and Aqua, the satellites carrying the MODIS instruments, has far exceeded their designed life expectancy (6 years), and they may retire soon. The retirement of both Terra and Aqua will lead to the discontinuity of the MODIS-based data products including EVI that was used to help generate GOSIF. Fortunately, the Visible Infrared Imaging Radiometer Suite (VIIRS) instrument aboard the Suomi NPP and JPSS-1 (also known as NOAA-20), launched in October 2011 and November 2017, respectively, has been observing the Earth’s surface and providing continuity data such as surface reflectance and vegetation indices. Future satellites of the JPSS series will also carry instruments similar to VIIRS. The availability and utilization of VIIRS data could potentially ensure the continuity of the GOSIF dataset beyond the MODIS era.
Companion product
GOSIF also has a companion product - GOSIF GPP that has the same spatial and temporal coverage and resolutions. GOSIF GPP (Li and Xiao, 2019b) is a global, gridded GPP product that is based on the GOSIF dataset (Li and Xiao, 2019a) and established relationships between GPP and SIF (Li et al., 2018; Xiao et al., 2019). The companion product is also available on the Global Ecology Repository (http://data.globalecology.unh.edu). GOSIF GPP includes an uncertainty estimate on GPP on a per-pixel basis. For a particular application, whether GOSIF or its companion product should be used depends on whether the user intends to use data on SIF, an energy flux emitted by plants and a proxy of photosynthesis, or GPP, the amount of carbon absorbed by plants via photosynthesis.
Cite this page
Acknowledgement of any material taken from or knowledge gained from this page is appreciated:
Xiao, Jingfeng &, Li, Xing & National Center for Atmospheric Research Staff (Eds). Last modified "The Climate Data Guide: Global dataset of solar-induced chlorophyll fluorescence (GOSIF).” Retrieved from https://climatedataguide.ucar.edu/climate-data/global-dataset-solar-induced-chlorophyll-fluorescence-gosif on 2026-07-07.
Citation of datasets is separate and should be done according to the data providers' instructions. If known to us, data citation instructions are given in the Data Access section, above.
Acknowledgement of the Climate Data Guide project is also appreciated:
Schneider, D. P., C. Deser, J. Fasullo, and K. E. Trenberth, 2013: Climate Data Guide Spurs Discovery and Understanding. Eos Trans. AGU, 94, 121–122, https://doi.org/10.1002/2013eo130001
Key Figures
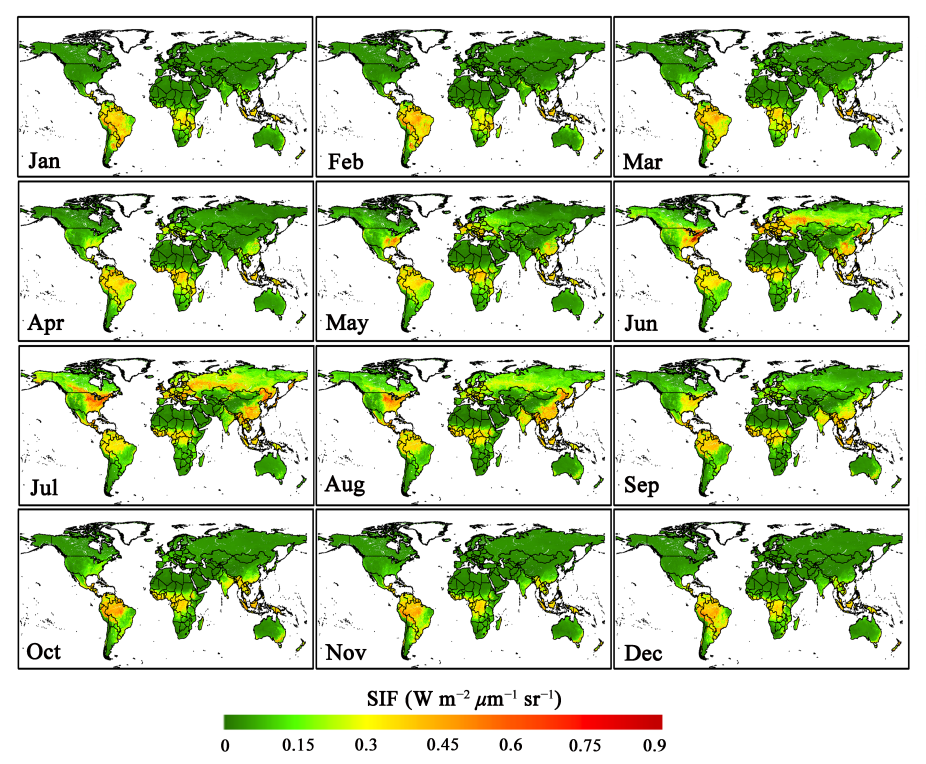
Figure 1. Spatial patterns of 8-day global OCO-2 SIF (GOSIF) from January through December in 2016. The units are W m-2 μm-1 sr-1. For each month, the second 8-day SIF map is shown here.(contributed by Jingfeng Xiao and Xing Li)
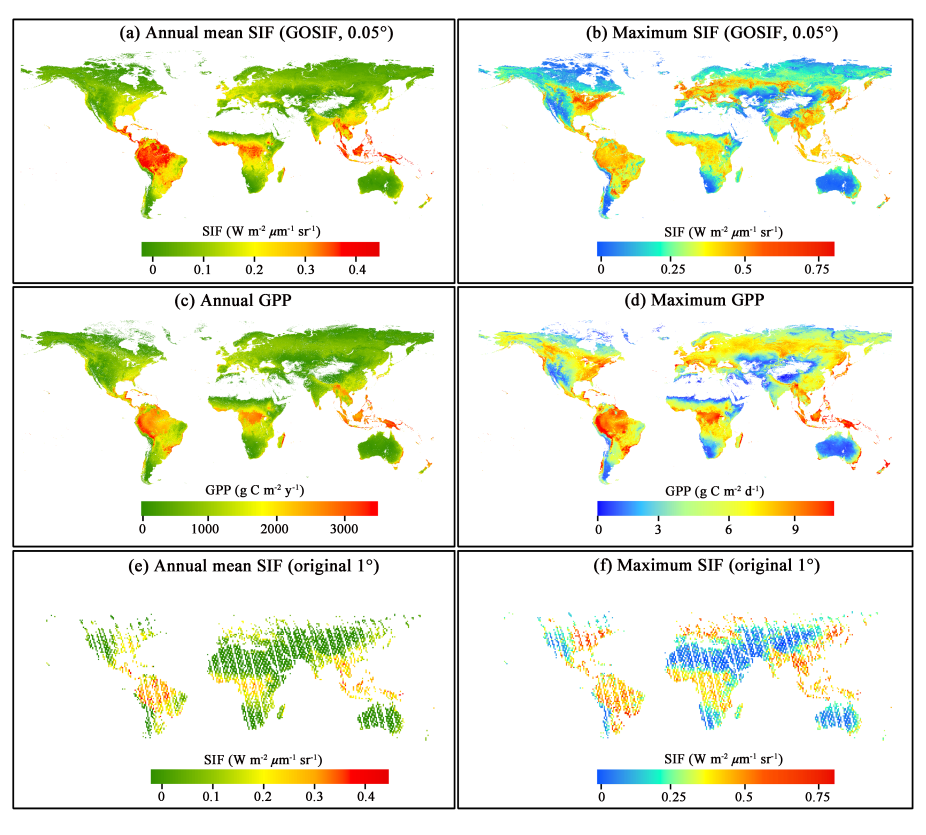
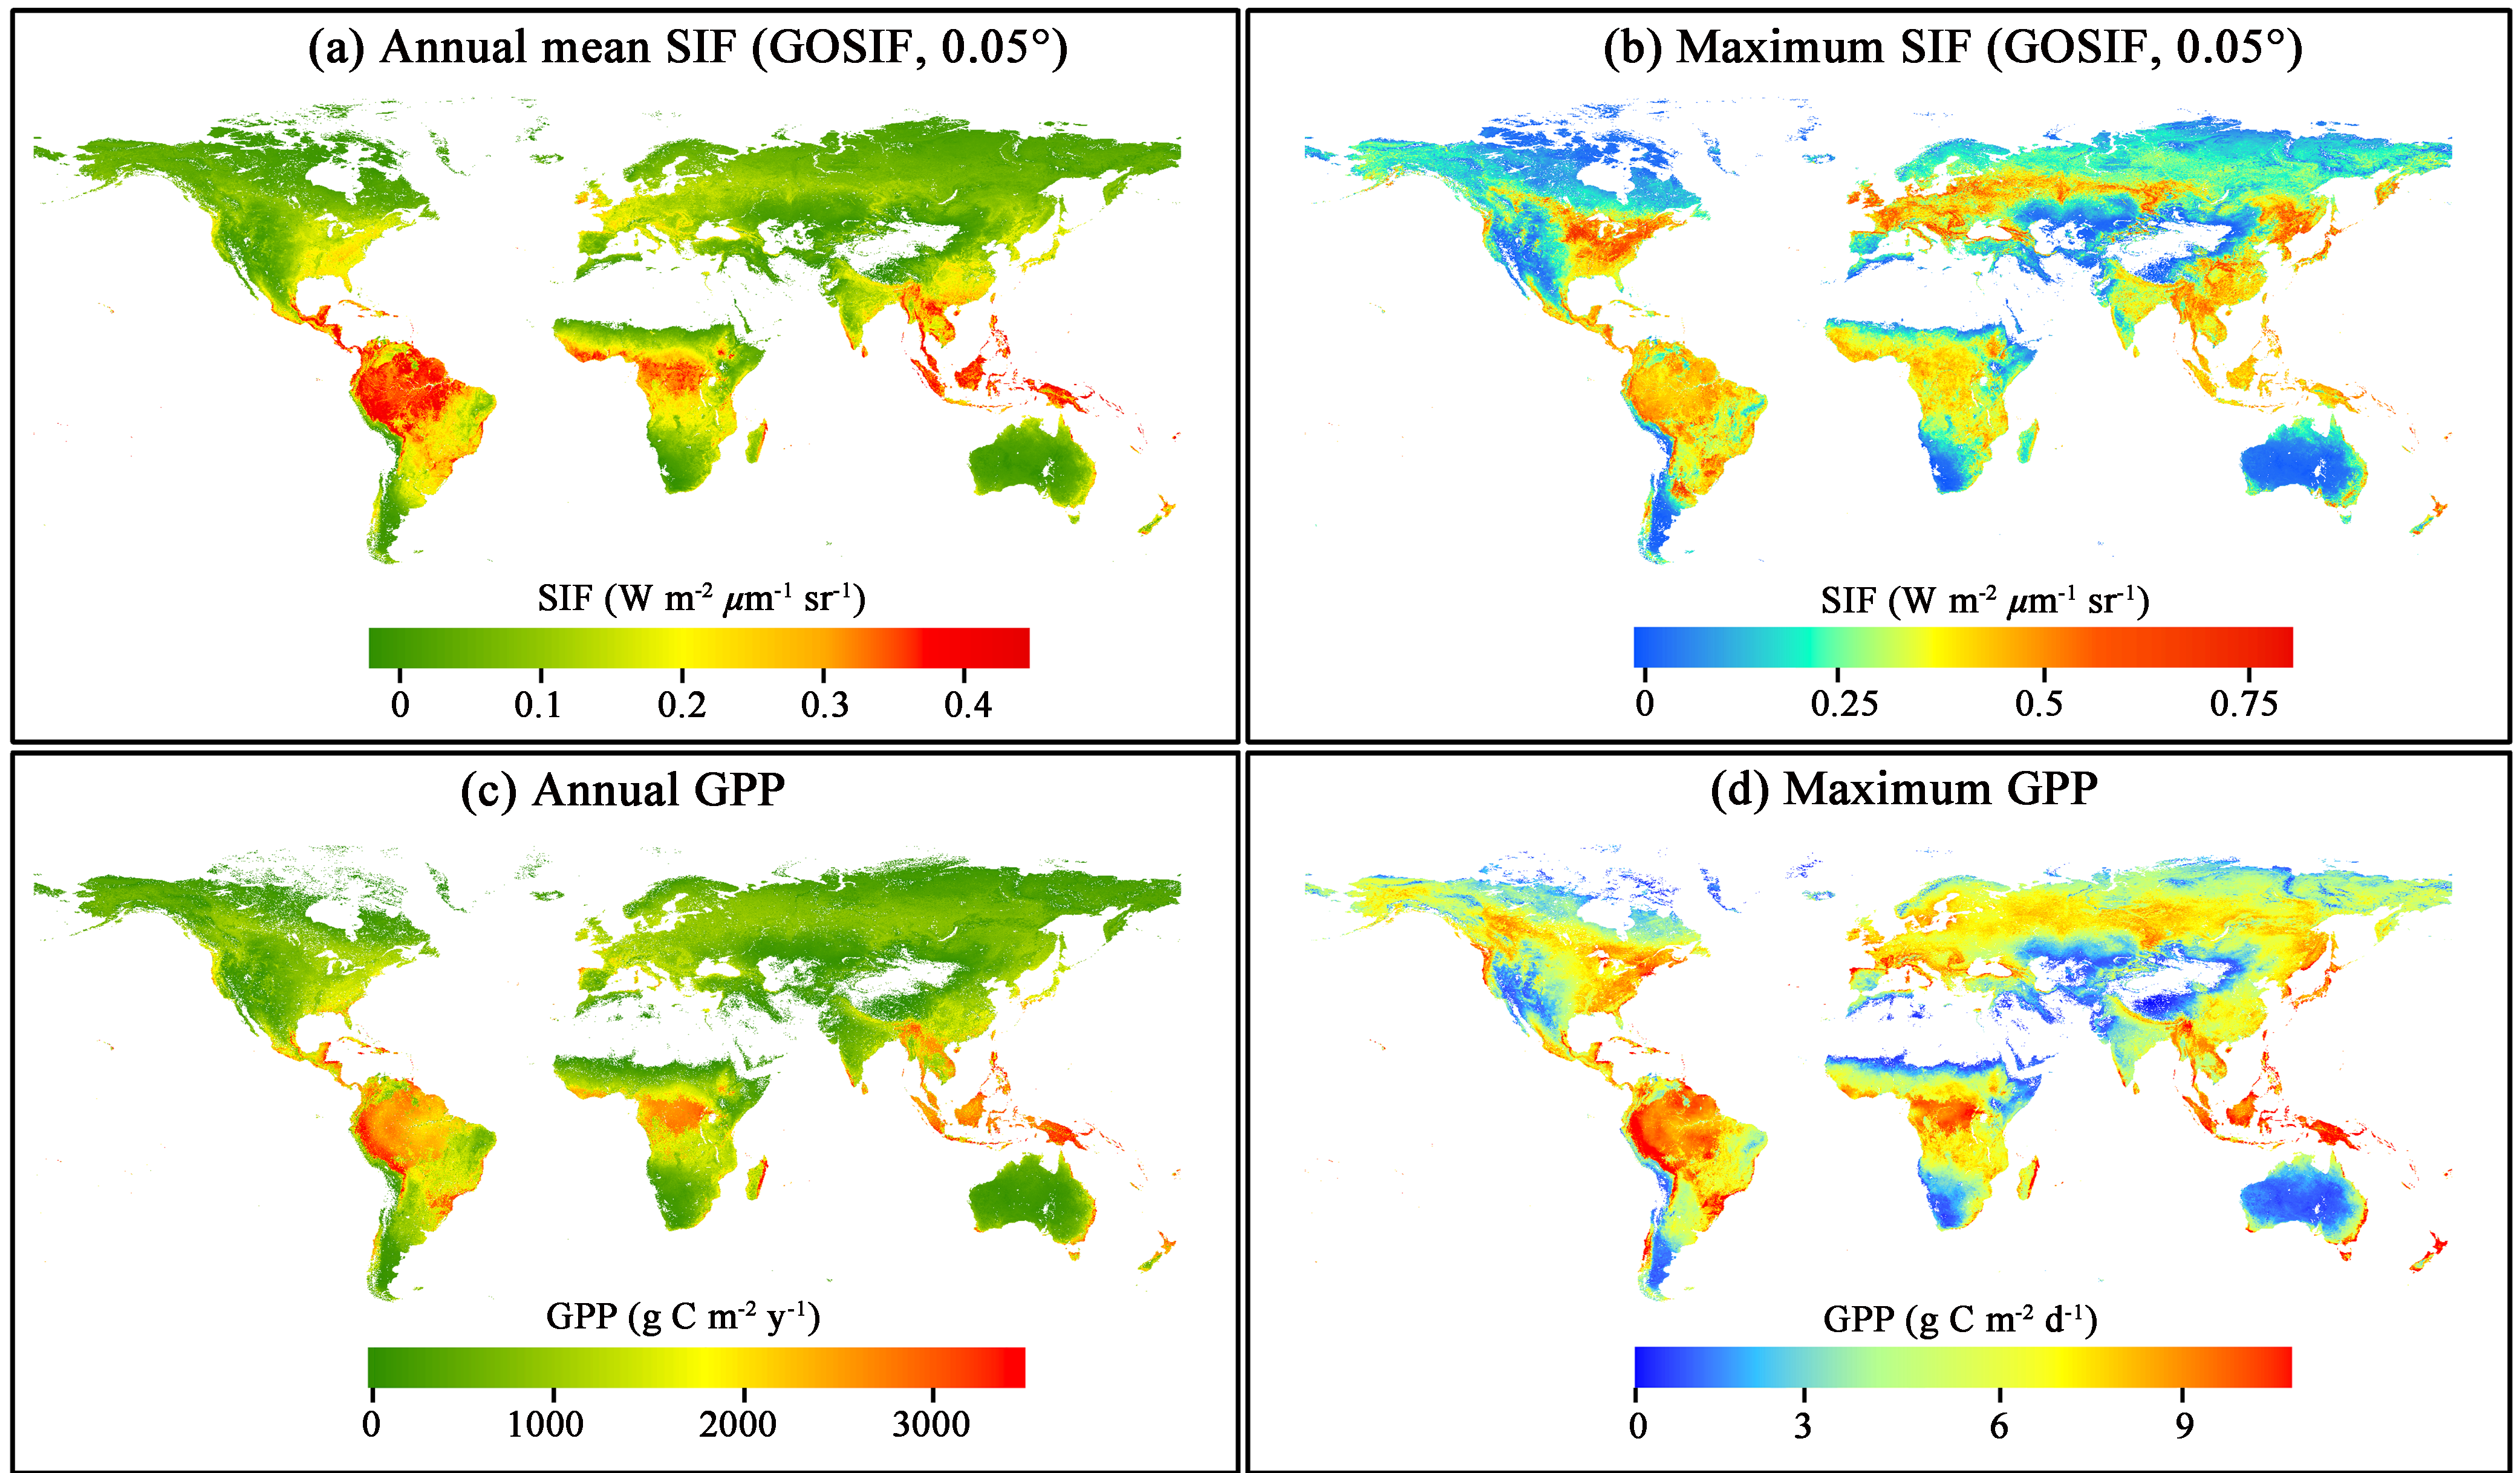
Figure 2. Annual mean and maximum SIF of our GOSIF product (0.05°, 8-day) and comparison with annual/maximum GPP of the MODIS GPP product and the annual mean/maximum SIF of the 1° OCO-2 SIF directly aggregated from discrete OCO-2 SIF soundings in 2015: (a) Annual mean new 0.05° SIF, (b) maximum daily new 0.05° SIF, (c) annual MODIS GPP, (d) maximum daily MODIS GPP, (e) annual mean 1° SIF, and (f) maximum daily 1° SIF.(contributed by Jingfeng Xiao and Xing Li)
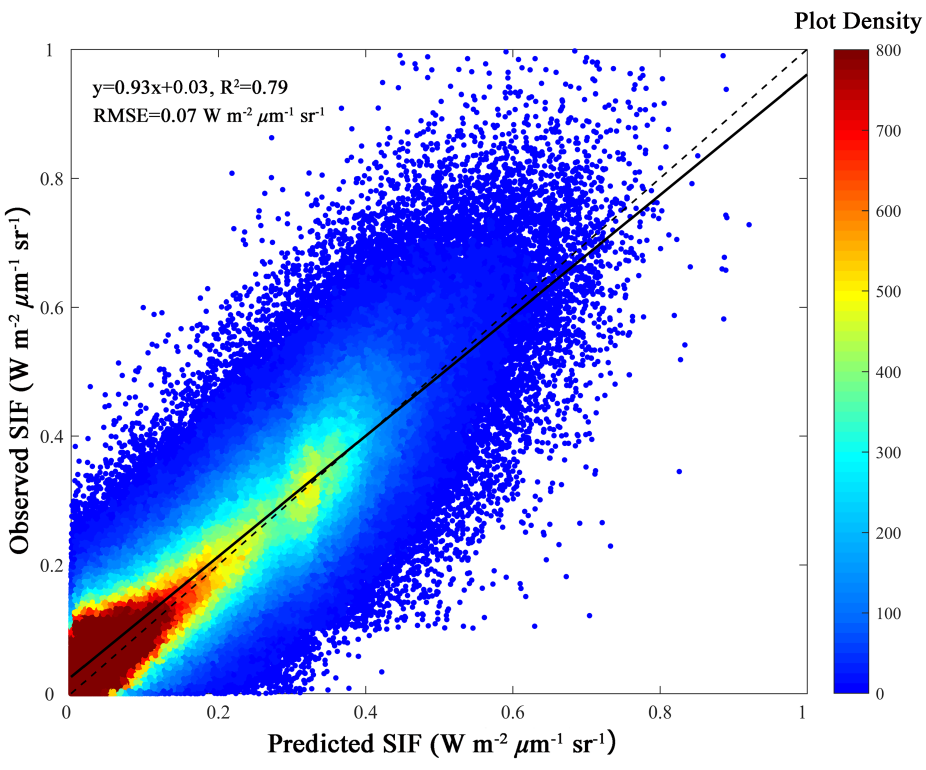
Figure 3. The validation of the predictive SIF model: Scatterplot of observed OCO-2 SIF versus predicted SIF in 2017. The validation dataset comprises ~1.1 million OCO-2 SIF soundings encompassing different seasons and biomes across the globe. The dashed line is the 1:1 line, and the solid line is the regression line.(contributed by Jingfeng Xiao and Xing Li)
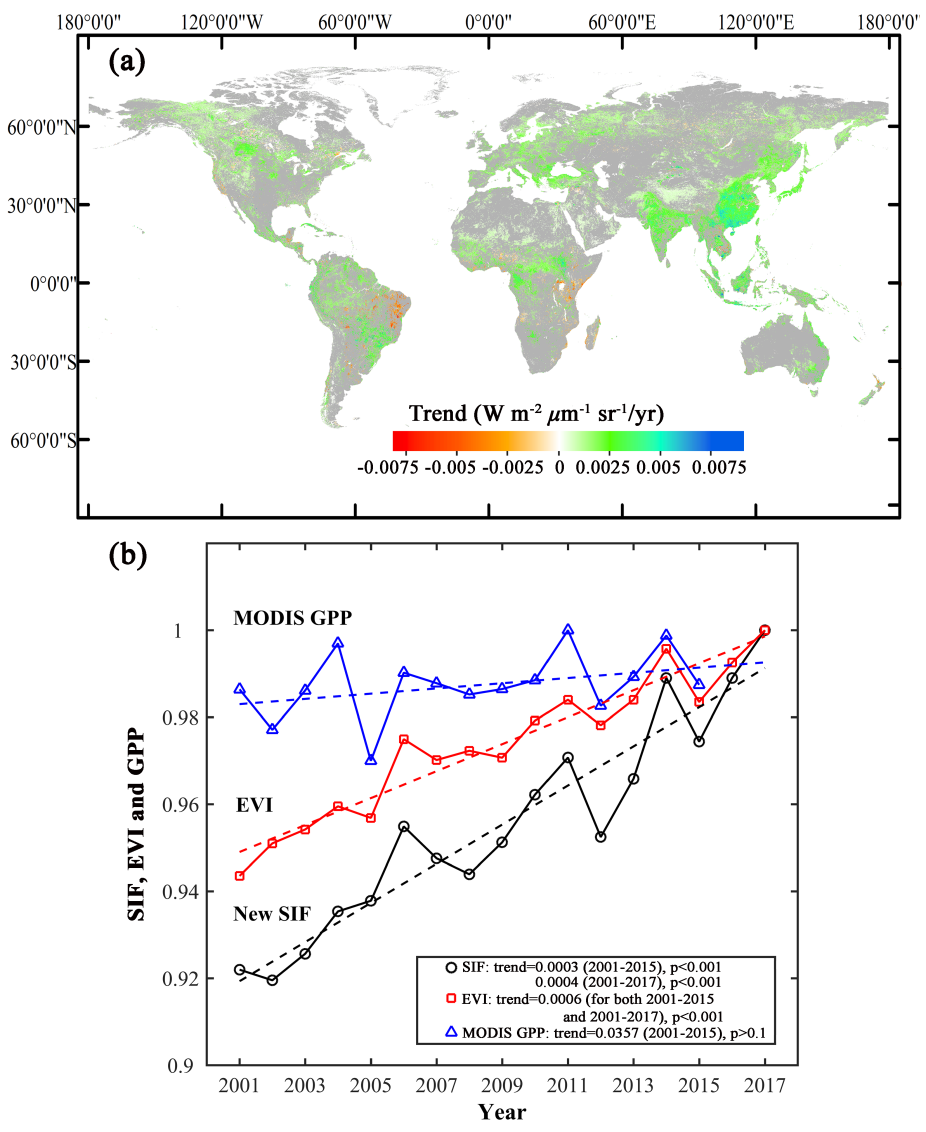
Figure 4. Spatial distribution of the trends (2001–2017) in annual global mean SIF (a) and the inter-annual variations and trends in global mean SIF, enhanced vegetation index (EVI), and MODIS GPP (b). The trends in SIF (unit: W m-2 μm-1 sr-1) and EVI were derived over both periods: 2001–2017 and 2001–2015, while the trend in MODIS GPP was based on the period 2001–2015 (unit: Pg C yr−1). In (a), gray color indicates grid cells with an insignificant trend detected by the Mann–Kendall (MK) test (p > 0.05); positive trends indicate increases in vegetation productivity caused by various factors (e.g., forestation, rising atmospheric CO2 concentration, improved agricultural management practices); negative trends indicate decreases in vegetation productivity resulting from deforestation, disturbance (e.g., wildfire), and other factors. In (b), the SIF, EVI, and GPP were normalized by their maximum values for better display purposes because they have different units and magnitudes. The trends were derived based on the original values of these variables.(contributed by Jingfeng Xiao and Xing Li)
Other Information
- Badgley, G., Field, C.B., Berry, J.A. (2017). Canopy near-infrared reflectance and terrestrial photosynthesis. Science advances, 3(3), e1602244. https://doi.org/10.1126/sciadv.1602244
- Fu, Y., Li, X., Chen, S., Wu, Z., Su, J., Li, X., Li, S., Zhang, J., Tang, J., Xiao, J. (2022) Soil moisture regulates warming responses of autumn photosynthetic transition dates in subtropical forests. Global change biology, 28(16), 4935-4946. https://do
- Gang, C., Pan, S., Tian, H., Wang, Z., Xu, R., Bian, Z., Pan, N., Yao, Y., Shi, H. (2020) Satellite observations of forest resilience to hurricanes along the northern Gulf of Mexico. Forest ecology and management, 472, 118243. https://doi.org/10.1016/j.fo
- Huete, A., Didan, K., Miura, T., Rodriguez, E.P., Gao, X., Ferreira, L.G. (2002) Overview of the radiometric and biophysical performance of the MODIS vegetation indices. Remote Sensing of Environment, 83, 195-213. https://doi.org/10.1016/S0034-4257(02)000
- Li, X., Xiao, J., He, B., Arain, M.A., Beringer, J., Desai, A.R., Emmel, C., Hollinger, D.Y., Krasnova, A., Mammarella, I., Noe, S.M., Ortiz, P.S., Rey-Sanchez, C., Rocha, A.V., Varlagin, A. (2018) Solar-induced chlorophyll fluorescence is strongly correl
- Li, X., Xiao, J., Kimball, J., Reichle, R., Scott, R., Litvak, M., Bohrer, G., Frankenberg, C. (2020) Synergistic use of SMAP and OCO-2 data in assessing the responses of ecosystem productivity to the 2018 US drought. Remote sensing of environment, 251, 1
- Li, X., Xiao, J. (2019a) A global, 0.05-degree product of solar-induced chlorophyll fluorescence derived from OCO-2, MODIS, and reanalysis data. Remote Sensing, 11(5), 517. https://doi.org/10.3390/rs11050517.
- Li, X., Xiao, J. (2019b) Mapping photosynthesis solely from solar-induced chlorophyll fluorescence: A global, fine-resolution dataset of gross primary production derived from OCO-2. Remote Sensing, 11(21), 2563. https://doi.org/10.3390/rs11212563.
- Qiu, R., Li, X., Han, G., Xiao, J., Ma, X., Gong, W. (2022) Monitoring drought impacts on crop productivity of the US Midwest with solar-induced fluorescence: GOSIF outperforms GOME-2 SIF and MODIS NDVI, EVI, and NIRv. Agricultural and Forest Meteorology,
- Rouse, J.W., Haas, R.H., Schell, J.A., Deering, D.W. (1974) Monitoring vegetation systems in the Great Plains with ERTS. In, Paper presented at the 3rd ERTS-1 Symposium, Greenbelt, Maryland. https://ntrs.nasa.gov/citations/19740022614
- Shekhar, A., Buchmann, N., Gharun, M. (2022) How well do recently reconstructed solar-induced fluorescence datasets model gross primary productivity? Remote Sensing of Environment, 283, 113282. https://doi.org/10.1016/j.rse.2022.113282
- Uribe, M.R., Sierra, C.A., Dukes, J.S. (2021) Seasonality of tropical photosynthesis: A pantropical map of correlations with precipitation and radiation and comparison to model outputs. Journal of Geophysical Research: Biogeosciences, 126(11), e2020JG0061
- Wang, T., Bao, A., Xu, W., Zheng, G., Nzabarinda, V., Yu, T., Huang, X., Long, G., Naibi, S. (2023) Dynamics of forest net primary productivity based on tree ring reconstruction in the Tianshan Mountains. Ecological Indicators, 146, 109713. https://doi.o
- Xiao, J., Li, X., He, B., Arain, M.A., Beringer, J., Desai, A.R., Emmel, C., Hollinger, D.Y., Krasnova, A., Mammarella, I., Noe, S.M., Ortiz, P.S., Rey-Sanchez, C., Rocha, A.V., Varlagin, A. (2019) Solar-induced chlorophyll fluorescence exhibits a univers
- Yang, X., Tang, J., Mustard, J.F, Lee, J., Rossini, M., Joiner, J., Munger, J., Kornfeld, A., Richardson, A. (2015) Solar‐induced chlorophyll fluorescence that correlates with canopy photosynthesis on diurnal and seasonal scales in a temperate deciduous f
- Zeng, Y., Chen, M., Hao, D., Damm, A., Badgley, G., Rascher, U., Johnson, J., Dechant, B., Siegmann, B., Ryu, Y., Qiu, H., Krieger, V., Panigada, C., Celesti, M., Miglietta, F., Yang, X. (2022) Combining near-infrared radiance of vegetation and fluorescen
- Zhang, J., Xiao, J., Tong, X., Zhang, J., Meng, P., Li, J., Liu, P., Yu, P. (2022) NIRv and SIF better estimate phenology than NDVI and EVI: Effects of spring and autumn phenology on ecosystem production of planted forests. Agricultural and Forest Meteoro
- Zhao, A., Wang, D., Xiang, K., Zhang, A. (2022) Vegetation photosynthesis changes and response to water constraints in the Yangtze River and Yellow River Basin, China. Ecological Indicators, 143, 109331. https://doi.org/10.1016/j.ecolind.2022.109331