Global near-surface humidity data: HadISDH

HadISDH (Met Office Hadley Centre International Surface Dataset of Humidity) is a gridded 5°x5° monthly mean product beginning in January 1973, and updated annually. It provides monthly gridded specific humidity (q), relative humidity (RH), vapor pressure (e), dew point temperature (Td), wet-bulb temperature (Tw), dew point depression (DPD), equivalent temperature (Te), as well as dry-bulb temperature (T). Each of these variables are reported as anomalies with respect to the provided 1991-2020 climatology. There are four subproducts: a land-only version, an ocean-only version, a blended land-ocean version, and a gridded extremes product that provides monthly extreme indices of wet and dry bulb temperature. The data product is gridded from bias-adjusted in situ weather station data over land and ship-based observations over the ocean. The corrected station records are also available for analyses that require point observations.
Key Strengths
COVERAGE: HadISDH is over 50 years in length, updated annually and near-global in coverage, and consistently processed over time and space.
STABILITY: Long-term and spatial stability of gridded data is prioritized to minimize uncertainty in long-term trend analysis.
TRACEABLE & REPRODUCIBLE: The processing methodology is fully documented and peer-reviewed, with update documents identifying changes associated with each version. The code base is version controlled and well documented.
Key Limitations
COARSE RESOLUTION: The resolution is limited to 5°x5° to maximize global coverage with each gridbox value equal to the mean over all stations within the gridbox. Many regions outside of the USA and Europe have insufficient station density to provide a higher spatial resolution product. Note that single gridbox values are inherently biased to the local topography of the stations within them. This can be an issue when there are very few reporting stations, changes to the reporting stations over time, and/or large variations in the underlying climatological humidity over the gridbox.
ANNUALLY UPDATED: Updating currently takes up to 2 weeks and depends on updates to the hourly HadISD data. Updates to HadISD depend on updates to NOAA ISD, which is being discontinued. HadISDH will be moving to the new GHCNH source database during 2025.
REMAINING GAPS, ERRORS AND BIASES: Coverage is limited by absence of observations, undigitized records and non-sharing data policies. Quality control and homogenisation are necessarily automated statistical tests and inevitably retain a few poor-quality observations.
When using HadISDH in analyses, please use the following citations and state the version used. If using data downloaded from the CEDA archive, there is a traceable citation for each version on the version webpage. PDF downloads of these manuscripts available on the HadISDH landing page.
The HadISDH team strongly recommends that you read the starred read the relevant starred papers before making use of the land, marine, blended and extremes data products. Additional information can be found in the reference for version 1.0.0 (Willett et al. 2013).
Land
*** Willett, K. M., Dunn, R. J. H., Thorne, P. W., Bell, S., de Podesta, M., Parker, D. E., Jones, P. D., and Williams Jr., C. N.: HadISDH land surface multi-variable humidity and temperature record for climate monitoring, Clim. Past, 10, 1983-2006, doi:10.5194/cp-10-1983-2014, 2014.Smith, A., N. Lott, and R. Vose, 2011: The Integrated Surface Database: Recent Developments and Partnerships. Bulletin of the American Meteorological Society, 92, 704\u2013708, doi:10.1175/2011BAMS3015.1.
Willett, K. M., Williams Jr., C. N., Dunn, R. J. H., Thorne, P. W., Bell, S., de Podesta, M., Jones, P. D., and Parker D. E., 2013: HadISDH: An updated land surface specific humidity product for climate monitoring. Climate of the Past, 9, 657-677
Marine
*** Willett, K. M., Dunn, R. J. H., Kennedy, J. J., and Berry, D. I. 2020: Development of the HadISDH marine humidity climate monitoring dataset. Earth System Science Data. 12, 2853-2880, doi.org/10.5194/essd-12-2853-2020.Freeman, E., S.D. Woodruff, S.J. Worley, S.J. Lubker, E.C. Kent, W.E. Angel, D.I . Berry, P. Brohan, R. Eastman, L. Gates, W. Gloeden, Z. Ji, J. Lawrimore, N.A. Rayner, G. Rosenhagen, and S. R. Smith, 2016: ICOADS Release 3.0: A major update to the historical marine climate record. Int. J. Climatol. (doi:10.1002/joc.4775).
Blend
Please use all of the above references.
Extremes
*** Willett, K, 2023: HadISDH.extremes Part 1: a gridded wet bulb temperature extremes index product for climate monitoring. Advances in Atmospheric Sciences, doi: 10.1007/s00376-023-2347-8.Willett, K. 2023: HadISDH.extremes Part 2: exploring humid heat extremes using wet bulb temperature indices. Advances in Atmospheric Sciences, doi: 10.1007/s00376-023-2348-7. http://www.iapjournals.ac.cn/aas/en/article/doi/10.1007/s00376-023-2348-7
Expert Developer Guidance
The following was submitted by Kate Willett, December, 2024:
HadISDH uses in situ weather station observations from NOAA’s ISD over land (Smith et al., 2011) and ship observations from ICOADS over ocean (Freeman et al. 2017). The product is available as land only (HadISDH.land, ~2m), marine only (HadISDH.marine, ~10m) and a blended product (HadISDH.blend, ~2m over land and ~10m over ocean). These each have been quality controlled at the hourly level (as part of the HadISD processing, Dunn et al., 2016) to remove random errors. The T and Td observations are then converted to all of the other humidity variables. Ship observations are height adjusted to ~10m and also adjusted to account for moist biases in poorly ventilated instruments. Monthly means are calculated and homogenised over land to remove systematic biases caused by things such as station moves and instrument changes. The monthly means and anomalies are then averaged over each 5°x5° gridbox.
What are the intended research applications of this data set?
HadISDH is intended for monitoring large scale trends and variability in the mean climate state of near-surface humidity. It has been processed to minimise any biases that could introduce spurious long-term trends. Although national and regional differences exist in terms of instrument type and observing practices, the observations have been treated consistently across the globe to minimise regional bias. Given the spatial and temporal gaps in the observations and gridded product we strongly recommend fitting trends to anomalies, not the absolute values. In addition, analyses should incorporate the provided uncertainties which include homogeneity adjustment uncertainty (land obs) and bias adjustment uncertainty (ocean obs).
How is uncertainty characterized in these data?
HadISDH contains 2 sigma (~95% confidence interval) uncertainty estimates for every gridbox month. The uncertainty assessment includes the station/ship level uncertainty (measurement, inhomogeneity/bias adjustment and climatology), as well as the sampling uncertainty arising from estimating a 5°x5° grid box from point observations. Regional average time series are also provided which include an additional coverage uncertainty term to account for missing 5°x5° grid boxes.
What are some comparable data sets, if any?
There are currently no other in situ only near-surface humidity products. Comparisons with ERA5 show strong similarity over land, although ERA5 shows stronger drying/weaker moistening, with notable divergence from 2019 onwards that is not common to other reanalyses. Over oceans, ERA5 specific humidity looks reasonably similar, but with weaker trends than HadISDH. There is large uncertainty in ocean relative humidity in both ERA5 and HadISDH. Overall, both products show decreasing ocean RH but with quite different temporal variability. The decrease along with the decreasing and now very limited ship observation coverage is an issue for HadISDH in estimating these trends. Note that ERA5 does not assimilate the temperature and humidity from ships but is influenced by changing satellite data streams over time.
Known Issues and Cautions:
There are a few things to be aware of when using HadISDH. Over land, there is an increase in station density until the 1990s and then a slight reduction from 2015. To minimise the effects of a changing station network, stations are only included if they have at least 15 years of data with at least one in each decade of the 1991-2020 climatology period. There are then further, stricter tests on station completeness to ensure included stations provide reliable long-term records. Over the ocean, the change in ship observation numbers is a very large concern, decreasing considerably from the 1990s to 2015. Current coverage is now mostly limited to the northern mid-latitudes.
Observing system instrumental changes have occurred over land and ocean. The change from manual wet-bulb thermometers to automated electronic sensors is now almost world-wide, with changes often being made nationally over a short time period. This makes it difficult for the automated homogenisation algorithm to detect them. Over China, this change occurred in the early 2000s and was found to cause a spurious drying in humidity records (Li et al., 2020, Freychet et al., 2020). It is likely that HadISDH hasn’t fully removed this drying inhomogeneity.
Over oceans, a major issue is the pre-1982 moist bias which is most apparent in the relative humidity, and possibly linked to changes in reporting of whole numbers to decimal precision. The limited spatial coverage makes the ocean humidity record more vulnerable to observing system changes than the land data. Its advisable only to fit trends from 1982 onwards. Other major changes are the increase in ship heights over time, which has been adjusted for in HadISDH, although incomplete metadata means that adjustments are approximations in some cases. The ship structure can cause a solar heating bias which can affect the relative humidity. This has not been adjusted for in HadISDH. Comparisons between daytime and nighttime trends show little difference but users should be aware of it. A new paper (Willett and Blannin, in prep) explores these marine humidity data issues in more detail.
Cite this page
Acknowledgement of any material taken from or knowledge gained from this page is appreciated:
Willett, Kate & National Center for Atmospheric Research Staff (Eds). Last modified "The Climate Data Guide: Global near-surface humidity data: HadISDH.” Retrieved from https://climatedataguide.ucar.edu/climate-data/global-near-surface-humidity-data-hadisdh on 2026-02-14.
Citation of datasets is separate and should be done according to the data providers' instructions. If known to us, data citation instructions are given in the Data Access section, above.
Acknowledgement of the Climate Data Guide project is also appreciated:
Schneider, D. P., C. Deser, J. Fasullo, and K. E. Trenberth, 2013: Climate Data Guide Spurs Discovery and Understanding. Eos Trans. AGU, 94, 121–122, https://doi.org/10.1002/2013eo130001
Key Figures

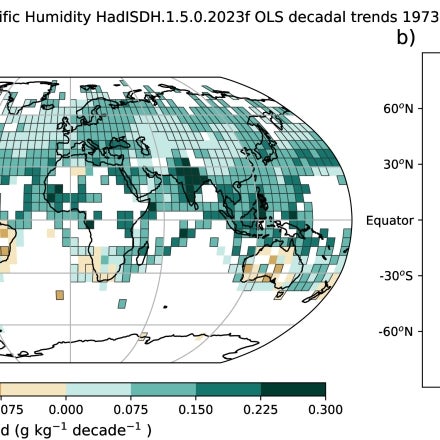
Decadal trends in specific humidity (q) from 1973-2023 for monthly mean climate anomalies relative to 1991-2020. Trends are fitted using OLS regression with AR(1) correction for the confidence intervals. Black dots show trends that are considered to be significantly different from a zero trend where the 5th and 95th confidence intervals are in the same direction.

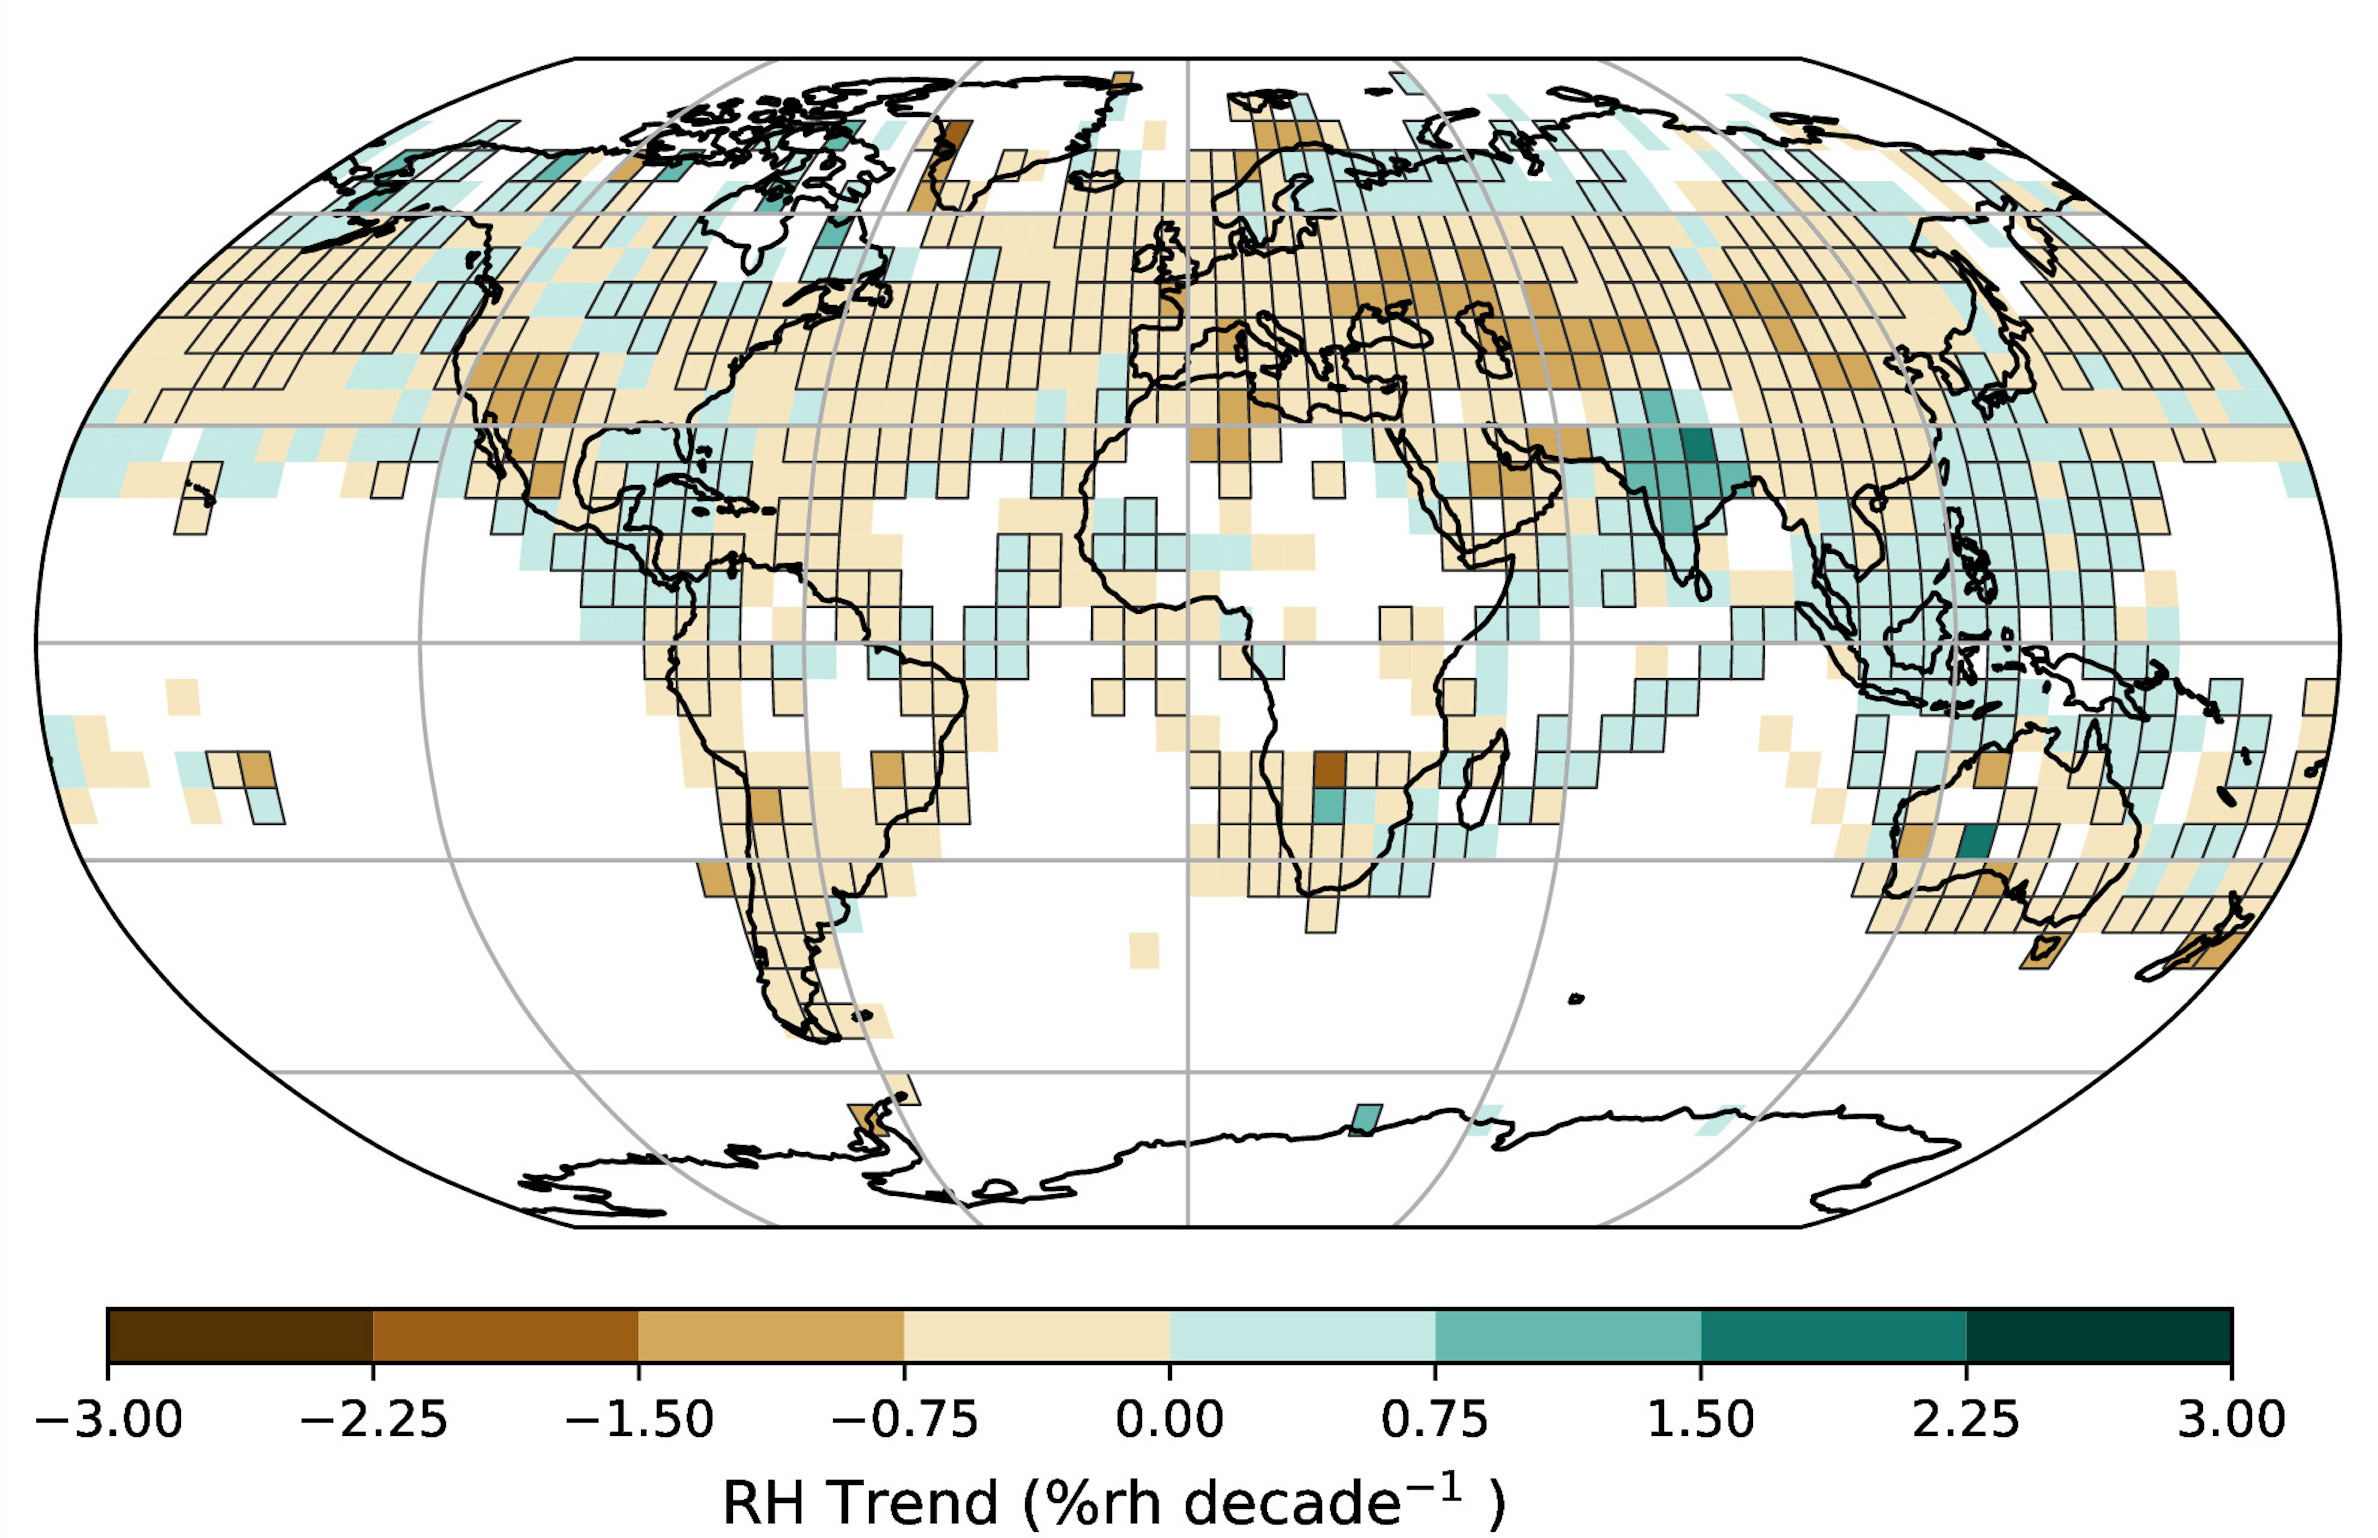
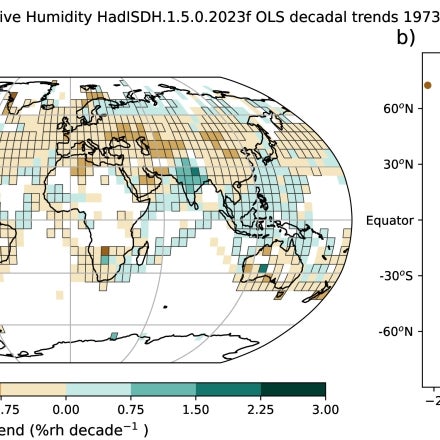
Decadal trends in relative humidity from 1973-2023 for monthly mean climate anomalies relative to 1991-2020. Trends are fitted using OLS regression with AR(1) correction for the confidence intervals. Black dots show trends that are considered to be significantly different from a zero trend where the 5th and 95th confidence intervals are in the same direction.

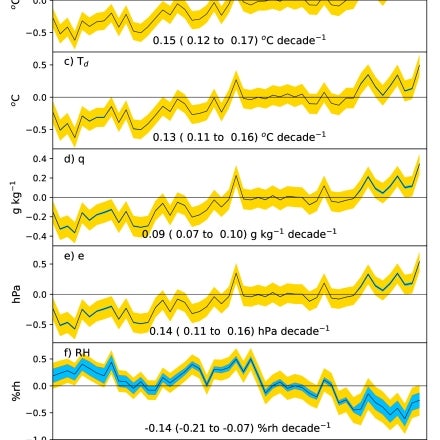
Global (60S to 60N) average time series for all variables in HadISDH for with combined uncertainties
broken down by coverage (gold), temporal sampling (red) and station (blue). Decadal trends
are shown with 5th to 95th percentile confidence intervals, fitted using OLS regression with
AR(1) correction on the confidence intervals.