Lake Water Storage: GloLakes

Lakes and reservoirs are critical components of the hydrological cycle, particularly due to their central role in many human systems. Long-term measurements of lakes is critical for understanding the dynamics linking lake volume to the climate system and human activities. The GloLakes dataset utilities remote sensing data to provide near real-time monitoring of the absolute and relative water storage in over 27,000 lakes worldwide from 1984-present. The data is presented at monthly time resolution and is suitable for long-term variability and change studies and can be easily viewed and downloaded through an operationally updated web portal.
Key Strengths
Global Coverage: The GloLakes database provides global coverage at monthly temporal resolution through over 27,000 lakes
Long Record to Present: The database begins at 1984 and provides near real-time updates, containing over 40 years of records for long-term studies.
Integration with Exising Data Standards: GloLakes shares metadata with HydroLAKES, allowing the data to be used with a wide variety of hydrological datasets.
Key Limitations
Lake Size: Only lakes with extend greater than 1 km² are documented due to limitations in the spatial resolution of remote sensing data.
Temporal Gaps: There can be gaps in time series, primarily due to cloud cover of the remote sensing images. These are most notable prior to 2000.
Lagged updates: The frequency of updates is limited by satellite revisit times, ranging from 5 to 91 days.
If you use this dataset, please include the following citation in your publication:
Hou, J., Van Dijk, A. I. J. M., Renzullo, L. J., and Larraondo, P. R.: GloLakes: water storage dynamics for 27000 lakes globally from 1984 to present derived from satellite altimetry and optical imaging, Earth Syst. Sci. Data, 16, 201218, https://doi.org/10.5194/essd-16-201-2024, 2024.
Expert Developer Guidance
The following was submitted by Dr. Jiawei Hou, July, 2025:
What are the key strengths of this data set?
The GloLakes dataset provides time series of both relative water storage (i.e., changes in storage between observation times) and absolute water storage (i.e., total stored volume over time) for more than 27,000 lakes worldwide.
This dataset is built on comprehensive satellite sources, including G-REALM (Topex/Poseidon [1992–2002]; Jason-1, Jason-2, and Jason-3 [2002–present]; Sentinel-6/Jason-CS [2020–present]; and Sentinel-3A and 3B [2016–present]), BLUEDOT (Sentinel-2 [2016-present]), ICESat-2 ([2018-present]), and GSWD (Landsat [1984-2020]). While relative water storage can be directly estimated using satellite-derived surface water height and extent, absolute water storage is more challenging to determine because satellites cannot directly measure lake bathymetry. GloLakes addresses this challenge by integrating altimetry, optical data, and a geostatistical model to infer total stored volume.
GloLakes offers estimates of lake water storage dynamics from 1984 to the present, with updates incorporating new satellite imagery to support near-real-time monitoring. The wide distribution of these monitored lakes across nearly all river basins makes GloLakes a critical dataset for global applications.
GloLakes can be seamlessly linked to HydroLAKES using shared ID attributes, enabling integrated analyses and consistent referencing with HydroLAKES and any other dataset connected to it.
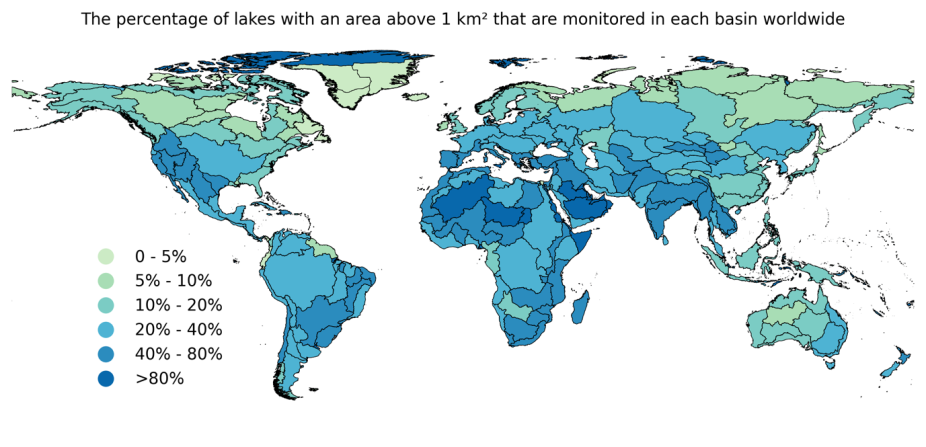
Figure 1: The global coverage of the GloLakes database potted by hydrological basin. Note that the percentage of lakes, not the absolute number of lakes, is shown for each basin.
J. Hou
What are the key limitations of this data set?
The temporal frequency of near-real-time monitoring for each lake is limited by the revisit times of the satellite data used (e.g., approximately 5 days with Sentinel-2, 10 to 27 days with G-REALM, and 91 days with ICESat-2).
Additionally, GloLakes does not include lakes with an extent below 1 km² due to limitations in the geostatistical modeling approach and the spatial resolution of the satellite data.
There are gaps in the Landsat-derived historical water storage time series due to cloud cover and atmospheric interference, particularly before 2000. Although we applied a gap-filling method to address missing data in the Landsat images, some periods have no valid observations at all, making gap-filling impossible for those intervals.
What are the typical research applications of this data set?
Typical research applications of the GloLakes dataset span a wide range of disciplines and scales. Hydrologists and climate scientists use it to track long-term trends and seasonal variations in lake storage from global to regional levels, helping to close basin-scale water budgets and improve understanding of drought and flood dynamics. It can also support the decoupling of surface water storage dynamics from GRACE terrestrial water storage estimates, allowing researchers to isolate and better understand changes in other components of the terrestrial water budget, such as groundwater, and soil moisture.
The dataset supports analyses of climate variability, such as responses to ENSO events and broader climate change impacts on freshwater resources. It is also valuable for water resource management, enabling better planning for reservoir operations and transboundary water governance. Additionally, the data serve as a benchmark for evaluating and calibrating hydrological and Earth system models. In ecology and conservation, researchers can use GloLakes to investigate habitat changes, wetland dynamics, and the impacts of hydrological variability on biodiversity, making it a critical tool for interdisciplinary environmental research and decision-making.
What are the most common mistakes that users encounter when processing or interpreting these data?
When calculating total lake water storage, users should pay careful attention to gaps in the water storage time series. We recommend either selecting only lakes with complete time series for the period of interest or applying a robust gap-filling method before calculating total storage.
For large-scale analyses, users should also be aware that the current version of GloLakes provides water storage estimates for lakes with extents between 1 and 500 km², which are feasible to monitor using the available methods. However, trends or variability in total water storage may be strongly influenced by large lakes. Excluding lakes with extents above 500 km² may therefore lead to incomplete results for analyses at global or basin scales. In the new version of the dataset, we include water storage dynamics for large lakes (>500 km²). Please contact the authors if you would like access to these data—it is often preferable to establish a collaboration for such use cases.
We did estimate water storage dynamics from 1984 to 2020 for more than 170,000 lakes worldwide. However, we applied selection criteria to identify lakes that can be reliably monitored using optical imagery and altimetry, based on the robustness of the relationship between satellite-derived height and extent. This resulted in the monitoring of over 27,000 lakes in the GloLakes dataset. If users wish to examine the full global dataset and are prepared to accommodate the associated uncertainties, they are encouraged to contact the authors—such use is often best supported through collaboration.
What are some comparable data sets, if any?
None
How is uncertainty characterized in these data?
The historical water storage estimates rely on water extent data derived from Landsat observations, which have inherent limitations—notably the influence of cloud cover, atmospheric interference, and, to a lesser extent, vegetation. Additionally, uncertainties may also arise from the surface water classification algorithm used in the GSWD product.
Because satellites cannot directly measure lake bathymetry and no global in-situ bathymetry dataset is available, a geostatistical model is used to estimate total water storage for each lake, which may introduce uncertainties and potential errors. Another source of uncertainty comes from the volume–elevation–extent relationship used to extrapolate water storage estimates during certain periods. To help users assess reliability, the data quality is labelled as Q1, Q2, Q3 or Q4, indicating the method used and the associated confidence level for each period.
How useful are these data for characterizing means as well as extremes?
GloLakes performs well for both mean and extreme characterisation, though with some distinctions. For long-term means and seasonal averages, the dataset provides reliable estimates given its multi-decade record. For extremes, the data effectively capture storage anomalies during drought and flood periods, though the ability to detect very rapid onset or short-duration extreme events depends on the temporal resolution available for each specific lake and time period. The quality flags (Q1-Q4) help users assess the reliability of extreme value detection for different periods and locations.
How does one best compare these data with model output?
Model outputs are typically provided as gridded data, while GloLakes offers lake-specific (point) estimates. To enable meaningful comparisons, it is recommended to aggregate lake water storage estimates within hydrological units such as basins and catchments. This approach aligns the spatial scale of observations with model representations, supporting direct validation and calibration.
Are there spurious (non-climatic) features in the temporal record?
The historical data is primarily driven by surface water extent dynamics derived from optical imagery, while the near-real-time data relies more heavily on surface water height measurements from satellite altimetry. This difference in primary data sources can lead to inconsistent amplification or scaling of storage variations between the two periods, as extent and height respond differently to storage changes. Users should be aware of these methodological differences when analyzing long-term trends or combining the historical and near-real-time records, and consider the associated uncertainties and potential biases in their interpretations.
How do I access these data?
The GloLakes data are publicly available via the NCI THREDDS Data Server at https://doi.org/10.25914/K8ZF-6G46. The archive includes five datasets derived from different satellite sources, offering flexibility for various research needs. Users can access the data directly using OPeNDAP for seamless integration into analysis workflows, or download files via the HTTPServer for local use.
How frequently are the data updated?
GloLakes is routinely updated on a daily schedule in terms of data processing and platform availability; however, this does not mean new satellite observations are available every day for every lake. Instead, updates incorporate new imagery as it becomes available—typically limited by satellite revisit intervals and further constrained by factors such as cloud cover and atmospheric conditions. As a result, while the system can process and publish new data daily, the effective temporal resolution of observations for any given lake depends on satellite overpass frequency and data quality. This approach still supports near-real-time monitoring by ensuring the most recent observations are integrated as soon as possible, even though actual observation intervals vary by region and time.
Can you recommend any cloud platforms and/or online plotting tools where one can visualize and interact with these data?
GloLakes data can also be accessed and visualized through the web-based Global Water Monitor (GWM) Data Explorer. Users can view the Global Water Monitor Annual Report for the previous year, typically released in the first week of the new year. This report provides a comprehensive global summary of precipitation, air temperature and humidity, soil water, surface water, river flow, lake and reservoir storage, vegetation vigour, and terrestrial water storage. It also highlights water-related hazards at a global scale.
By clicking “Launch Data Explorer,” users can interact with all of these water datasets in customizable ways. For lakes and reservoirs (i.e., GloLakes), users can click on a lake or reservoir on the map to view time-series plots of water storage dynamics (see Fig. 2). Additionally, users can configure custom parameters to examine changes in water storage across different basins, catchments, countries, or states/provinces over time (see Fig. 3).
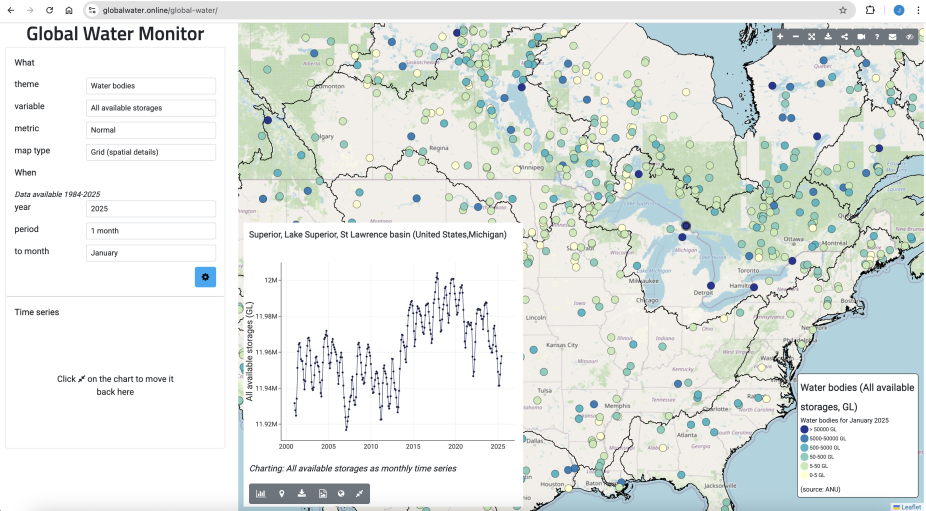
Figure 2: The GloLakes view on the Global Water Monitor Data Explorer. In this view, the location and series of individual lakes can be easily viewed and downloaded.
J. Hou
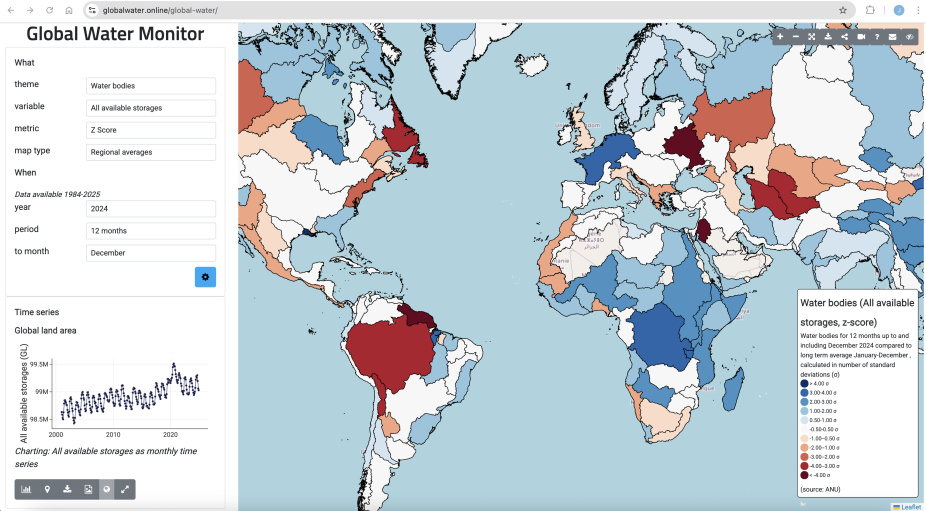
Figure 3: The GloLakes view on the Global Water Monitor Data Explorer. In this view, the averages across hydrological basins can be easily viewed and downloaded.
J. Hou
References
Hou, J., Van Dijk, A. I., Renzullo, L. J., & Larraondo, P. R. (2024). GloLakes: water storage dynamics for 27000 lakes globally from 1984 to present derived from satellite altimetry and optical imaging. Earth System Science Data, 16(1), 201-218. https://doi.org/10.5194/essd-16-201-2024
Hou, J., van Dijk, A. I. J. M., Beck, H. E., Renzullo, L. J., and Wada, Y.: Remotely sensed reservoir water storage dynamics (1984–2015) and the influence of climate variability and management at a global scale, Hydrol. Earth Syst. Sci., 26, 3785–3803, https://doi.org/10.5194/hess-26-3785-2022, 2022.
Birkett, C. M., Reynolds, C., Beckley, B., and Doorn, B.: From Research to Operations: The USDA Global Reservoir and Lake Monitor, chapter 2, in: Coastal Altimetry, edited by: Vignudelli, S., Kostianoy, A. G., Cipollini, P., and Benveniste, J., Springer Publications, ISBN 978-3-642-12795-3, 2010. https://doi.org/10.1007/978-3-642-12796-0_2
Markus, T., Neumann, T., Martino, A., Abdalati, W., Brunt, K., Csatho, B., Farrell, S., Fricker, H., Gardner, A., Harding, D.,Jasinski, M., Kwok, R., Magruder, L., Lubin, D., Luthcke, S., Morison, J., Nelson, R., Neuenschwander, A., Palm, S., Popescu, S., Shum, C., Schutz, B. E., Smith, B., Yang, Y., and Zwally, J.: The Ice, Cloud, and land Elevation Satellite-2 (ICESat-2): Science requirements, concept, and implementation, Remote Sens. Environ., 190, 260–273, https://doi.org/10.1016/j.rse.2016.12.029, 2017.
Pekel, J.-F., Cottam, A., Gorelick, N., and Belward, A. S.: High-resolution mapping of global surface water and its long-term changes, Nature, 540, 418–422, https://doi.org/10.1038/nature20584, 2016.
Jasinski, M. F., Stoll, J. D., Hancock III, D. W., Robbins, J., Nattala, J., Pavelsky, T. M., Morison, J., Jones, B. M., Ondrusek, M. E., Parrish, C., Carabajal, C., and the ICESat-2 Science Team: ATLAS/ICESat-2 L3A Along Track Inland Surface Water Data, Version 6. Boulder, Colorado USA. NASA National Snow and Ice Data Center Distributed Active Archive Center [data set], https://doi.org/10.5067/ATLAS/ATL13.006, 2023.
Messager, M. L., Lehner, B., Grill, G., Nedeva, I., and Schmitt, O.: Estimating the volume and age of water stored in global lakes using a geo-statistical approach, Nat. Commun., 7, 13603, https://doi.org/10.1038/ncomms13603, 2016.
Cite this page
Acknowledgement of any material taken from or knowledge gained from this page is appreciated:
National Center for Atmospheric Research Staff (Eds). Last modified "The Climate Data Guide: Lake Water Storage: GloLakes.” Retrieved from https://climatedataguide.ucar.edu/climate-data/lake-water-storage-glolakes on 2026-07-15.
Citation of datasets is separate and should be done according to the data providers' instructions. If known to us, data citation instructions are given in the Data Access section, above.
Acknowledgement of the Climate Data Guide project is also appreciated:
Schneider, D. P., C. Deser, J. Fasullo, and K. E. Trenberth, 2013: Climate Data Guide Spurs Discovery and Understanding. Eos Trans. AGU, 94, 121–122, https://doi.org/10.1002/2013eo130001