NASA's MERRA2 reanalysis

The Modern-Era Retrospective analysis for Research and Applications, version 2 (MERRA-2) is a global atmospheric reanalysis produced by the NASA Global Modeling and Assimilation Office (GMAO). It spans the satellite observing era from 1980 to the present. The goals of MERRA-2 are to provide a regularly-gridded, homogeneous record of the global atmosphere, and to incorporate additional aspects of the climate system including trace gas constituents (stratospheric ozone), and improved land surface representation, and cryospheric processes. MERRA-2 is also the first satellite-era global reanalysis to assimilate space-based observations of aerosols and represent their interactions with other physical processes in the climate system. The inclusion of these additional components are consistent with the overall objectives of an Integrated Earth System Analysis (IESA).
MERRA-2 is intended to replace the original MERRA product, and reflects recent advances in atmospheric modeling and data assimilation. Modern hyperspectral radiance and microwave observations, along with GPS-Radio Occultation and NASA ozone datasets are now assimilated in MERRA-2. Much of the structure of the data files remains the same in MERRA-2. While the original MERRA data format was HDF-EOS, the MERRA-2 supplied binary data format is now NetCDF4 (with lossy compression to save space). (text credit: Richard Cullather and Michael Bosilovich).
Key Strengths
High spatial (½° latitude by ⅝° longitude by 72 model levels ) and temporal (hourly) resolution
Incorporates observations from more recent satellite instruments
Improved estimates of surface mass balance and surface temperatures over ice sheets
Key Limitations
Discontinuities occur in the sea ice and SST boundary condition fields that affect certain time series analysis
Discontinuities associated with major observing system variations do occur
Precipitation is thought to be too large over polar oceans, and is excessive over high topography in tropical latitudes
Expert Developer Guidance
The following was contributed by Richard Cullather and Michael Bosilovich (NASA/GMAO), November, 2017:
MERRA-2 (Gelaro et al. 2017) is composed of the Goddard Earth Observing System Atmospheric Data Assimilation System (GEOS ADAS), which incorporates the Global Statistical Interpolation (GSI) analysis scheme of Wu et al. (2002). The system utilizes a revised version of the GEOS global atmospheric model (Molod et al., 2014). A fundamental motive for replacing MERRA with MERRA-2 is that MERRA (c. 2008 vintage) is not capable of assimilating important new data types, and the aging and failure of older satellite instruments greatly reduced the data volume available for assimilation for the earlier reanalysis. MERRA-2’s GEOS system (version 5.12.4) is able to assimilate data from the newer microwave instruments and from hyperspectral infrared radiance instruments.
While coarse-resolution data sets were used to conserve data volume in MERRA, all output data collections from MERRA-2 are provided on the same global grid (½° latitude × ⅝° longitude). The GEOS model used in MERRA-2 performs computations on a cubed-sphere grid that allows for a better representation of dynamical processes in high latitudes. The distributed data collections are spatially interpolated to the latitude-longitude grid, for the convenience of users. There are no changes in the vertical grids used: variables are provided on either the native model vertical grid (at 72 hybrid-sigma layers or 73 edges), or interpolated to 42 standard pressure levels.
There is a fundamental change between MERRA and MERRA-2 over land surfaces. Soil moisture in MERRA-2 is initialized using a separate observation-based precipitation product (variable PRECTOTCORR in “flx” collections). This approach improves the representation of land surface properties and runoff, and is similar to the soil moisture initialization scheme developed for MERRA-Land (Reichle et al., 2011; Reichle, 2012; Reichle and Liu, 2014). The forcing precipitation is primarily based on gauge observations at low and midlatitudes, and gradually tapers to the MERRA-2 modeled precipitation over a zonal range from 42.5° to 62.5° latitude. The forcing precipitation is entirely composed of the MERRA-2 modeled precipitation poleward of 62.5°. Due to gauge scarcity, the NOAA CPC Merged Analysis of Precipitation (CMAP) gauge-satellite product is substituted for the soil moisture initialization over Africa (see Reichle et al 2017). The use of a separate precipitation product for soil moisture initialization affects mass balance, as the difference between the observation-based and model-generated precipitation affects the water budget when the land and atmosphere budgets are combined.
The incorporation of satellite-observed aerosols in MERRA-2 is based on the “MERRAero” off-line product that was produced using meteorological fields from the original MERRA. MERRA-2 aerosol variables are included in additional file collections, which use the tags “aer”, “adg”, and “gas” in their file names, similarly to the MERRAero data file (da Silva et al., 2015). MERRA-2 aerosol assimilation is documented by Randles et al (2016). Reflecting the broader scope of the assimilation system, there are several other new file collections. MERRA-2 includes a mass balance over glaciated land surfaces including Greenland and Antarctica, which is written in the GLC collection. These variables reflect an updated representation of processes over glaciated land surfaces which include fractional snow cover, meltwater percolation and refreezing, runoff, a prognostic surface albedo, and the vertical conduction of heat within the glacier surface (Cullather et al., 2014). Several surface variables have additional daily statistics written in a separate variable collection called statD. This includes the maximum and minimum daily two-meter temperature, captured at the model time step, between 00:00 UTC and 23:59 UTC every day. The GEOS model also includes the Observations Simulator Package from the Cloud Feedback Model Intercomparison Program (CFMIP COSP). COSP output for ISCCP and MODIS is provided in the CSP collection.
Questions regarding MERRA-2 science, modeling and data assimilation should be sent to: merra-questions@lists.nasa.gov.
Information on MERRA-2 data files can be found in Bosilovich et al. (2016), including information on how to cite the data itself where all data collections have a DOI. Also, the MERRA-2 budget equations are outlined there.
Key Strengths
GMAO reanalyses allow for
- Analysis increment system provides hourly data
- Finite-volume representation of topography (not spectral)
- Access to analysis increments for budget computations
The MERRA-2 system:
- Incorporates observations from more recent satellite instruments
- More consistent time series using global mass balance constraint
- Observation corrected precipitation forcing for the land surface
- Inclusion of stratospheric ozone products
- Use of assimilated interactive aerosols and observed time varying emissions
- Improved estimates of surface mass balance and surface temperatures over ice sheets
- Use of daily sea ice and SST fields (rather than weekly in the original MERRA)
Key Limitations
- Sea ice and SST boundary forcing fields contain discontinuities that affect certain time series analysis (Bosilovich et al. 2015, Section 8):
○ AMIP II boundary fields (Taylor et al., 2000), 1980 - 1981
○ Reynolds et al. (2007), 1982 - March 2006
○ OSTIA, April 2006 - present
- Several abrupt changes in local sea ice cover, perhaps associated with satellite data quality, have been noted:
○ 12/31/1981 - 01/01/1982, Southern Hemis.
○ 03/07/2007 - 03/09/2007, NH, SH
○ 10/04/2009 - 10/05/2009, SH
○ 04/23/2012 - 04/24/2012, SH
○ 01/19/2013 - 01/20/2013, NH
○ 08/13/2013 - 08/14/2013, SH
○ 02/20/2014 - 02/21/2014, NH
○ 05/10/2014 - 05/11/2014, NH, SH
○ 06/30/2015 - 07/01/2015, NH, SH
○ 09/15/2015 - 09/16/2015, SH
○ 10/13/2015, 10/15/2015, SH
○ 04/06/2016 - 04/11/2016, NH
- Regional discontinuities associated with major observing system variations do occur
- Reanalysis divided into 4 streams (with breaks occurring at 1990-91, 2000-2001, and 2010-2011), which produce discontinuities for deep soil layers
- Precipitation is thought to be too large over polar oceans, and is excessive over high topography in tropical latitudes
- TOA net global energy is too low in the 2000s owing to too much reflected SW radiation; before that is a downward trend in reflected SW as more water vapor observations are assimilated; regionally this is dominated by the SH storm track in DJF
- Does not directly assimilate observed 2m air temperature
##
Cite this page
Acknowledgement of any material taken from or knowledge gained from this page is appreciated:
Bosilovich, Michael &, Cullather, Richard & National Center for Atmospheric Research Staff (Eds). Last modified "The Climate Data Guide: NASA's MERRA2 reanalysis.” Retrieved from https://climatedataguide.ucar.edu/climate-data/nasas-merra2-reanalysis on 2026-06-07.
Citation of datasets is separate and should be done according to the data providers' instructions. If known to us, data citation instructions are given in the Data Access section, above.
Acknowledgement of the Climate Data Guide project is also appreciated:
Schneider, D. P., C. Deser, J. Fasullo, and K. E. Trenberth, 2013: Climate Data Guide Spurs Discovery and Understanding. Eos Trans. AGU, 94, 121–122, https://doi.org/10.1002/2013eo130001
Key Figures
MERRA-2 infographic. (contributed by R Cullather)
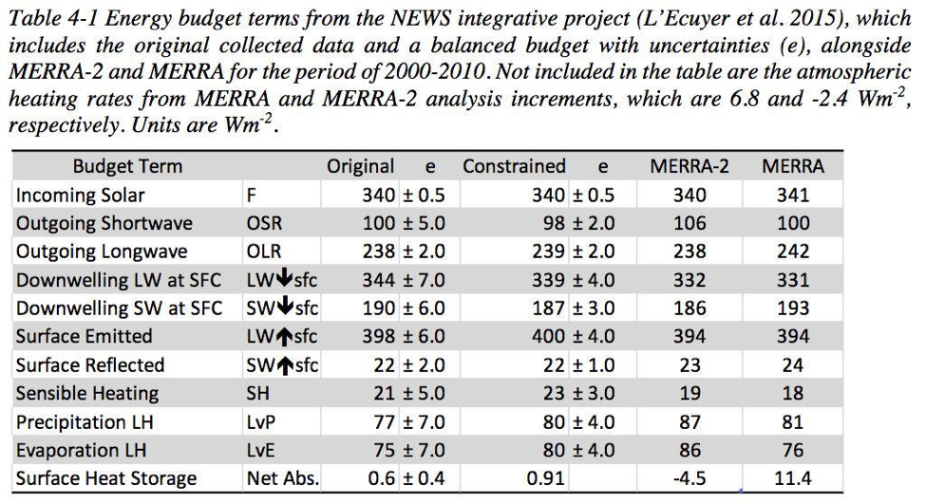
Figure 2 Terms of the MERRA-2 energy budget compared with MERRA and merged observed satellite data (excerpt from Bosilovich et al 2016). (contributed by R Cullather)
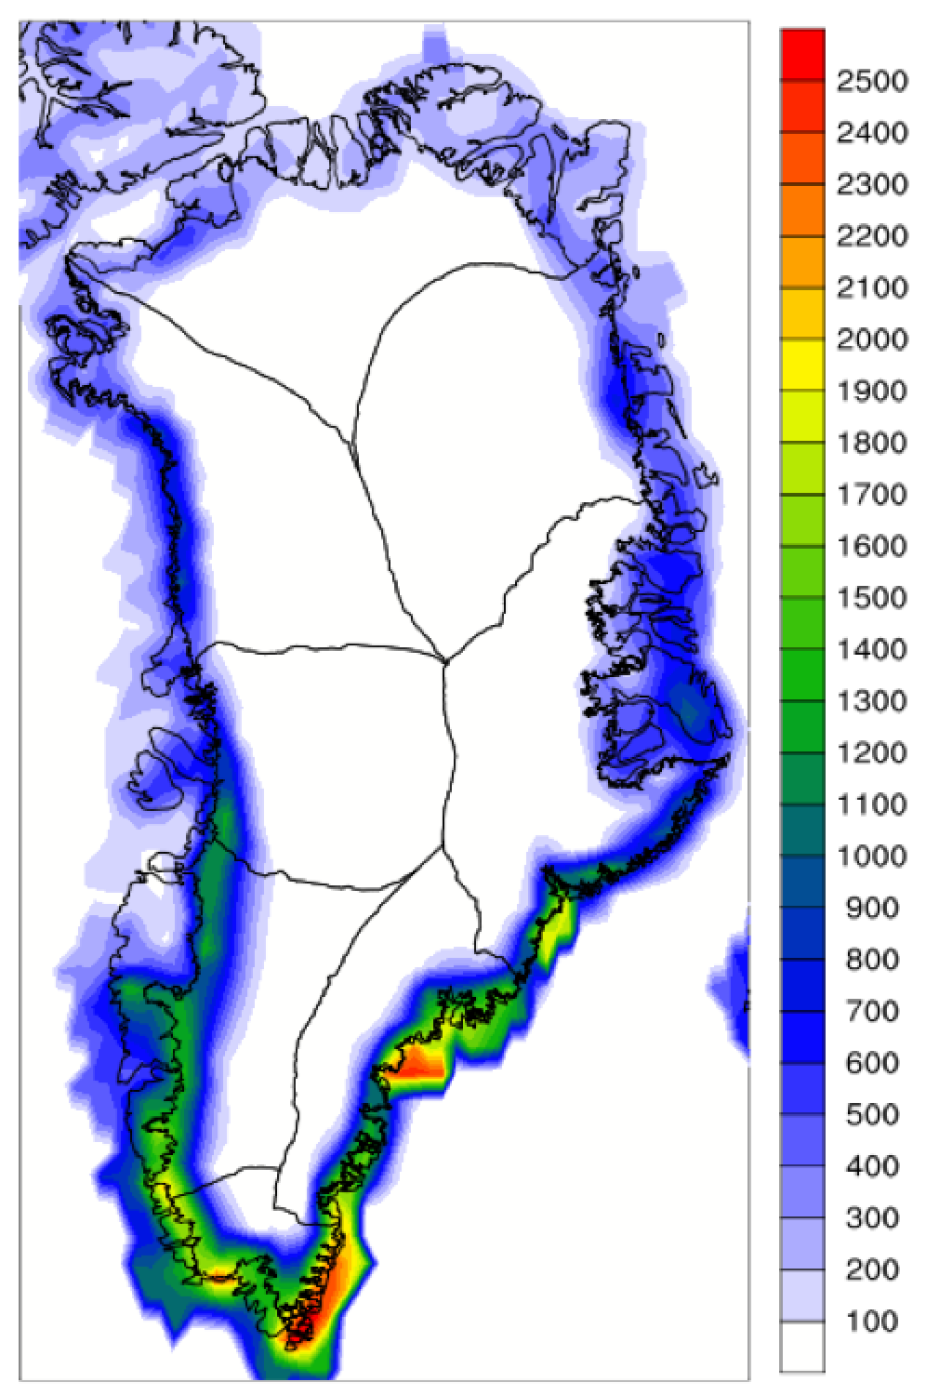
MERRA-2 1980-2016 average Greenland Ice Sheet annual runoff, in mm w.e. yr-1. (contributed by R Cullather)
Other Information
- Koster, Randal D. Bosilovich. 2015. Technical Report Series on Global Modeling and Data Assimilation, Volume 43. MERRA-2; Initial Evaluation of the Climate. Catalog: NASA NTRS
- Molod, A., Takacs, L., Suarez, M., Bacmeister, J.. 2015. Development of the GEOS-5 atmospheric general circulation model: evolution from MERRA to MERRA2. Geoscientific Model Development. Vol. 8, No. 5, pp. 1339-1356. DOI: 10.5194/gmd-8-1339-2015
- Randles, C. A., et al. 2017. The MERRA-2 Aerosol Reanalysis, 1980 Onward. Part I: System Description and Data Assimilation Evaluation. Journal of Climate. Vol. 30, No. 17, pp. 6823-6850. DOI: 10.1175/JCLI-D-16-0609.1 ISSN: 0894-8755, 1520-0442
- Gelaro, R. et al. 2017. The Modern-Era Retrospective Analysis for Research and Applications, Version 2 (MERRA-2). Journal of Climate. Vol. 30, No. 14, pp. 5419-5454. DOI: 10.1175/JCLI-D-16-0758.1 ISSN: 0894-8755
- Buchard, V. et al. 2017. The MERRA-2 Aerosol Reanalysis, 1980 Onward. Part II: Evaluation and Case Studies. Journal of Climate. Vol. 30, No. 17, pp. 6851-6872. DOI: 10.1175/JCLI-D-16-0613.1 ISSN: 0894-8755, 1520-0442.