Night Marine Air Temperature (NMAT) Datasets: CLASSnmat and UAHNMATv1
Night Marine Air Temperature (NMAT) refers to measurements of air temperature recorded with thermometers on the weather stations of ships. NMAT is a highly correlated variable with Sea Surface Temperature (SST), capturing the temperature of the atmosphere near the surface. The earliest known record of NMAT begins in 1699 with records expanding globally by the mid-1800s. Generally, only night observations of marine air temperature are used as there are substantial, and difficult to estimate, bias in temperature recorded by ships during the daytime due to the ship absorbing solar radiation and heating the nearby air.
There has been recent attention paid to NMAT as a potential variable to verify, bias-correct, and extend the global sea surface temperature record. Since NMAT is correlated with SST and ships are often recording both SST and NMAT measurements, the use of these variables together allow the verification and refinement of existing datasets. Similarly, datasets such as CLASSnmat and UAHNMATv1 discussed here provide estimates of global temperatures over the ocean independent of the SST record.
Key Strengths
Global, monthly records of 10m air temperature over the ocean from 1880 (CLASSnmat) and 1900 (UAHNMAT) to present
NMAT data are independent from SSTs products and can be used to verify trends and variability of SST.
NMAT measures the atmospheric component of air-sea interaction, enabling investigation of changes and variability in the coupled system.
Key Limitations
All measurements of NMAT come from ships—there is no equivalent buoy or float network as in SSTs. Thus, measurements are constrained to shipping lanes.
The data is not spatially complete as neither CLASSnmat nor UAHNMAT interpolate observations past their 5° grid cells
Corrections must be made to account for daytime heating of the ship as well as the height of the measured temperature, introducing bias and uncertainty.
(CLASSnmat) Cornes, R.C.; Cropper, T.; Kent, E.C. (2025): CLASSnmat version 2: monthly, global, gridded night marine air temperature data. NERC EDS Centre for Environmental Data Analysis, 14 May 2025. doi:10.5285/306246329ae04eb3b2299446d911530a.
(UAHNMATv1) Junod, R. A., & Christy, J. R. (2020). A new compilation of globally gridded night‐time marine air temperatures: The UAHNMATv1 dataset. International Journal of Climatology, 40(5), 2609-2623. https://doi.org/10.1002/joc.6354
Expert User Guidance
The following was contributed by Richard Cornes from the National Oceanography Centre, August 2025:
Overview and Strengths
Night Marine Air Temperature (NMAT) datasets provide some of the longest continuous records of near-surface air temperature over the global oceans. These records are based on thermometer measurements taken aboard ships. Because daytime readings are often affected by artificial warming from a ship’s superstructure (Figure 1), only nighttime observations are used—hence the term Night Marine Air Temperature.
Currently, two NMAT datasets are maintained and updated annually: CLASSnmat (Cornes et al., 2020) and UAHNMAT (Junod & Christy, 2020). CLASSnmat provides monthly gridded fields from 1880 to the present, incorporating adjustments for changing ship heights, duplicate observations, known historical biases (e.g., World War II-related), and includes uncertainty estimates. UAHNMATv1 spans 1900 to the present and, while generally consistent with CLASSnmat in terms of long-term global trends, exhibits regional and temporal differences due to its distinct homogenization and bias-correction methodology.
On large spatial and temporal scales, NMAT and Sea Surface Temperature (SST) are expected to be highly correlated (Kennedy et al., 2019). However, regional and episodic discrepancies between them capture important aspects of air–sea interaction. Moreover, while climate models and reanalyses estimate Global Surface Air Temperature (GSAT)—which includes air temperature over both land and ocean—observational datasets of Global Mean Surface Temperature (GMST) typically use SST for the ocean component. In this context, NMAT offers a more direct basis for evaluating modelled GSAT over the oceans, making it a valuable tool for climate model validation.
Limitations and Uncertainty
NMAT datasets remain fundamentally constrained by their reliance on ship-based measurements. Unlike SST records—which in recent decades have benefited from the expansion of drifting buoy networks, Argo floats, and satellite observations—NMAT has no comparable modern observing system. As a result, spatial coverage is sparser and largely confined to established shipping routes. Neither CLASSnmat nor UAHNMAT applies spatial interpolation, so 5° grid cells without shipboard thermometer observations remain unpopulated.
Compared with SST, NMAT generally requires more extensive—and sometimes poorly documented—corrections to the raw data (Rayner et al. 2003). Even when daytime values are excluded, residual ship-related effects can influence nighttime air temperatures: variable measurement height above sea level; changing ship design and deck layout; instrument type and screen/exposure; ventilation and airflow around the sensor; proximity to heat sources; observer practice; and route-specific microenvironments (Figure 1). Many of these factors evolved through time and are incompletely recorded, increasing uncertainty in NMAT adjustments. The dominant correction is for measurement height relative to sea level, supplemented by targeted adjustments for non-standard observing practices in specific regions and periods before the mid-20th century (Kent & Kennedy, 2021).
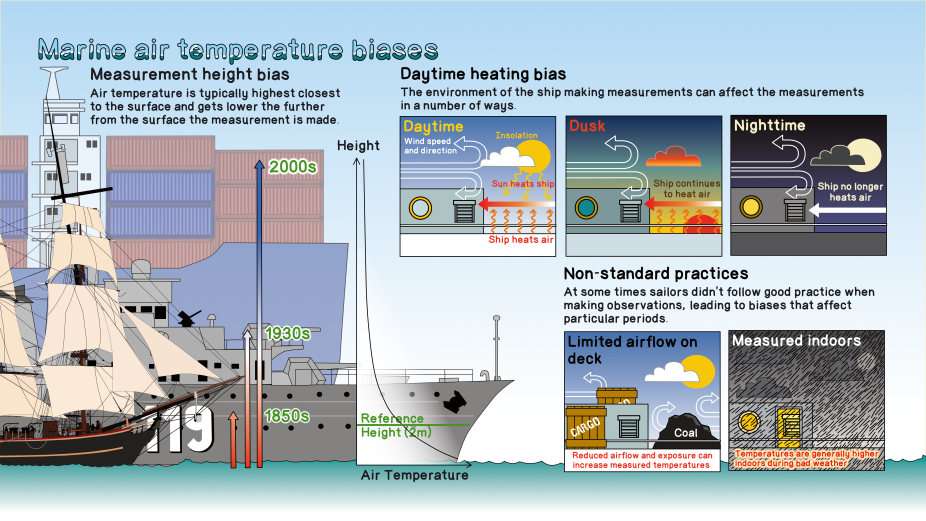
Figure 1: Changes in ship heights over time and their effect on measured air temperatures, highlighting the need to correct for height-related biases. Also shown are biases from solar heating, poor deck exposure, and indoor measurements, which can affect the accuracy of long-term marine temperature records.
J. Kennedy
NMAT observations are typically adjusted from their recorded ship height to a reference of 10 m above sea level. Both CLASSnmat and UAHNMAT provide 10 m fields, while CLASSnmat also offers 2 m and 20 m products. Uncertainty grows substantially at 2 m because of strong, non-linear temperature gradients in the lowest marine atmospheric boundary layer, so users should prefer 10 m for trend analysis and model comparison unless 2 m values are specifically required.
Uncertainty treatment differs slightly between datasets. Both CLASSnmat and UAHNMAT account for errors arising from height adjustments, random measurement noise, and sampling variability. CLASSnmat additionally includes correlated uncertainty terms, and in its latest release (v2) quantifies height-related uncertainty using an ensemble of realizations (Morice et al., 2025), making the propagation of adjustment uncertainty more explicit.
NMAT vs SST – Why Both Matter
NMAT and SST provide complementary datasets for assessing temperature across the marine domain. While NMAT data require more adjustments and are sparser in recent decades, they offer a direct measure of near-surface atmospheric conditions that aligns well with model outputs over the ocean. In contrast, SST offers broader coverage but reflects ocean surface conditions rather than the overlying air. Differences between NMAT and SST highlight key aspects of air–sea interactions. Notably, the observed trend of SST warming more rapidly than NMAT remains an unresolved issue in the climate record. Together, these datasets offer distinct but complementary insights, and using both is crucial for developing a robust understanding of long-term marine temperature changes.
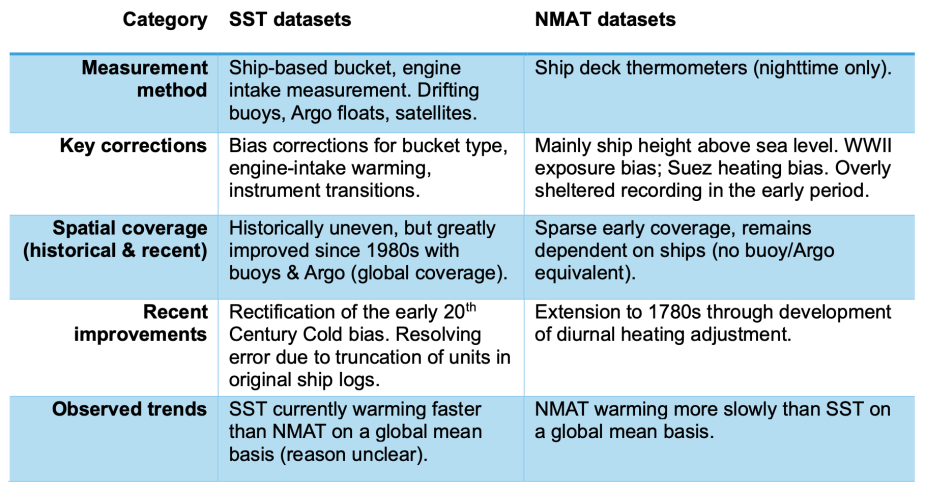
Figure 2: A Comparison of SST and NMAT datasets in their biases, coverage, and trends.
R. Cornes
Applications and Recent Advances
NMAT datasets are widely used to analyze long-term temperature trends over the oceans and assess the consistency of SST-based reconstructions. They provide an independent line of evidence for global climate assessments (e.g. Cornes et al. 2025a).
Recent advances through the GloSAT project have further enhanced their utility. By developing improved adjustments for daytime observations to correct diurnal heating biases, it has been possible to extend the marine air temperature record back to the 1780s. Studies by Cropper et al. (2023) and Morice et al. (2025) demonstrate how this extended record offers valuable insights into pre-industrial climate variability.
In addition, NMAT datasets have played an important role in constraining uncertainties in SST records. For example, they have been used to identify and adjust SST biases that remain poorly understood (Huang et al., 2025).
Differential Trends and Open Questions
As noted in Kennedy et al. (2019) and in subsequent work (e.g. Cornes et., 2021, Sidebar 2.1), SST is warming faster than NMAT on a global mean basis. The reasons for this divergence remain uncertain and are the subject of active research. It may reflect differences in measurement methods, coverage, or biases in either (or both) NMAT or SST that have not yet been fully resolved. The persistence of this discrepancy underscores the importance of maintaining NMAT alongside SST as an independent benchmark.
Dataset Access
CLASSnmat is distributed via the CEDA Archive (Cornes et al., 2025b), while UAHNMAT is hosted by the University of Alabama in Huntsville and NOAA PSL. The all-hours GloSATMAT dataset is also available from CEDA (Cornes et al., 2025c). Files are provided in NetCDF format, and the datasets are updated annually, usually in January.
References
- Cornes R.C., Kent E.C., Berry D.I., Kennedy J.J. (2020). CLASSnmat: A global night marine air temperature data set, 1880–2019. Geoscience Data Journal, doi: 10.1002/gdj3.100
- Cornes, R. C., D. I. Berry, R. Junod, E. C. Kent, N. A. Rayner (2021): Sidebar 2.1., Night marine air temperature [in “State of the Climate in 2020“]. Bull. Amer. Meteor. Soc., 102 (8), S39–S41, doi:10.1175/2021BAMSStateoftheClimate.1
- Cornes, R.C., Junod R. and Kent, E.C. (2025a). Night Marine Air Temperature [in “State of the Climate in 2024”]. Bull. Amer. Meteor. Soc., 102 (8), S31–S32, https://doi.org/10.1175/2025BAMSStateoftheClimate.1
- Cornes, R.C.; Cropper, T.; Kent, E.C. (2025b): CLASSnmat version 2: monthly, global, gridded night marine air temperature data. NERC EDS Centre for Environmental Data Analysis, 14 May 2025. doi:10.5285/306246329ae04eb3b2299446d911530a. https://dx.doi.org/10.5285/306246329ae04eb3b2299446d911530a
- Cornes, R.C.; Cropper, T.; Kent, E.C. (2025c): GloSATMAT: monthly, global, gridded marine air temperature data. NERC EDS Centre for Environmental Data Analysis, 14 May 2025. doi:10.5285/e6251bf935304cfbb9c9269dc7757a35. https://dx.doi.org/10.5285/e6251bf935304cfbb9c9269dc7757a35
- Cropper, T.E., Berry, D.I., Cornes, R.C., Kent, E.C. (2023) Quantifying Daytime Heating Biases in Marine Air Temperature Observations from Ships, Journal of Atmospheric and Oceanic Technology, 40, 427-438, doi: 10.1175/JTECH-D-22-0080.1
- Huang, B. et al, 2025: Extended Reconstructed Sea Surface Temperature, Version 6 (ERSSTv6). Part I: An Artificial Neural Network Approach. J. Climate, 38, 1105–1121, https://doi.org/10.1175/JCLI-D-23-0707.1
- Junod, R. A., & Christy, J. R. (2020). A new compilation of globally gridded night-time marine air temperatures: The UAHNMATv1 dataset. International Journal of Climatology, 40(5), 2609–2623. https://doi.org/10.1002/joc.6354
- Kent E.C., Kennedy J.J. (2021). Historical Estimates of Surface Marine Temperatures. Annual Review of Marine Science, doi: 10.1146/annurev-marine-042120-111807
- Kennedy, J. J., Rayner, N. A., Atkinson, C. P., & Killick, R. E. (2019). An ensemble data set of sea surface temperature change from 1850: The Met Office Hadley Centre HadSST.4.0.0.0 data set. Journal of Geophysical Research: Atmospheres, 124, 15302–15322. https://doi.org/10.1029/2018JD029867
- Morice, C. P., et al. : An observational record of global gridded near surface air temperature change over land and ocean from 1781, Earth Syst. Sci. Data Discuss., https://doi.org/10.5194/essd-2024-500, in review, 2025.
- Rayner, N. A., Parker, D. E., Horton, E. B., Folland, C. K., Alexander, L. V., Rowell, D. P., Kent, E. C., & Kaplan, A. (2003). Global analyses of sea surface temperature, sea ice, and night marine air temperature since the late nineteenth century. Journal of Geophysical Research: Atmospheres, 108(D14). doi:10.1029/2002jd002670
Cite this page
Acknowledgement of any material taken from or knowledge gained from this page is appreciated:
Cornes, Richard & National Center for Atmospheric Research Staff (Eds). Last modified "The Climate Data Guide: Night Marine Air Temperature (NMAT) Datasets: CLASSnmat and UAHNMATv1.” Retrieved from https://climatedataguide.ucar.edu/climate-data/night-marine-air-temperature-nmat-datasets-classnmat-and-uahnmatv1 on 2026-07-15.
Citation of datasets is separate and should be done according to the data providers' instructions. If known to us, data citation instructions are given in the Data Access section, above.
Acknowledgement of the Climate Data Guide project is also appreciated:
Schneider, D. P., C. Deser, J. Fasullo, and K. E. Trenberth, 2013: Climate Data Guide Spurs Discovery and Understanding. Eos Trans. AGU, 94, 121–122, https://doi.org/10.1002/2013eo130001
Key Figures

Figure 1: Changes in ship heights over time and their effect on measured air temperatures, highlighting the need to correct for height-related biases. Also shown are biases from solar heating, poor deck exposure, and indoor measurements, which can affect the accuracy of long-term marine temperature records.

Figure 2: A Comparison of SST and NMAT datasets in their biases, coverage, and trends.