Global Temperature Data Sets: Overview & Comparison Table
Global surface temperature data sets are an essential resource for monitoring and understanding climate variability and long-term trends. The most commonly used data sets combine historical observations of near surface air temperatures at land stations with global data sets of sea surface temperatures (SST) obtained from a changing mix of ship-based and buoy measurements. While the concept of these data sets is fairly simple, their construction is challenging due to difficulties in obtaining data, documenting and accounting for changes in instrumentation and observing practices, addressing changes in station location and local land use, understanding random measurement errors, and deciding where and how to infill missing data in space and time.
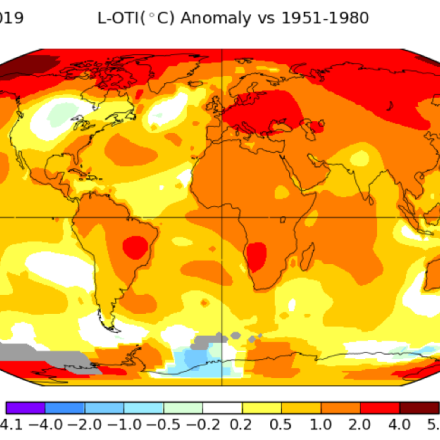
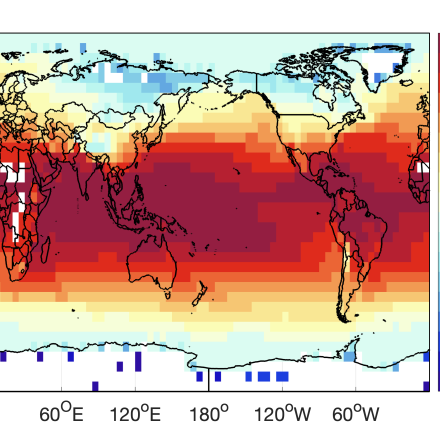
The four most highly cited data sets are NOAA's GlobalTemp (Formerly MLOST), NASA's GISTEMP, Berkeley Earth, and the UK's HadCRUT. HadCRUT also has a land-only version, CRUTEM. In addition, a state-of-the art dataset, the The Dynamically Consistent ENsemble of Temperature (DCENT) was released in 2024. Each group has approached the above challenges somewhat differently. The final data sets differ in their spatial coverage, spatial resolution, starting year, and degree of interpolation (DCENT is the only major uninterpolated product). Most of these data sets are presented as anomalies (departures from baseline, long-term mean temperatures); only the Berkeley Earth data provide absolute temperatures for each timestep, while the other projects provide a baseline climatology to which the anomalies may be compared. Numerous comparisons of global and hemispheric mean temperature anomaly timeseries calculated from these data sets have been made, showing highly consistent variations and trends. Nonetheless, users doing more analysis than the global mean temperature will find important distinctions among the data sets.
Besides the in-situ based data sets summarized here, other estimates of global temperatures (since the 1970s) are based on satellite measurements such as from the MSU and AIRS instruments, or on atmospheric reanalyses.
It is best practice to use multiple products as well as incorporate their uncertainty estimates in any analyses involving surface temperature. In addition, recent science suggests that there are biases in the sea surface temperature record in the first half of the 20th century that are not fully accounted for in existing products (see Sippel et al. 2024 or the more accessible news piece for more information).
Key Figures
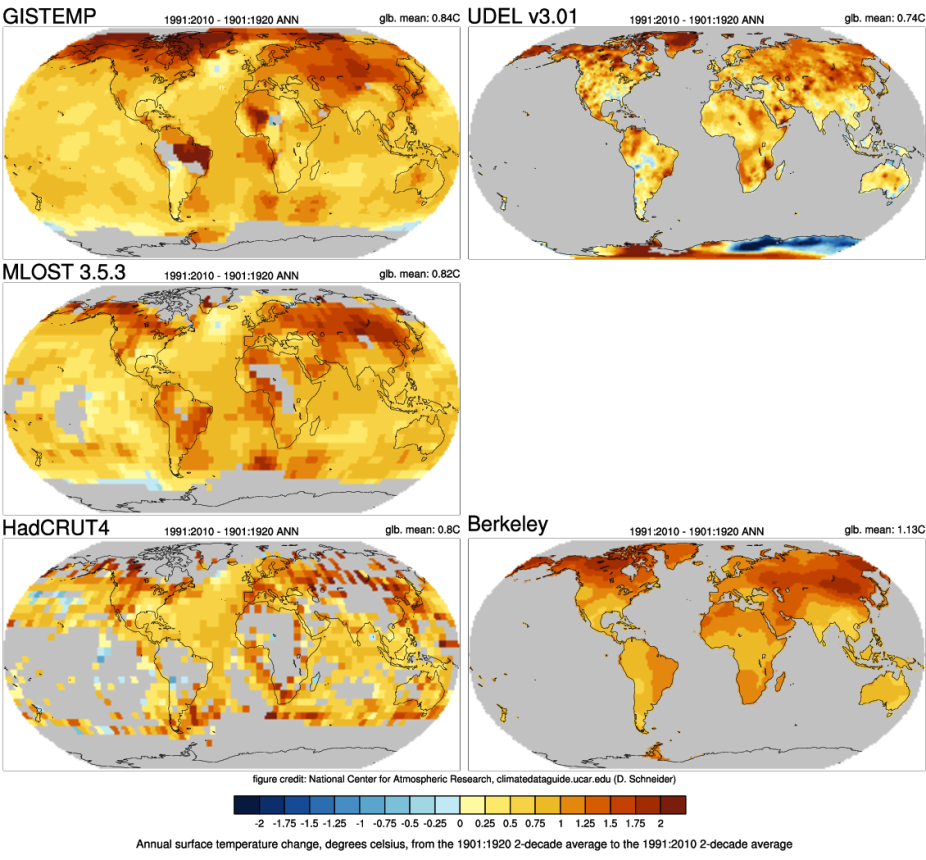
Change of mean annual surface temperatures in 5 global, gridded data sets. Calculated as the difference of means of the 1991:2010 period and the 1901:1920 period. Credit: NCAR Climate Data Guide (D. Schneider).
Other Information
Summary of global surface temperature datasets
| Name | Temperature Change | Climatology | Source | Years of record | Timestep | Spatial Resolution | Input Data |
|---|---|---|---|---|---|---|---|
| Global land-ocean surface temperature data: HadCRUT5 | 
|
|
UK Met Office Hadley Centre and Climatic Research Unit, University of East Anglia | to | Monthly | 5° x 5° | HadSST4 and CRUTEM5 |
| Global surface temperature data: GISTEMP: NASA Goddard Institute for Space Studies (GISS) Surface Temperature Analysis | 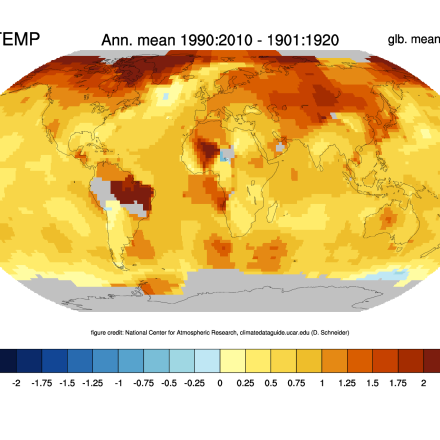
|
|
NASA GISS / G.A. Schmidt, R. Reudy, M. Sato, K. Lo, N. Lenssen formerly J. Hansen | to | Monthly | 2x2 degree | GHCN v4 (~6300 land stations); ERSSTv5 (SSTs); SCAR READER (for Antarctic stations) |
| Global surface temperature data: MLOST: NOAA Merged Land-Ocean Surface Temperature Analysis | 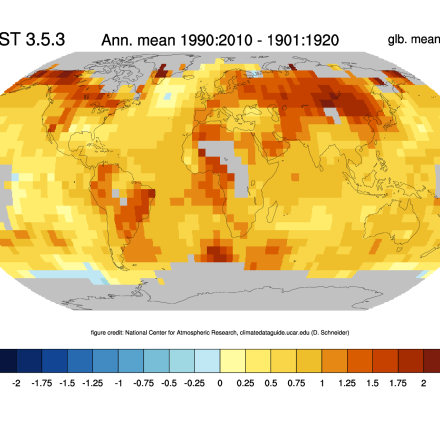
|
NOAA NCDC / RS Vose and others | to | Monthly | 5x5 degrees | GHCN v3.3 (~7000 land stations); ERSSTv3b (SSTs) |
|
| Global surface temperature data: The Dynamically Consistent ENsemble of Temperature (DCENT) | 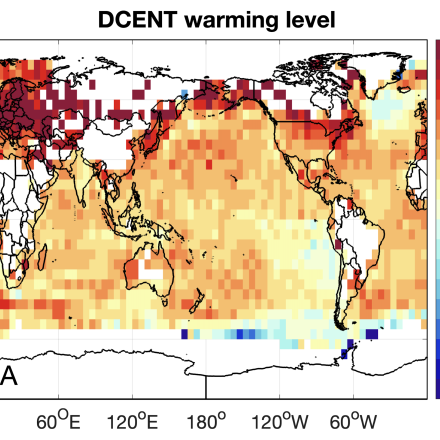
|
|
Duo Chan | to | Monthly | 5° latitude x 5° longitude | A novel bias correction of raw sea surface and land surface temperature measurements
|
| Global surface temperatures: BEST: Berkeley Earth Surface Temperatures | 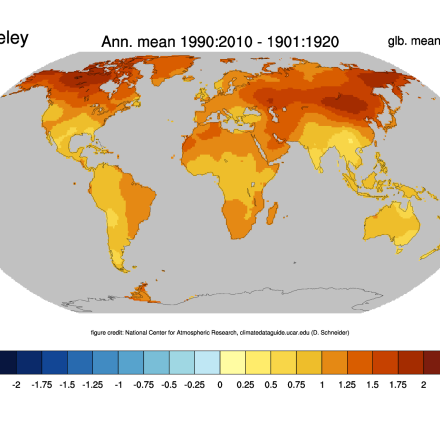
|
|
BerkeleyEarth.org/ R. Muller, R. Rhode | to | Climatology, Daily, Monthly | 1x1 degree or equal-area grid , .25 degree available for USA and Europe | combination of 14 databases of station data; ~37,000 individual records used;; merged land-ocean version uses HadSST3 |
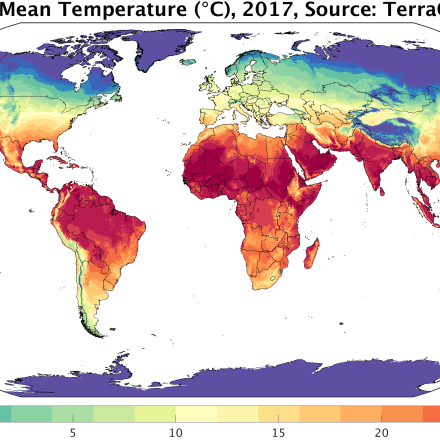
| TerraClimate: Global, high-resolution gridded temperature, precipitation, and other water balance variables | 
|
|
John Abatzoglou, University of California - Merced | to | Climatology, Monthly | ~4 km (1/24th degree) | WorldClim, CRUTS4.0 |