SMAP-Derived 1-km Downscaled Surface Soil Moisture
This data product contains global daily 1 km resolution surface soil moisture (SM) derived from the Soil Moisture Active Passive (SMAP) L-band radiometer observations. Specifically, Moderate Resolution Imaging Spectroradiometer (MODIS) land surface temperature and Normalized Difference Vegetation Index (NDVI) data were used with the SMAP Enhanced L2 radiometer Half-Orbit 9 km Equal-Area Scalable Earth (EASE) Grid Soil Moisture product in a downscaling algorithm to estimate SM. The algorithm is based on the thermal inertia theory which characterizes the inverse relationship between land surface temperature differences from 1:30 AM to 1:30 PM. Aqua MODIS overpasses and corresponding SM from SMAP overpasses at 6 AM and 6 PM. This relationship was modeled by linear regression and used Global Land Data Assimilation System (GLDAS) Noah model output variables of surface skin temperature and SM and Land Long-Term Data Record (LTDR) normalized difference vegetation index (NDVI) data. In order to evaluate and compare the data accuracy between the original 9 km and downscaled 1 km SM data, validations were conducted by in situ SM measurements from dense SM networks representing different global land cover types.
Key Strengths
This data provides routinely available, high spatial resolution and wide coverage SMAP SM products by only utilizing the visible/infrared band observation derived land surface parameter products from other satellite platforms.
The validation results (Table 2) on downscaled 1 km and original 9 km SMAP SM show that the downscaled SM product not only maintains a good accuracy, but also offers more detailed SM information than the original SMAP SM product.
Key Limitations
The downscaling model performs better in the middle and low latitudes compared with high latitudes and in warm months compared with cold months. Regions with mountains, dense vegetation, and undulating surface terrain experience poorer performance.
The downscaled SMAP data are missing in the global northernmost regions in winter months and certain subtropical and tropical regions in rainy seasons due to snow, ice, and cloud cover.
Short record
Lakshmi, V. and B. Fang. (2023). SMAP-Derived 1-km Downscaled Surface Soil Moisture Product, Version 1 [Data Set]. Boulder, Colorado USA. NASA National Snow and Ice Data Center Distributed Active Archive Center. https://doi.org/10.5067/U8QZ2AXE5V7B. Date Accessed MM-DD-YYYY.
Expert Developer Guidance
The following was contributed by Bin Fang and Venkat Lakshmi, June, 2023:
This data product contains global daily 1 km resolution surface soil moisture (SM) derived from the Soil Moisture Active Passive (SMAP) L-band radiometer observations. Specifically, Moderate Resolution Imaging Spectroradiometer (MODIS) land surface temperature and Normalized Difference Vegetation Index (NDVI) data were used with the SMAP Enhanced L2 radiometer Half-Orbit 9 km Equal-Area Scalable Earth (EASE) Grid Soil Moisture product in a downscaling algorithm to estimate SM. The algorithm is based on the thermal inertia theory which characterizes the inverse relationship between land surface temperature differences from 1:30 AM to 1:30 PM. Aqua MODIS overpasses and corresponding SM from SMAP overpasses at 6 AM and 6 PM. This relationship was modeled by linear regression and used Global Land Data Assimilation System (GLDAS) Noah model output variables of surface skin temperature and SM and Land Long-Term Data Record (LTDR) normalized difference vegetation index (NDVI) data. In order to evaluate and compare the data accuracy between the original 9 km and downscaled 1 km SM data, validations were conducted by in situ SM measurements from dense SM networks representing different global land cover types (Figure 1). Table 1 shows descriptions of in situ SM networks used for validating SMAP SM.
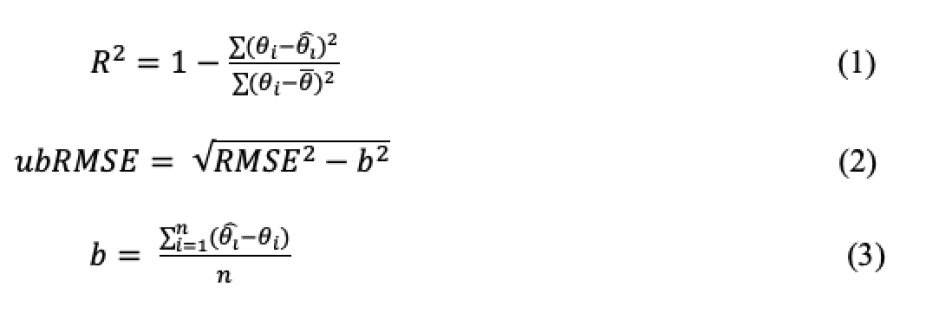
The following statistical metrics: R2, unbiased Root Mean Squared Error (ubRMSE), and bias were calculated. The equations are as follows:
Bin Fang
Where, θ and θ ̂ are in situ and 1 km downscaled SM data, respectively. ubRMSE is the unbiased RMSE after removing the bias b from RMSE. The validation metrics are shown in Table 2. The validation metrics show that the 1 km SM have better overall accuracy than the 9 km SM. On the other hand, the SM networks CTP, OzNET and REMEDHUS, which have less vegetation cover show better validation results than the other networks in terms of lower ubRMSE and MAE.
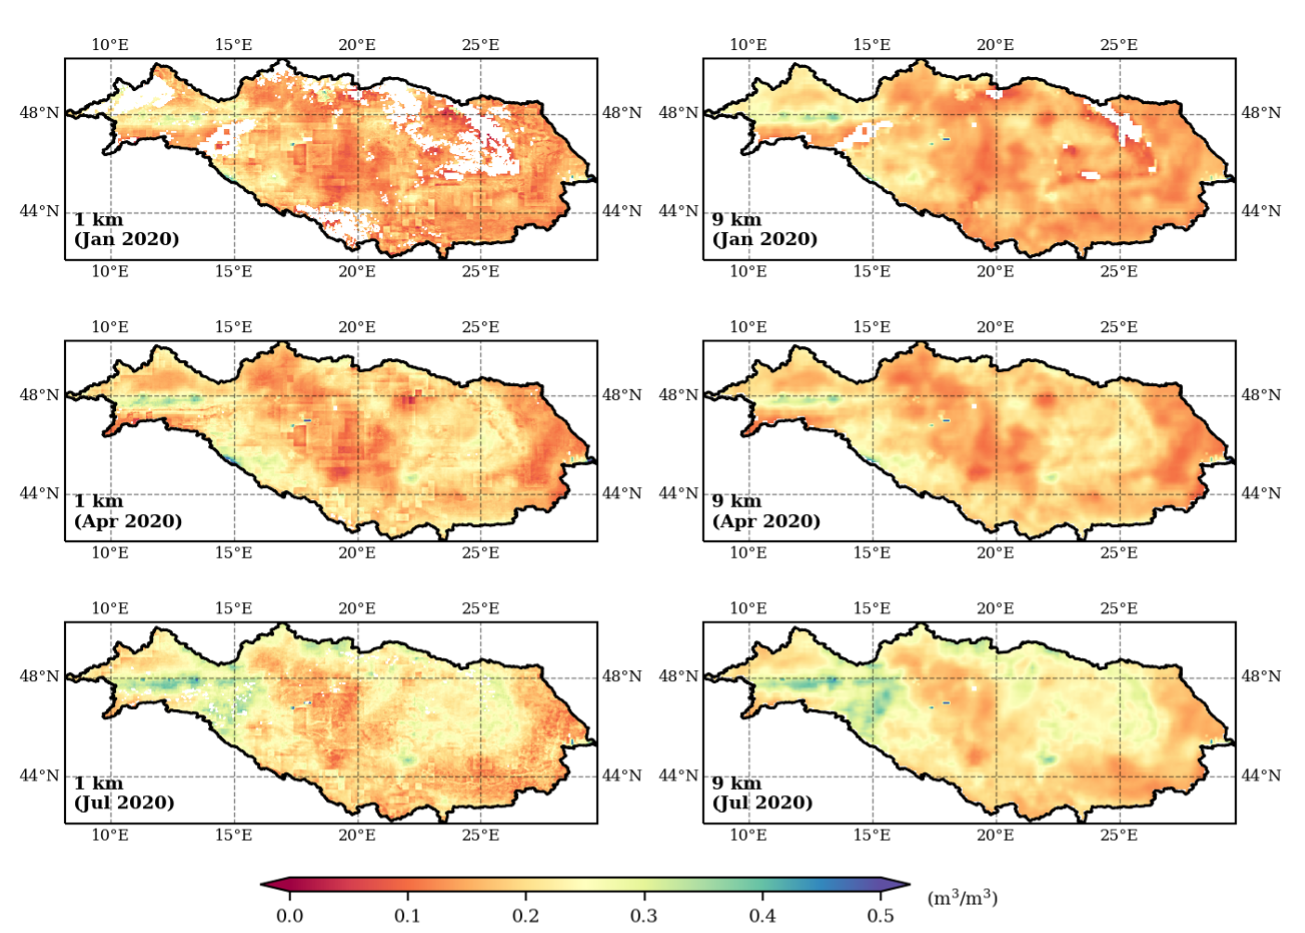
The 1km SM data are gridded using the global cylindrical EASE-Grid 2.0 projection downscaled to 1 km and daily data are separated into two bands denoting the ascending (6:00 PM) and descending (6:00 AM) half-orbits of the SMAP L-band radiometer (Figure 2). Figure 3 shows examples of the monthly averaged downscaled 1 km and 9 km SMAP SM of descending overpass (6 a.m.) from 2020 in Danube River basin. The spatial coverage spans 180° W to 180° E, and from approximately 86° N to 86° S, as defined by EASE-Grid 2.0 projection coverage. The temporal coverage is April 1st, 2015 to September 29th, 2022. This product represents approximately the top 5 cm layer of the soil profile.
The 1 km SM product can be used in many applications including monitoring drought conditions from climatological and ecosystem aspects, evaluation of drought conditions by derived soil water deficit indices from the SM data, evaluation of hydrological applications using climate model, improving streamflow simulation using data assimilation techniques, and evaluation of impact of SM on dust outbreaks.
Key Strengths:
1. This data set can provide routinely available, high spatial resolution and wide coverage SMAP SM products by only utilizing the visible/infrared band observation derived land surface parameter products from other satellite platforms.
2. The validation results (Table 2) on downscaled 1 km and original 9 km SMAP SM show that the downscaled SM product not only maintains a good accuracy, but also offers more detailed SM information than the original SMAP SM product.
Key Limitations:
1. The downscaling model performs better in the middle and low latitudes compared with high latitudes and in warm months compared with cold months. Regions with mountains, dense vegetation, and undulating surface terrain experience poorer performance.
2. The downscaled SMAP data are missing in the global northernmost regions in winter months and certain subtropical and tropical regions in rainy seasons due to snow, ice, and cloud cover.
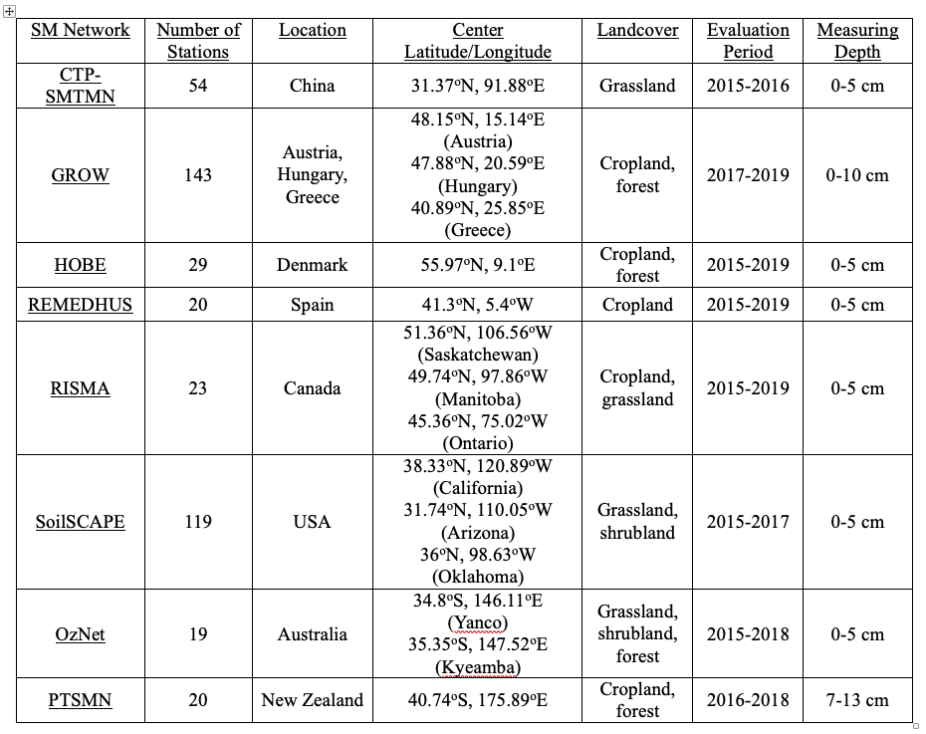
Table 1. Descriptions of in situ SM networks used for validating SMAP SM: number of stations, location, center latitude/longitude and main landcover types.
(contributed by Bin Fang and Venkat Lakshmi)
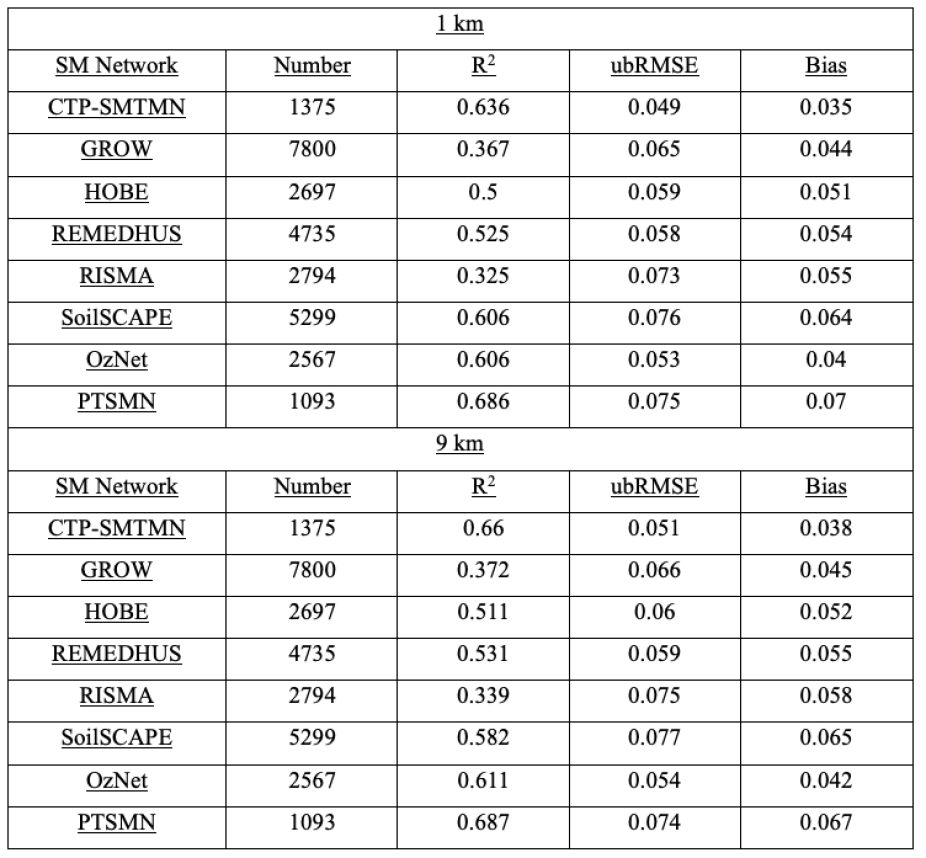
Table 2. Averaged validation metrics: Number of data points, R2, ubRMSE, and bias of the 1 km/9 km SMAP SM of the descending overpass (6 a.m.) from 2015-2019, by in-situ SM measurements from 8 SM networks.
(contributed by Bin Fang and Venkat Lakshmi)
Cite this page
Acknowledgement of any material taken from or knowledge gained from this page is appreciated:
Lakshmi, Venkataraman &, Fang, Bin & National Center for Atmospheric Research Staff (Eds). Last modified "The Climate Data Guide: SMAP-Derived 1-km Downscaled Surface Soil Moisture.” Retrieved from https://climatedataguide.ucar.edu/climate-data/smap-derived-1-km-downscaled-surface-soil-moisture on 2026-07-21.
Citation of datasets is separate and should be done according to the data providers' instructions. If known to us, data citation instructions are given in the Data Access section, above.
Acknowledgement of the Climate Data Guide project is also appreciated:
Schneider, D. P., C. Deser, J. Fasullo, and K. E. Trenberth, 2013: Climate Data Guide Spurs Discovery and Understanding. Eos Trans. AGU, 94, 121–122, https://doi.org/10.1002/2013eo130001
Key Figures
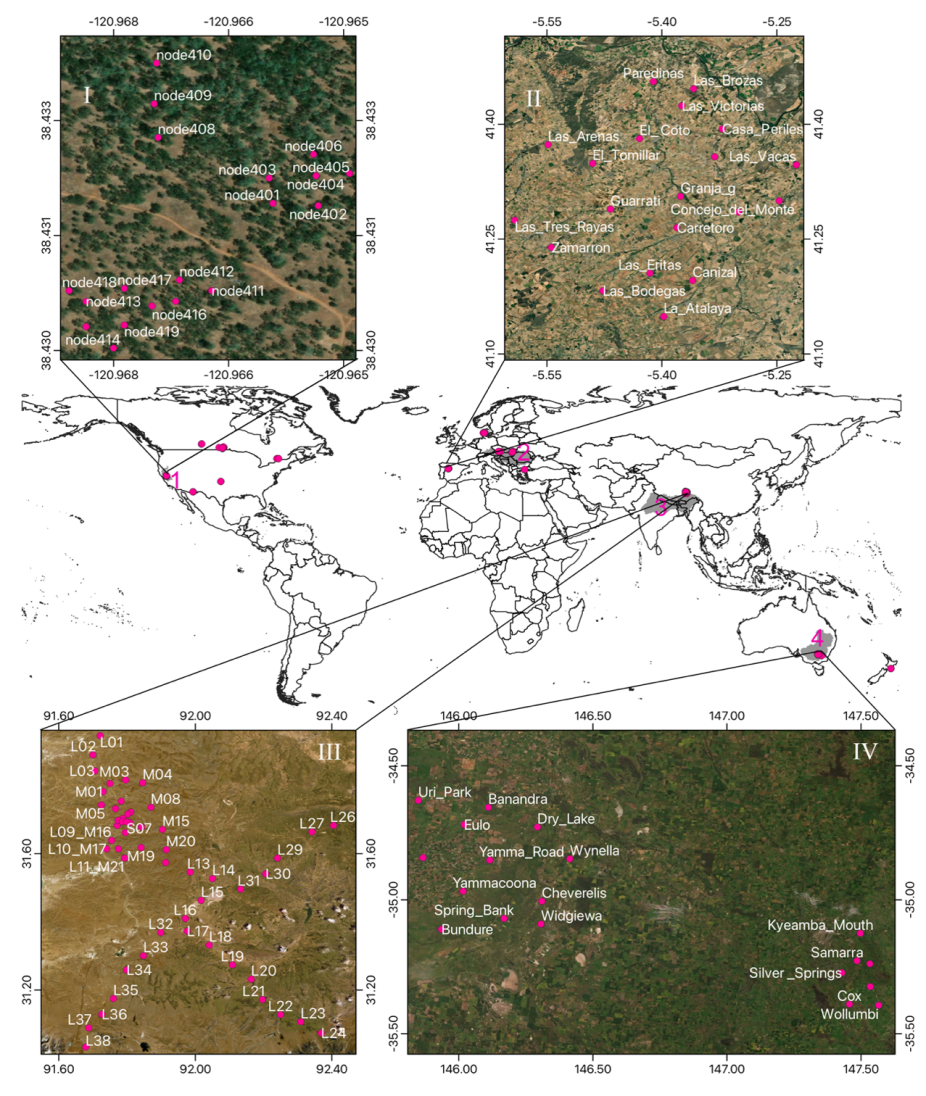
Figure 1. Map shows locations of the dense in situ SM networks in the world to validate the 1 km SMAP SM. The zoom-in satellite imagery shows examples of land covers of four SM networks: I. SoilSCAPE, II. REMEDHUS, III. CTP-SMTMN, and IV. OzNET. (contributed by Bin Fang and Venkat Lakshmi)
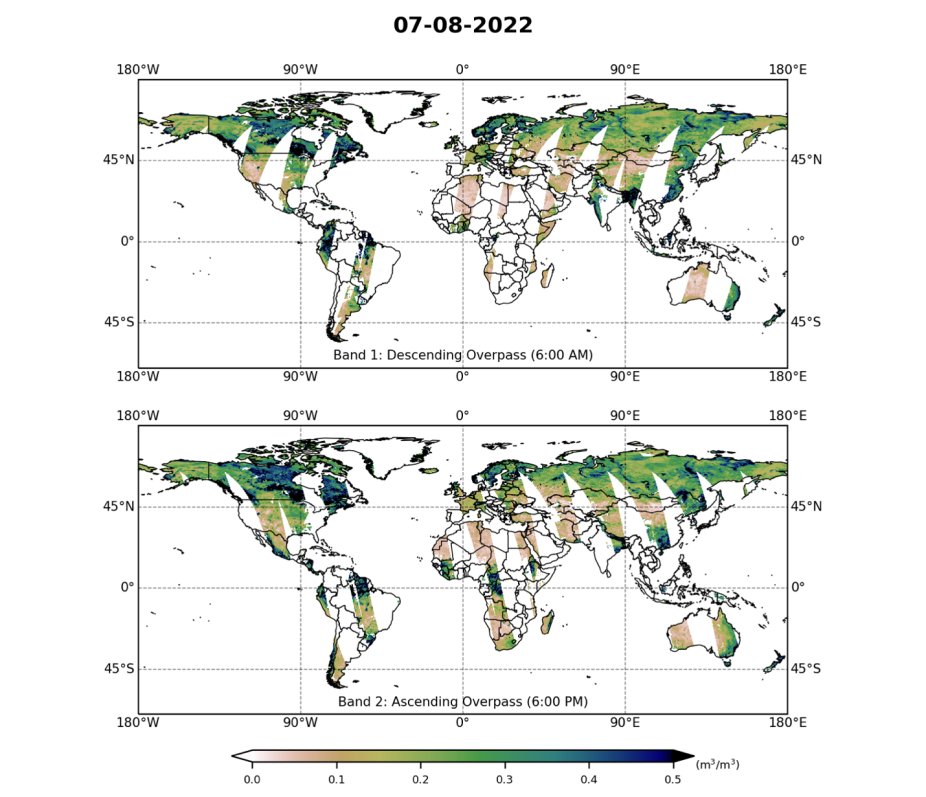
Figure 2a. Map shows the global scale 1 km SMAP SM of descending/ascending overpasses on July 8th 2022. (contributed by Bin Fang and Venkat Lakshmi)
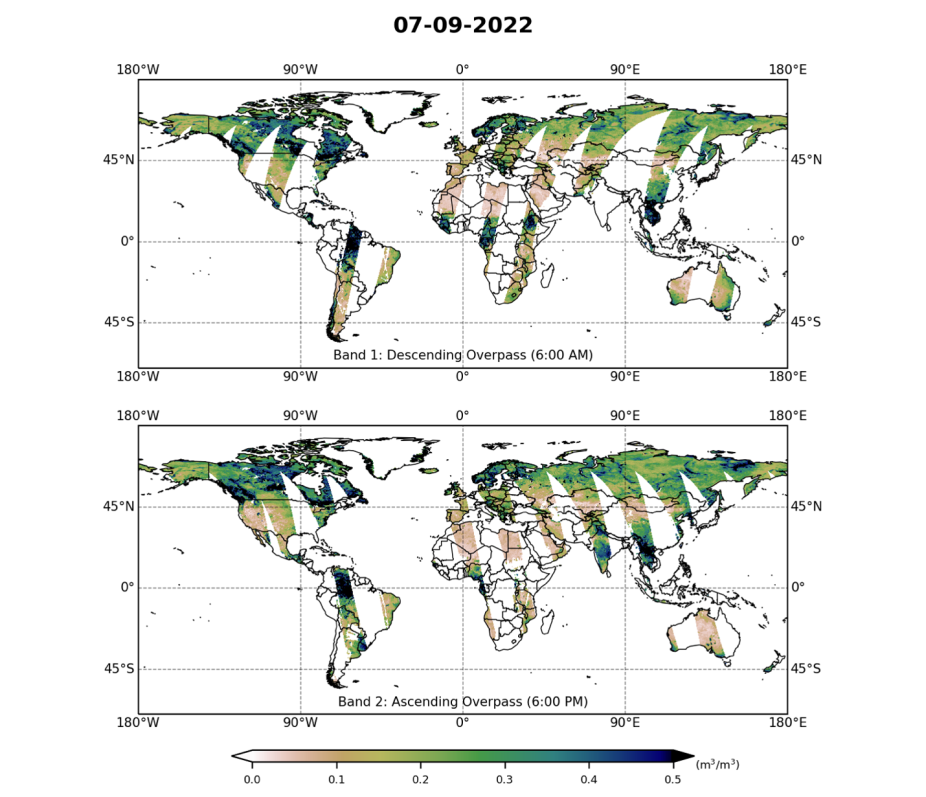
Figure 2b. Map shows the global scale 1 km SMAP SM of descending/ascending overpasses on July 9th 2022 (contributed by Bin Fang and Venkat Lakshmi)
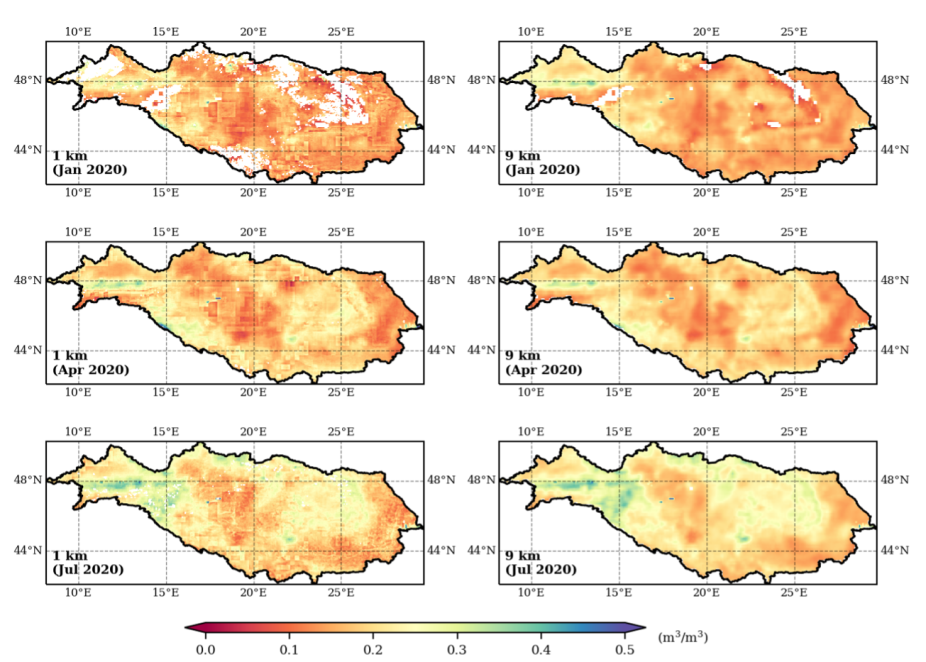
Figure 3. The monthly averaged downscaled 1 km and 9 km SMAP SM of descending overpass (6 a.m.) from 2020 in Danube River basin. (contributed by Bin Fang and Venkat Lakshmi)
Other Information
- Fang, B., Lakshmi, V., Cosh, M., Liu, P.W., Bindlish, R. and Jackson, T.J., 2022. A global 1‐km downscaled SMAP soil moisture product based on thermal inertia theory. Vadose Zone Journal, 21(2), p.e20182.
- Fang, B., Lakshmi, V., Cosh, M. H., & Hain, C. (2021). Very high spatial resolution downscaled SMAP radiometer soil moisture in the CONUS using VIIRS/MODIS data. IEEE Journal of Selected Topics in Applied Earth Observations and Remote Sensing, 14, 4946-49
- Fang, B., Lakshmi, V., Bindlish, R., Jackson, T.J. and Liu, P.W., 2020. Evaluation and validation of a high spatial resolution satellite soil moisture product over the Continental United States. Journal of Hydrology, 588, p.125043.