Stratospheric Ozone: Randel & Wu 2007
This is a monthly, zonal-mean ozone profile data set spanning 1979–2005 for altitudes from the tropopause up to 50 km. Interannual variability is based on a combination of SAGE (Stratospheric Aerosol and Gas Experiment) satellite profile measurements and polar ozonesondes. The interannual anomalies were added to a climatology from Fortuin and Kelder (1998). This dataset was used as boundary conditions (forcing) for many CMIP3 historical experiments. For CMIP5, the ACC/SPARC project formed a global ozone data set by combining a similar data set for the historical stratosphere with other measurements and modeling to include the troposphere and extend the data set to 2099. Both Randel and Wu (2007) and the ACC/SPARC data are considered to have relatively conservative trends in lower stratospheric ozone over 1979-2005 (see Hassler et al., 2013 and Solomon et al., 2012).
Key Strengths
Key Limitations
Expert Developer Guidance
#The following was contributed by Bill Randel (NCAR), February, 2013:
The Randel and Wu (RW) stratospheric ozone data set was constructed by combining interannual ozone anomalies (derived from SAGE I+II satellite measurements and polar ozonesondes) with a background ozone climatology from Fortuin and Kelder (1998), to give a monthly global ozone data set covering 1979-2005. Description of the data and comparison of the interannual anomalies with independently measured column ozone variability is described in Randel and Wu (2007). The interannual anomalies are constructed using a multivariate regression fit to the gappy satellite measurements. The data are intended to accurately capture seasonal and interannual variability associated with long-term decadal trends (including development of the Antarctic ozone hole), along with the 11-year solar cycle and stratospheric quasi-biennial oscillation (QBO).
Strengths: Interannual changes are based on high quality, high vertical resolution satellite measurements from the SAGE I (covering 1979-1982) and SAGE II (1984-2005) satellites. These solar occultation measurements are the acknowledged ‘gold standard’ for quantifying stratospheric ozone changes during 1979-2005. Because SAGE measurements do not cover polar regions throughout the year, polar ozone is based on measurements from two high quality stations with near-continuous observations during 1979-2005 (Syowa at 69o S, and Resolute at 75o N).
Weaknesses: The data are focused on low-frequency interannual variability that is well-characterized by SAGE measurements (trends, solar cycle and QBO fits). The effects of the large volcanic eruptions of El Chichon (1982) and Pinatubo (1991) on stratospheric ozone are not included, as there were no observations during these periods (El Chichon occurred during the break between SAGE I and SAGE II, and SAGE II measurements after Pinatubo were unavailable due to excessive aerosol contamination). Also, month-to-month ‘natural’ variability of ozone is not included in these data.
Applications: The seamless global data are useful for forcing model simulations and characterizing low frequency variability in free-running models.
Common mistakes for users: unknown
Spurious features: none
Corrections applied: no
Conversions for comparisons to model output: no
Comparable data sets: The historical, stratospheric component of the ACC/SPARC ozone data set (Cionni et al, 2011) is based on a data set very similar (but not identical) to RW.
Uncertainty characterized: Not explicitly. Comparisons to the global column ozone measurements (shown in RW) suggest an overall reasonable depiction of large-scale ozone variability and trends during 1979-2005.
Summary: The RW data set was intended to provide a simple global compilation of ozone variability and trends during 1979-2005 for use in forcing or evaluating global models. It has been highly utilized in the community.##
Cite this page
Acknowledgement of any material taken from or knowledge gained from this page is appreciated:
Randel, Bill & National Center for Atmospheric Research Staff (Eds). Last modified "The Climate Data Guide: Stratospheric Ozone: Randel & Wu 2007.” Retrieved from https://climatedataguide.ucar.edu/climate-data/stratospheric-ozone-randel-wu-2007 on 2026-07-07.
Citation of datasets is separate and should be done according to the data providers' instructions. If known to us, data citation instructions are given in the Data Access section, above.
Acknowledgement of the Climate Data Guide project is also appreciated:
Schneider, D. P., C. Deser, J. Fasullo, and K. E. Trenberth, 2013: Climate Data Guide Spurs Discovery and Understanding. Eos Trans. AGU, 94, 121–122, https://doi.org/10.1002/2013eo130001
Key Figures

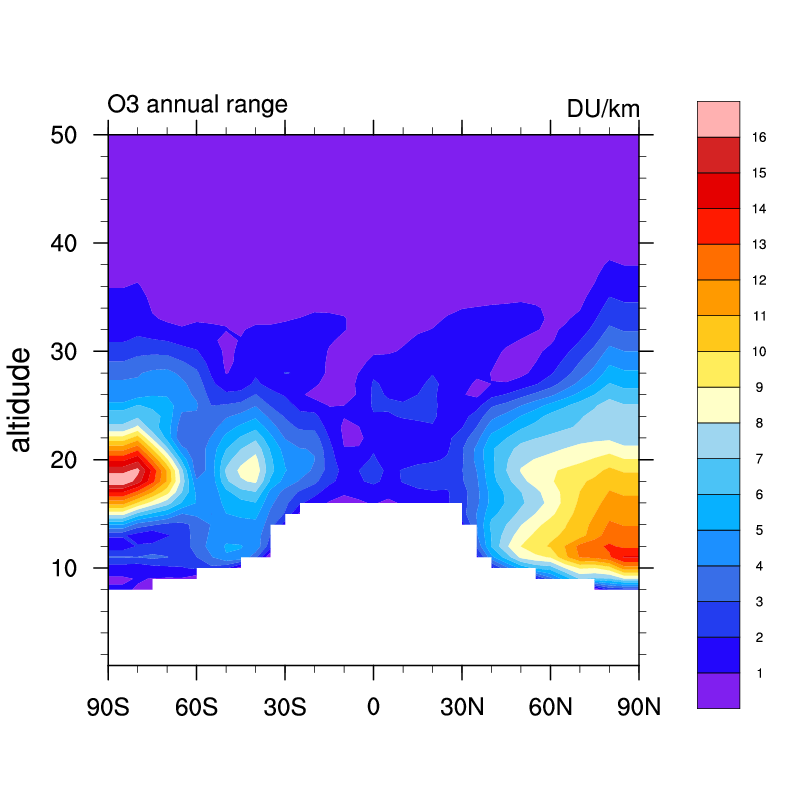
Climatological range of monthly mean O3 (Randel & Wu, 2007).
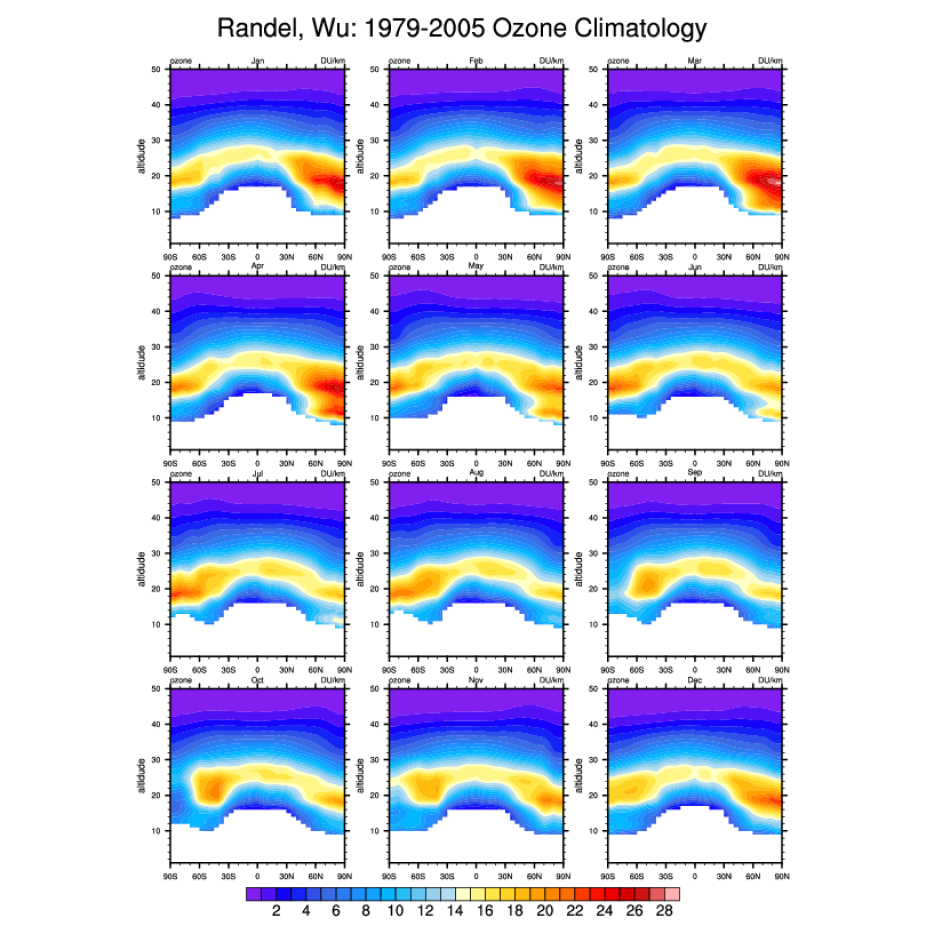
Monthly ozone climatology (1979-2005).
Other Information
- Randel, W. J., and F. Wu (2007), A stratospheric ozone profile data set for 1979–2005: Variability, trends, and comparisons with column ozone data, J. Geophys. Res., 112, D06313, doi:10.1029/2006JD007339.
- Paul, J., F. Fortuin, and H. Kelder (1998), An ozone climatology based on ozonesonde and satellite measurements, J. Geophys. Res., 103(D24), 31709–31734, doi:10.1029/1998JD200008.
- Cionni, I., et al (2011): Ozone database in support of CMIP5 simulations: results and corresponding radiative forcing, Atmos. Chem. Phys., 11, 11267– 11292
- B. Hassler, P. J. Young, R. W. Portmann et al (2013), Comparison of three vertically resolved ozone data sets: climatology, trends and radiative forcings, Atmos. Chem. Phys., 13, 5533-5550.
- Solomon, S., P. J. Young, and B. Hassler (2012), Uncertainties in the evolution of stratospheric ozone and implications for recent temperature changes in the tropical lower stratosphere, Geophys. Res. Lett., 39, L17706, doi:10.1029/2012GL052723.