Stratospheric Temperature: Satellite Datasets Used to Quantify Lower, Middle, and Upper Stratospheric Temperatures
The temperature of the stratosphere is a key climate variable for understanding variability and change of the Earth's radiation budget, particularly due to sensitivity to changes in stratospheric ozone as well as aerosols from volcanoes and wildfires. While there are direct measurements of the lower stratosphere with weather balloons and field campaigns, complete estimates of large-scale mean stratospheric temperature are conducted with remotely sensed data, using infrared and microwave instruments.
Four instruments have provided retrievals used to estimate stratospheric temperature: the Microwave Sounding Unit (MSU) and Stratospheric Sounding Unit (SSU) instruments from late 1978 to 2005, the Advanced Microwave Sounding Unit (AMSU) from 1998-present, and the Aura Microwave Limb Sounder (MLS) for 2004-present. The satellite retrievals have been post-processed into lower, middle, and upper stratospheric temperature estimates by numerous groups including University of Alabama in Huntsville, Remote Sensing Systems, the NOAA Center for Satellite Applications and Research and NSF NCAR. The overlap between the instruments has enabled a merged record of stratospheric temperature from 1978-present. These products generally agree in terms of trends and variability and provide separate estimates of these variables that can be used to sample uncertainty due to post-processing methodology.
Expert User Guidance
The following was contributed by Dr. William Randel and Dr. Jon Starr, August, 2025:
Global satellite measurements of lower, middle and upper stratospheric temperatures are available from the series of operational Microwave Sounding Unit (MSU) and Stratospheric Sounding Unit (SSU) instruments from late 1978 to 2005. These data represent broad layer ~10 km and ~20 km averages of atmospheric temperatures for the MSU and SSU measurements, respectively, and weighting functions for these data are shown in Fig. 1.
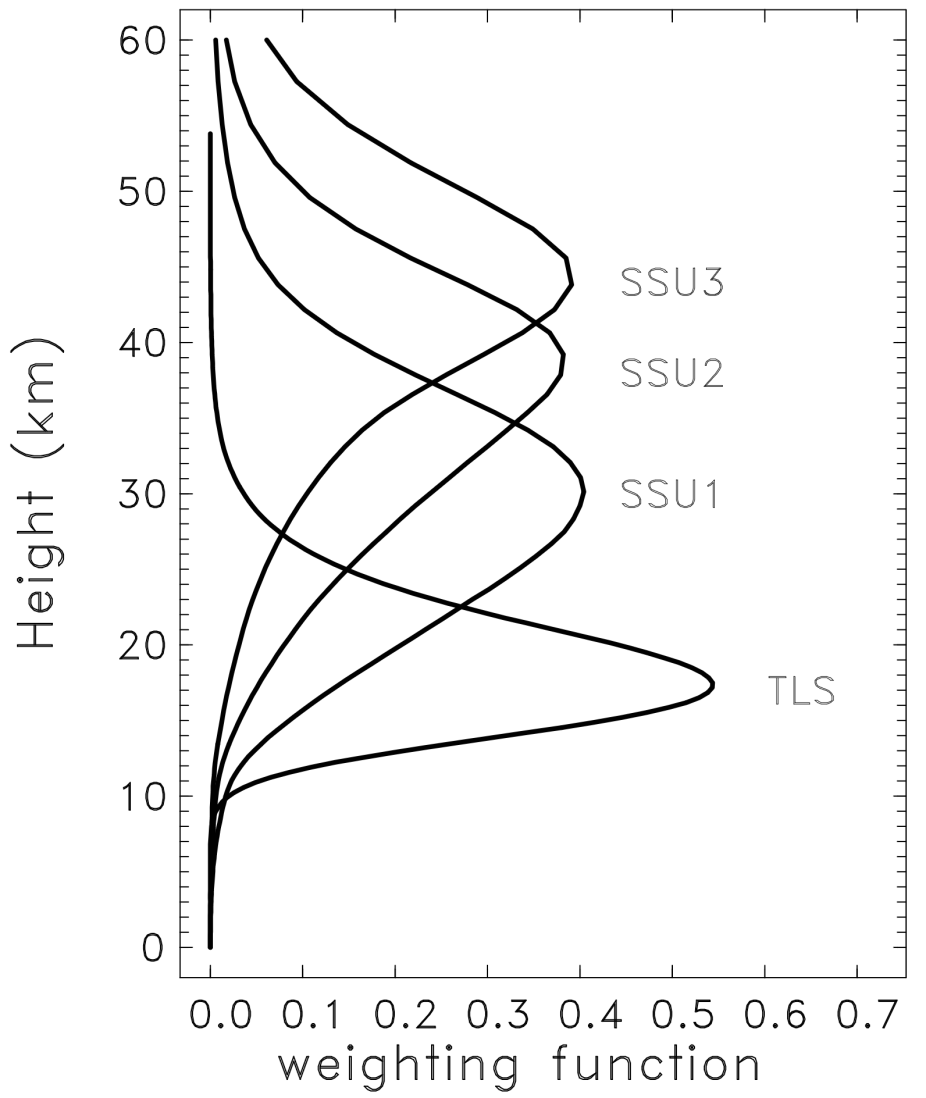
Figure 1: Weighting functions for the TLS and SSU satellite measurements, showing the vertical layer averages for the different channels.
W. Randel
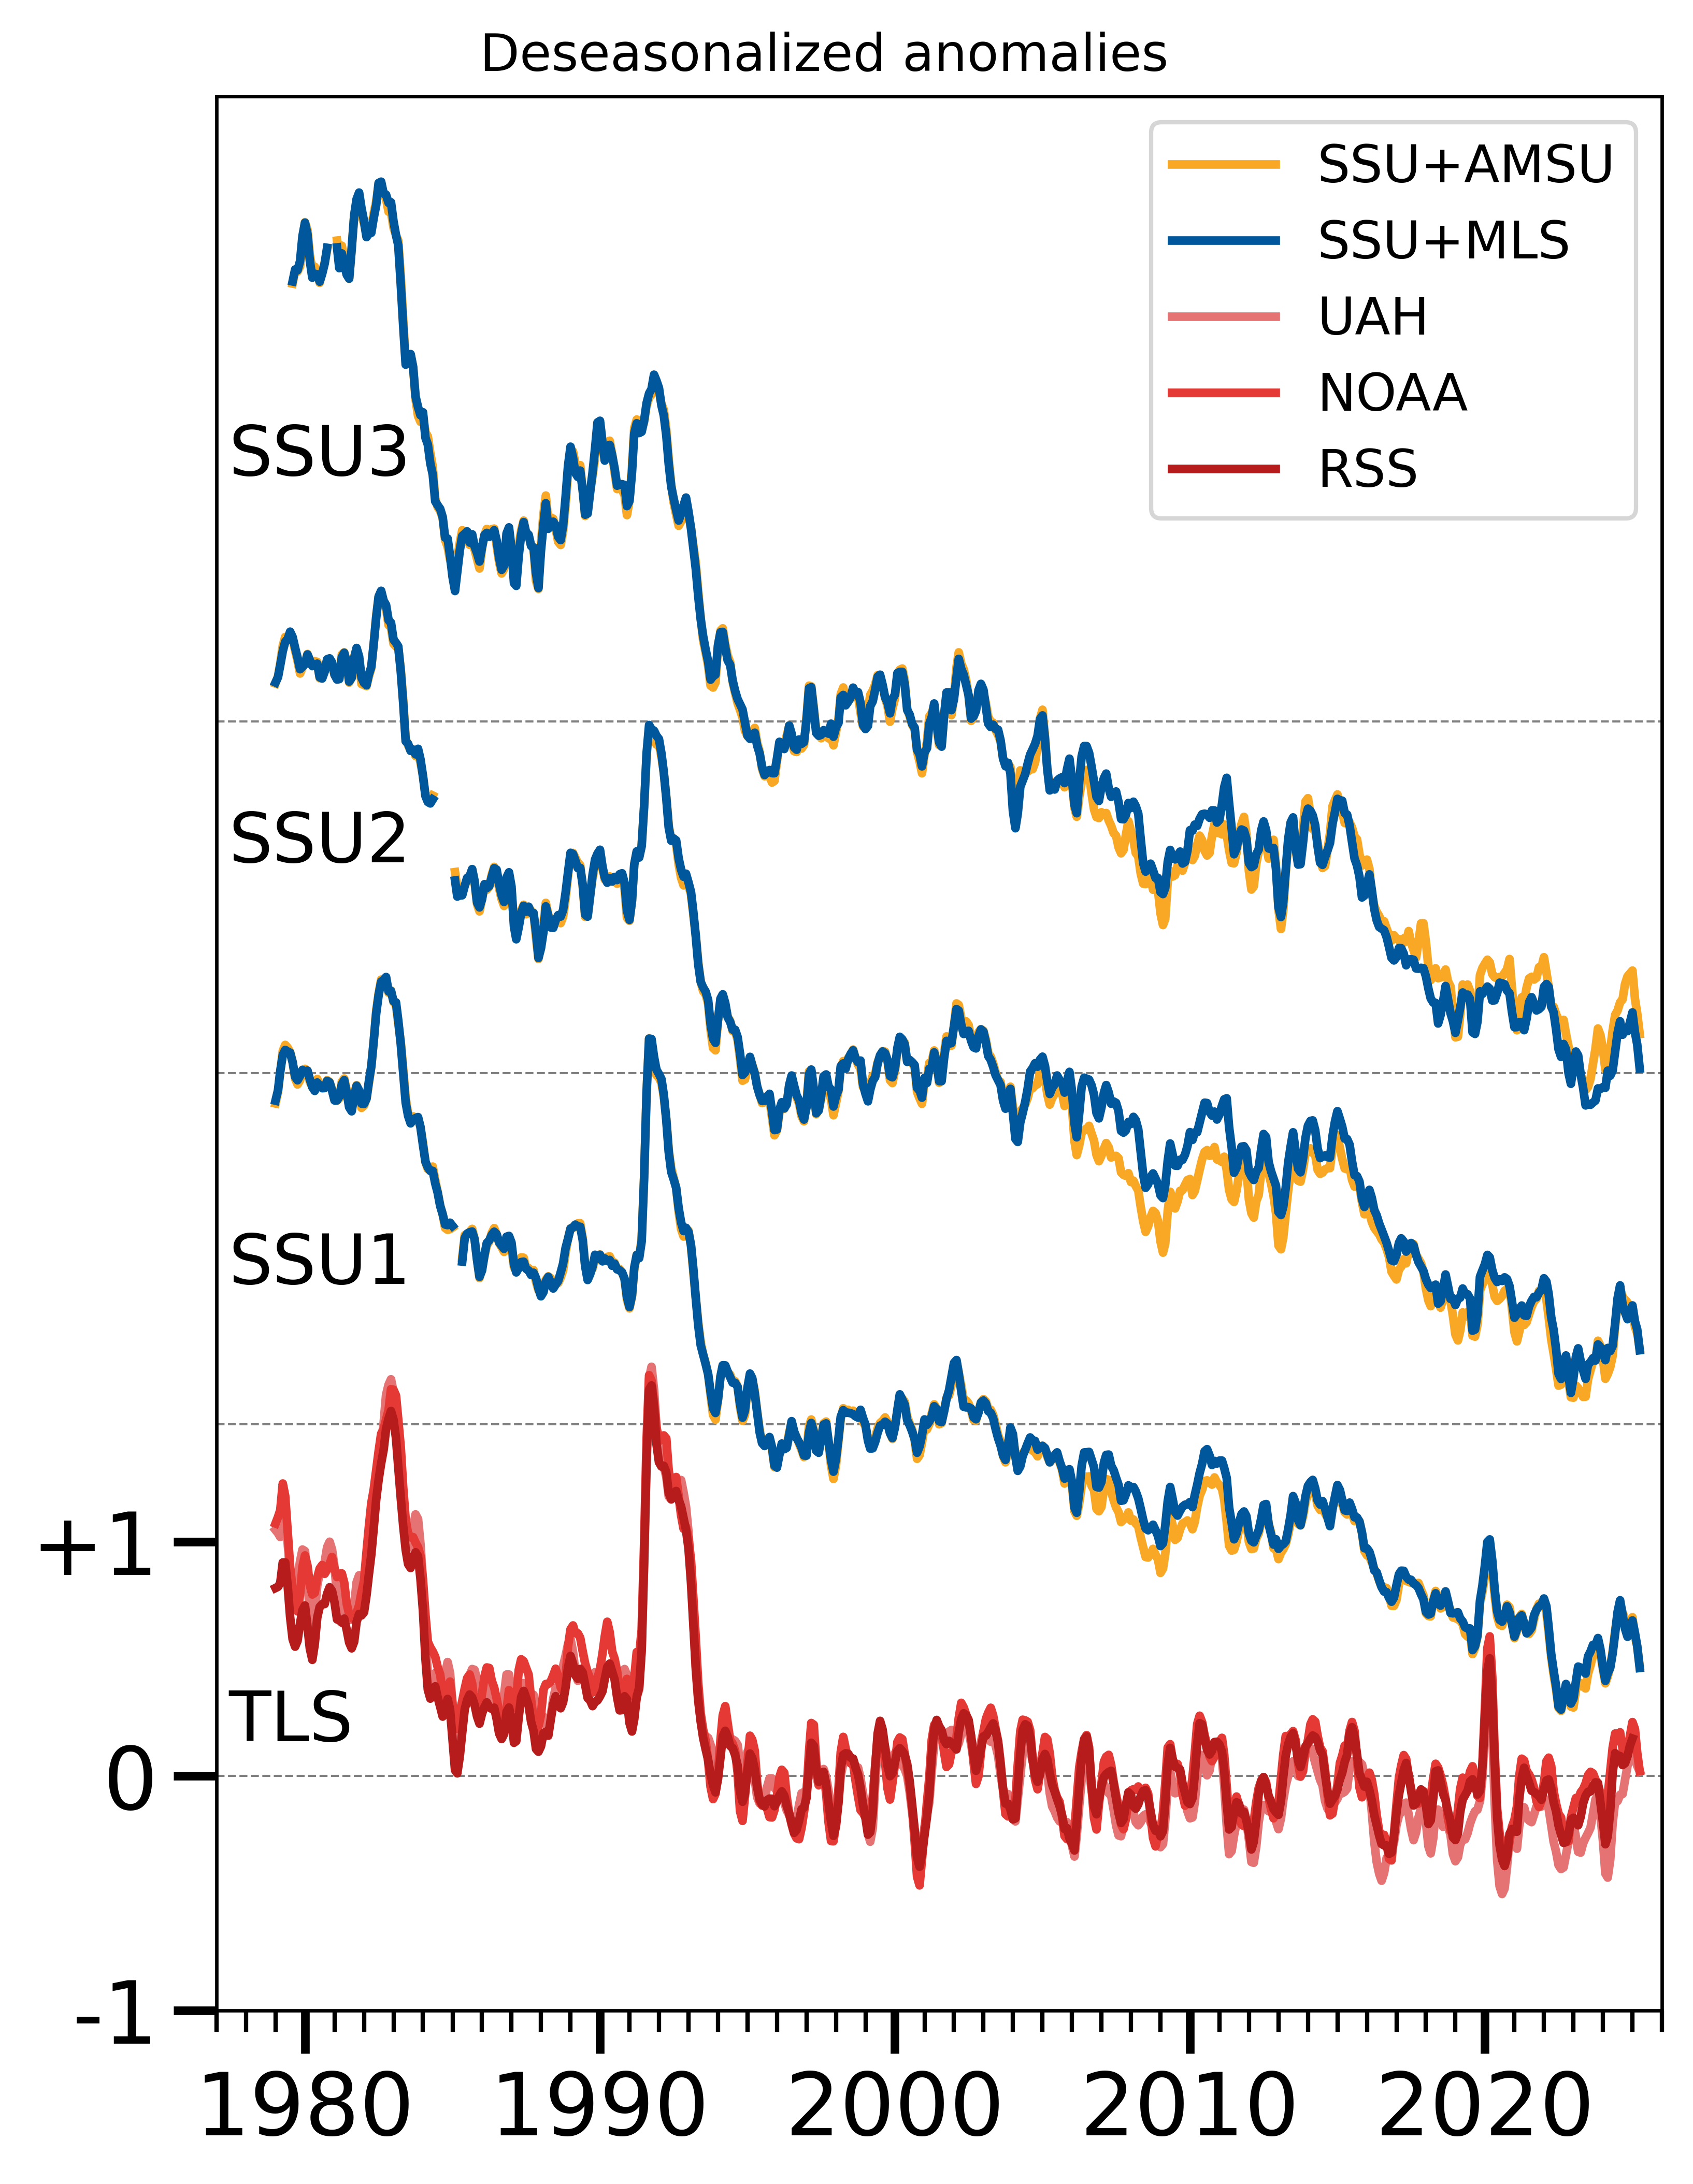
Time series of these data have been updated after 2005 using complementary satellite measurements. The lower stratosphere MSU time series have been updated using data from the series of Advanced Microwave Sounding Unit (AMSU) instruments, which began in 1998. The merged data record is referred to as Temperature of the Lower Stratosphere (TLS). Merged time series of TLS have been produced by several teams, including at the University of Alabama in Huntsville (UAH; Spencer et al., 2017), Remote Sensing Systems (RSS; Mears and Wentz, 2009; Mears et al., 2011), and the NOAA Center for Satellite Applications and Research (STAR; Zou and Wang, 2011), with all three considering instrument calibration, satellite orbit changes, and other influences. These different merged datasets produce reasonably consistent time series and trend results for the lower stratosphere, as shown in Fig. 2 (see also Steiner et al., 2020).

Figure 2: Time series of deseasonalized, global mean stratospheric temperature anomalies calculated from the merged SSU and TLS datasets. The four sets of curves correspond to different altitude levels (lower to upper stratosphere, bottom to top), associated with the different weighting functions shown in Fig. 1.
W. Randel
The SSU time series from 1978 to 2005 were homogenized and merged by Zou et al. (2014), and Zou and Qian (2016) extended the SSU data record beyond 2005 using AMSU measurements. SSU global time series were independently updated by Randel et al. (2016) using research satellite data from Aura Microwave Limb Sounder (MLS) beginning in 2004 (Livesey et al., 2022). The updated global mean SSU+AMSU and SSU+MLS time series are shown in Fig. 2, revealing good agreement for the independent measurements after 2005. These long-term observations reveal substantial cooling of the stratosphere over time, together with effects of the 11-year solar cycle and episodic impacts of large volcanic eruptions (e.g. Randel et al., 2024).
What are the key strengths of these data sets?
The various remotely sensed datasets are stable and well documented. Datasets extend for more than 40 years, so they can be used to study variability and long-term trends as well as spatial patterns.
What are the key limitations of these data sets?
Data represent thick layer average temperatures, with limited vertical resolution. Data are constructed from many operational satellite instruments, with merged data accounting for changes in instrument calibration and adjustments for changing local measurement times due to satellite orbit drifts. Differences between products in details of the corrections and merging procedures introduce uncertainty into the results, multiple datasets should be used to sample this uncertainty.
What are the typical research applications of this data set?
These data are often used for evaluating variability and trends in observed stratospheric temperatures and making detailed comparisons with stratospheric model simulations.
How does one best compare these data with climate model output?
Detailed comparisons with model results are best made by applying the respective weighting functions to climate model temperature fields. This is done to ensure comparison of similar thick-layer average temperatures. Examples for these stratospheric temperature data are shown in Randel et al (2017).
How do I access these data?
Monthly average gridded data are available at the following web sites:
- Remote Sensing Systems (2025). Merged AMSU/MSU TLS Climate Data Record version 4.0 [Data set], Retrieved 2025-05-05 from https://www.remss.com/missions/amsu/
- NESDIS STAR (2025). Merged AMSU/MSU TLS Climate Data Record version 5.0 [Data set], Retrieved 2025-07-10 from https://www.ncei.noaa.gov/access/monitoring/msu/overview
- University of Alabama Huntsville (2025). Merged AMSU/MSU TLS Climate Data Record version 6.1 [Data set], Retrieved 2025-05-05 from https://www.nsstc.uah.edu/data/msu/
- NESDIS STAR (2025). Merged SSU+AMSU Climate Data Record version 3.0 [Data set], Retrieved 2025-08-05 from https://www.star.nesdis.noaa.gov/smcd/emb/mscat/introduction.php
References
- Livesey, N. J., Read, W. G., Wagner, P. A., Froidevaux, L., Santee, M. L., & Schwartz, M. J. (2022). Version 5.0 x level 2 and 3 data quality and description document. Jet Propulsion Laboratory. (Tech. Rep. No. JPL D‐105336 Rev. A).
- Mears, C. A. and F. J. Wentz (2009). Construction of the Remote Sensing Systems V3.2 Atmospheric Temperature Records From the MSU and AMSU Microwave Sounders, Journal of Atmospheric and Oceanic Technology, 26, 1040-1056. https://doi.org/10.1175/2008JTECHA1176.1
- Mears, C. A., and F. J. Wentz, P. Thorne, and D. Bernie (2011). Assessing uncertainty in estimates of atmospheric temperature changes from MSU and AMSU using a Monte-Carlo estimation technique. J. Geophys. Res. Atmospheres, 116, D08112, https://doi.org/10.1029/2010JD014954
- Randel, W.J., A. K. Smith, F. Wu, C.-Z. Zou, and H. Qian (2016). Stratospheric temperature trends over 1979-2015 derived from combined SSU, MLS and SABER satellite observations. J. Clim., https://doi.org/10.1175/JCLI-D-15-0629.1
- Randel, W. J., Polvani, L., Wu, F., Kinnison, D. E., Zou, C.-Z., & Mears, C. (2017). Troposphere-stratosphere temperature trends derived from satellite data compared with ensemble simulations from WACCM. J. Geophys. Res. Atmospheres, 122. https://doi.org/10.1002/2017JD027158
- Randel, W.J., Wang, X., Starr, J., Garcia, R.R. and Kinnison, D.K. (2024). Long-term temperature impacts of the Hunga volcanic eruption in the stratosphere and above. Geophys. Res. Lett., 51, e2024GL111500. https://doi.org/10.1029/2024GL111500
- Spencer, R. W., J. R. Christy, and W. D. Braswell (2017). UAH Version 6 global satellite temperature products: Methodology and results. Asia-Pac. J. Atmospheric Sci., 53, 121–130, https://doi.org/10.1007/s13143-017-0010-y
- Steiner, A. K., and coauthors (2020). Observed temperature changes in the troposphere and stratosphere from 1979 to 2018. J. Climate, 33, 8165-8194. DOI:10.1175/JCLI-D-19-0998.1
- Zou, C.-Z., and W. Wang (2011). Intersatellite calibration of AMSU-A observations for weather and climate applications. J. Geophys. Res. Atmospheres, 116, D23113, https://doi.org/10.1029/2011JD016205
- Zou, C.-Z., and H. Qian (2016). Stratospheric Temperature Climate Data Record from Merged SSU and AMSU-A Observations. J. Atmospheric Ocean. Technol., 33, 1967–1984, https://doi.org/10.1175/JTECH-D-16-0018.1
- Zou, C.-Z., H. Qian, W. Wang, L. Wang, and C. Long (2014). Recalibration and merging of SSU observations for stratospheric temperature trend studies. J. Geophys. Res. Atmospheres, 119, 2014JD021603, https://doi.org/10.1002/2014JD021603
Cite this page
Acknowledgement of any material taken from or knowledge gained from this page is appreciated:
Randel, Bill &, Starr, Jon & National Center for Atmospheric Research Staff (Eds). Last modified "The Climate Data Guide: Stratospheric Temperature: Satellite Datasets Used to Quantify Lower, Middle, and Upper Stratospheric Temperatures.” Retrieved from https://climatedataguide.ucar.edu/climate-data/stratospheric-temperature-satellite-datasets-used-quantify-lower-middle-and-upper on 2026-07-15.
Citation of datasets is separate and should be done according to the data providers' instructions. If known to us, data citation instructions are given in the Data Access section, above.
Acknowledgement of the Climate Data Guide project is also appreciated:
Schneider, D. P., C. Deser, J. Fasullo, and K. E. Trenberth, 2013: Climate Data Guide Spurs Discovery and Understanding. Eos Trans. AGU, 94, 121–122, https://doi.org/10.1002/2013eo130001