Total Column Water Vapor: Integrated Water Vapor from GNSS stations

Total Column Water Vapor (TCWV) or Integrated Water Vapor (IWV) is a key measure of the quantity of moisture held in the atmosphere at given locations. Water vapor is a key variable for understanding the moist energetics of the atmosphere and therefore the circulation as well as the radiative properties due to its strong absorption at most frequencies in the long-wave emission region. In addition, water vapor is critical for studying the hydrological cycle as well as boundary layer properties over both land and ocean regions.
TCWV is observed primarily with ground based Global Navigation Satellite System (GNSS) receivers. These GNSS receivers were constructed as part of the Global Positioning System (GPS), but scientists in the early 1990s realized they could be utilized to estimate the total amount of water vapor in the atmospheric column above the stations. The GPS system utilizes radio waves and the speed of these waves is reduced proportionally by the concentration of water vapor in the troposphere. This retrieval is complicated by the fact that charged ions in the ionosphere also affect the radio waves, an effect which must be corrected in TCWV datasets.
Currently, there are various products derived from the GNSS network with the earliest records beginning in 1994. These data have spatial coverage limited to the location of the GNSS stations, but provide very accurate measurements of TCWV at these locations.
Key Strengths
Point measurements of Total Column Water Vapor are accurate at locations with GNSS stations.
Temporal resolutions available from 1 hourly to monthly, enabling the study of processes at various timescales.
There is a long record from 1994-Present, allowing the study of long-term trends and variability.
Key Limitations
The dataset is currently not homogenized and there may be spurious signals in time series due to changes in instrumentation. There is work in progress to homogenize the global dataset.
The dataset consists of point observations of TCVW and is not spatially complete.
There is not a full uncertainty assessment of the derived global mean value from the GNSS network that accounts for limited spatial coverage.
Bock, O. (2025). Global GNSS Integrated Water Vapour data, 1994-2024.. [dataset]. Aeris. https://doi.org/10.25326/68
Expert Developer Guidance
The following was submitted by Olivier Bock, September, 2025:
Principles of GNSS Remote Sensing for Integrated Water Vapor
Continuously operating, ground-based Global Navigation Satellite System (GNSS) receivers provide high-precision measurements that enable the derivation of atmospheric Integrated Water Vapor (IWV) content under all weather conditions. Originally designed for positioning and navigation, the early Global Positioning System (GPS) was recognized as having high potential for remote sensing of atmospheric water vapor (Bevis et al., 1992). Today, ground-based GNSS networks are an integral part of operational meteorology (e.g., weather prediction) and climate monitoring.
State-of-the-art GNSS data processing relies on scientific geodetic software and on precise International GNSS Service (IGS) satellite orbits and clocks (Guerova et al., 2016; Jones et al., 2020). This approach enables the retrieval of propagation delay parameters, such as the Zenith Tropospheric Delay (ZTD), typically at a resolution of 1 hour.
IWV is derived from ZTD by first subtracting the contribution of dry air molecules (e.g., nitrogen, oxygen) and then scaling the remaining delay to water mass per unit area (kg m-2) using a conversion coefficient, denoted as κ. This process is summarized by the equation:
$$ IWV = (ZTD - ZHD) \cdot \kappa $$
Here, ZHD (Zenith Hydrostatic Delay) represents the delay caused by dry air molecules, assuming hydrostatic equilibrium. The difference, ZTD-ZHD, is known as the Zenith Wet Delay (ZWD) and reflects the propagation delay due to water vapor. The conversion coefficient κ is typically expressed as a function of the weighted mean temperature, T_m, which is calculated using either a numerical weather model or an empirical model (Bevis et al., 1992). Additionally, the conversion of ZTD to IWV involves several refractivity coefficients that account for how the molecules in moist air interact with propagating electromagnetic waves.
The uncertainty in Integrated Water Vapor (IWV) estimates stems from a combination of error sources, most of which originate during the estimation of the Zenith Tropospheric Delay (ZTD). These are primarily caused by noise and unmodeled errors in the raw Global Navigation Satellite System (GNSS) observations, by correlated errors between estimated parameters (e.g., ZTD, receiver clocks, and phase ambiguities), and by inaccuracies in satellite orbits and clocks. These factors typically account for 50% to 80% of the total uncertainty in individual IWV estimates (Ning et al., 2016; Stepniak et al., 2022). Additional sources of error arise from the computation of the Zenith Hydrostatic Delay (ZHD) and the conversion coefficient κ (Rueger et al., 2002; Ning et al., 2016; Bock et al., 2021). A typical accuracy range for GNSS-derived IWV is 1 to 2 kg m⁻², which may include a small systematic component of up to ±0.5 kg m⁻² or ±2% (Bock et al., 2013; Bock et al., 2022). The accuracy of GNSS-derived IWV is somewhat site dependent, as some errors scale with the IWV itself, which varies significantly across space (e.g., from the equator to the poles) and time (seasonally and with daily weather fluctuations). The computed GNSS IWV values are usually accompanied by an uncertainty estimate that reflects the combined impact of these error sources.
Note that Integrated Water Vapor (IWV) is also commonly referred to as Total Column Water Vapor (TCWV) and Precipitable Water (PW) or Precipitable Water Vapor (PWV). TCWV and IWV are typically expressed in units of kg m⁻², while PW and PWV represent the equivalent water height, usually given in cm or mm. These units are interchangeable, as 1 kg m⁻² of IWV corresponds to 1 mm of PW.
Available GNSS ZTD and IWV data sets
A number of different institutions and research groups around the world provide estimates of ZTD and IWV from permanent GNSS stations or GNSS data collected during campaigns. The main institutional providers are IGS (igs.org/products), with final/rapid ZTD products and global coverage, EUREF (epncb.oma.be), for Europe, with near real time and reprocessed ZTD and IWV data, UNAVCO/EarthScope (unavco.org/data) and SIRGAS (sirgas.ipgh.org), for Americas, with real-time and post-processed ZTD data. A subset of the IGS and EUREF data are distributed by the Copernicus Climate Change Service (C3S; cds.climate.copernicus.eu) and AERIS (aeris-data.fr), the French Data and Services Centre for the atmosphere, after quality-control and conversion to IWV following the recommendations given in the COST Action GNSS4SWEC final report (Jones et al., 2020; Bock, 2020).
GNSS IWV data set used for the BAMS State of the Climate report
AERIS distributes a variety of GNSS IWV data sets, including permanent global and regional networks, as well as campaigns. Most of them are produced by Institut de Physique du Globe de Paris (IPGP) and collaborators. The ZTD data undergo a strict quality control and quality assessment, followed by a state-of-the-art conversion to IWV (Bock, 2020).
Some of the ZTD data are provided by other groups such as the Center for Orbit Determination in Europe (CODE; Susnik et al., 2016; Dach et al., 2024) and the Nevada Geodetic Laboratory (NGL; Blewitt et al., 2018). Both ZTD products are available globally and cover the full GNSS history (1994 to present). The IPGP/CODE GNSS IWV data set (https://doi.org/10.25326/68) is updated annually and used in BAMS State of the Climate report since 2018. The IPGP/NGL GNSS IWV data set (https://doi.org/10.25326/518) includes more than 6,000 stations and currently covers 1994-2022.
Post-processing of the ZTD and IWV time series includes outlier removal (Bock, 2020) and homogenization (Quarello et al. 2022; Nguyen et al., 2024). Outliers are removed in a two-step procedure consisting of: (i) screening ZTD estimates and their formal errors at the nominal temporal resolution (e.g. hourly), and (ii) comparing GNSS IWV estimates with model-equivalent values computed from an atmospheric reanalysis such as ECMWF version 5 (ERA5). GNSS ZTD estimates are converted to IWV using ZHD and T_m computed from 6-hourly pressure-level data extracted from ERA5 with bi-linear horizontal interpolation from the four surrounding grid points.
The GNSS IWV data sets are provided at 6-hourly, daily, and monthly temporal resolutions. Daily mean values are computed as weighted means of 00, 06, 12, 18 UTC of the day and 00 UTC the following day. Monthly IWV values are computed from the 6-hourly data, requiring a minimum of 60 values per month. Further details about ZTD screening and IWV conversion can be found in Bock (2020).
What are the key strength of this data set?
The IPGP/CODE GNSS IWV data set (https://doi.org/10.25326/68) is currently one of the highest-quality GNSS IWV data sets available globally, covering the full GNSS history (1994 to present). The number of stations has being continuously increasing over time as the IGS network expanded, from approximately 70 in 1994 to its nominal number (~400) in 2010 (https://network.igs.org/).
The commitments and long-term plans of IGS ensure that the stations and data products remain findable, accessible, interoperable, and reusable (FAIR).
The accuracy of the derived GNSS IWV estimates, measured in terms of root-mean-square error (RMSE), is better than ±2 kg m⁻² or ± 5% (Bock et al., 2013).
What are the key limitations of this data set?
The GNSS IWV time series may contain spurious (non-climatic) signals due to unaccounted changes in instrumentation (antenna and radome), as well as changes in the measurement environment and/or data analysis procedures.
The current release of the IPGP/CODE GNSS IWV data set (https://doi.org/10.25326/68) is not homogenized; however, the next release will be, following the statistical methods described in Quarello et al. (2022) and Nguyen et al. (2024).
What are the typical research applications of this data set?
This data set is designed to monitor IWV variations relevant to climate change and variability at a global scale. It is typically used as an independent observing system, complementing and helping to assess other observational and modeling data sets (Bock et al., 2025).
How does one best compare these data with model output?
This data set contains only station-based observations. For precise model-to-observation comparisons, it is recommended to extract the model variables at the locations of the stations before computing spatial averages.
Note that, due to the limited spatial coverage of the GNSS stations, regional or global averages computed from either data set (https://doi.org/10.25326/68 or https://doi.org/10.25326/518) may not represent full coverage spatial averages such as those traditionally obtained from climate model simulations.
How is uncertainty characterized in these data?
The uncertainty estimates accompanying the IWV values are derived from the formal errors of the ZTD values provided by the GNSS data analysis centers. These uncertainties are converted to IWV using Equation (1) and propagated to the final temporal resolution, taking into account the uncertainties of the individual components under the assumption of no serial correlation.
Were corrections made to account for changes in observing systems or practices, sampling density, satellite drift, or similar issues?
GNSS data processing includes numerous corrections for various (geo-)physical and instrumental effects and changes, such as solar radiation pressure on the satellites, phase center offsets and variations of transmitter and receiver antennas, Earth rotation, gravity field variations, solid Earth tides, and other deformations.
The completeness of station equipment logs is sometimes uncertain, and undocumented changes may introduce spurious offsets in the products. Therefore, inspection of the homogeneity of the derived IWV time series is recommended.
How do I access these data?
Several GNSS IWV data sets are publicly and permanently available from the AERIS web server. Each dataset is assigned a DOI, includes a copyright policy, and provides instructions on how to cite it. Below are links to the most widely used data sets, including long-term global and continental networks, as well as limited-area or campaign-based data sets. Additional data sets can be found by searching the catalog.
- Bock, O. & Bosser, P. (2014). HYMEX Special Observing Period, reprocessed GPS delays and IWV [1000+ stations in the Mediterranean area, September 1, 2012 to March 31, 2013] https://doi.org/10.6096/MISTRALS-HyMeX.1280
- Bock, O. (2021). GNSS Integrated Water Vapour data over France and Europe, for EURO- and Med-CORDEX [400+ stations, 2000-2009], https://doi.org/10.25326/294
- Bock, O., Bosser, P., Flamant, C., Doerflinger, E. & Jansen, F. (2021). Reprocessed IWV data from ground-based GNSS network over the Carribean region [49 stations, year 2020], https://doi.org/10.25326/296
- Bock, O. (2023). Global GNSS Integrated Water Vapour data based on NGL repro3 [6000+ stations, 1994-2022], https://doi.org/10.25326/518
- Bock, O. (2025). Global GNSS Integrated Water Vapour data [436 stations, 1994-2024] https://doi.org/10.25326/68
References
- Bevis, M., S. Businger, T.A. Herring, C. Rocken, R.A Anthes, and R.H. Ware, GPS Meteorology: Remote Sensing of the Atmospheric Water Vapor Using the Global Positioning System, J. Geophys. Res., 97, 15787-15801, 1992, https://doi.org/10.1029/92JD01517
- Blewitt, G.,Hammond, W. C., and Kreemer, C. (2018), Harnessing the GPS data explosion for interdisciplinary science, Eos, 99, https://doi.org/10.1029/2018EO104623
- Bock, O., Bosser, P., Bourcy, T., David, L., Goutail, F., Hoareau, C., Keckhut, P., Legain, D., Pazmino, A., Pelon, J., Pipis, K., Poujol, G., Sarkissian, A., Thom, C., Tournois, G., and Tzanos, D. (2013) Accuracy assessment of water vapour measurements from in-situ and remote sensing techniques during the DEMEVAP 2011 campaign at OHP, Atmos. Meas. Tech., 6, 2777-2802, 2013, https://doi.org/10.5194/amt-6-2777-2013
- Bock, O. (2020) Standardization of ZTD screening and IWV conversion, in: Advanced GNSS Tropospheric Products for Monitoring Severe Weather Events and Climate: COST Action ES1206 Final Action Dissemination Report, edited by Jones, J., Guerova, G., Douša, J., Dick, G., de Haan, S., Pottiaux, E., Bock, O., Pacione, R., and van Malderen, R., chap. 5, pp. 314–324, Springer International Publishing, https://doi.org/10.1007/978-3-030-13901-8_5
- Bock, O., Bosser, P., Flamant, C., Doerflinger, E., Jansen, F., Fages, R., Bony, S., and Schnitt, S. (2021) Integrated water vapour observations in the Caribbean arc from a network of ground-based GNSS receivers during EUREC4A, Earth Syst. Sci. Data, 13, 2407–2436, https://doi.org/10.5194/essd-13-2407-2021
Bock, O., Bosser, P., and Mears, C. (2022) An improved vertical correction method for the inter-comparison and inter-validation of integrated water vapour measurements, Atmos. Meas. Tech., 15, 5643–5665, https://doi.org/10.5194/amt-15-5643-2022 - Bock, O., Mears, C., S. P. Ho, and S. Xi (2025) Total column water vapor [in “State of the Climate in 2024”]. Bull. Amer. Meteor. Soc., 106 (8), S80–S81, https://doi.org/10.1175/BAMS-D-25-0102.1.
Dach, Rolf, Schär, Stefan, Arnold, Daniel, Kalarus, Maciej Sebastian, Prange, Lars, Stebler, Pascal, Villiger, Arturo, & Jäggi, Adrian. (2024). CODE final product series for the IGS. University of Bern. https://doi.org/10.7892/BORIS.75876.3 - Guerova, G., Jones, J., Dousa, J., Dick, G., de Haan, S., Pottiaux, E., Bock, O., Pacione, R., Elgered, G., Vedel, H., and Bender, M.: Review of the state-of-the-art and future prospects of the ground-based GNSS meteorology, Atmos. Meas. Tech., 9, 5385-5406, 2016, https://doi.org/10.5194/amt-9-5385-2016
- Jones, J., Guerova, G., Douša, J., Dick, G., de Haan, S., Pottiaux, E., Bock, O., Pacione, R., van Malderen, R. (Eds.) (2020) Advanced GNSS Tropospheric Products for Monitoring Severe Weather Events and Climate: COST Action ES1206 Final Action Dissemination Report ; Springer International Publishing: Cham, Switzerland, 2020 ; https://doi.org:10.1007/978-3-030-13901-8
- Nguyen, K. N., Bock, O., and Lebarbier, E. (2024). A statistical method for the attribution of change-points in segmented Integrated Water Vapor difference time series. International Journal of Climatology, 44(6), 2069–2086. https://doi.org/10.1002/joc.8441
- Ning, T., Wang, J., Elgered, G., Dick, G., Wickert, J., Bradke, M., Sommer, M., Querel, R., and Smale, D. (2016) The uncertainty of the atmospheric integrated water vapour estimated from GNSS observations, Atmos. Meas. Tech., 9, 79–92, https://doi.org:10.5194/amt-9-79-2016
- Quarello, A., Bock, O., Lebarbier (2022) GNSSseg, a statistical method for the segmentation of daily GNSS IWV time series, Remote Sensing, 14, 3379, https://doi.org/10.3390/rs14143379
- Rueger, J. (2002) Refractive Index Formulae for Radio Waves, https://www.fig.net/resources/proceedings/2002/fig_2002/fig_2002_abs/Js28/JS28_rueger_abs.pdf
- Stepniak, K., O., Bock, P., Bosser, P., Wielgosz (2022) Outliers and uncertainties in GNSS ZTD estimates from double difference processing and Precise Point Positioning, GPS Solutions, 26:74, https://doi.org/10.1007/s10291-022-01261-z
- Susnik, A., Dach, R., Villiger, A., Maier, A., Arnold, D., Schaer, S. and Jaeggi, A. (2016) CODE reprocessing product series, Astronomical Institute, University of Bern, http://doi.org/10.7892/boris.80011
Cite this page
Acknowledgement of any material taken from or knowledge gained from this page is appreciated:
National Center for Atmospheric Research Staff (Eds). Last modified "The Climate Data Guide: Total Column Water Vapor: Integrated Water Vapor from GNSS stations.” Retrieved from https://climatedataguide.ucar.edu/climate-data/total-column-water-vapor-integrated-water-vapor-gnss-stations on 2026-07-15.
Citation of datasets is separate and should be done according to the data providers' instructions. If known to us, data citation instructions are given in the Data Access section, above.
Acknowledgement of the Climate Data Guide project is also appreciated:
Schneider, D. P., C. Deser, J. Fasullo, and K. E. Trenberth, 2013: Climate Data Guide Spurs Discovery and Understanding. Eos Trans. AGU, 94, 121–122, https://doi.org/10.1002/2013eo130001
Key Figures
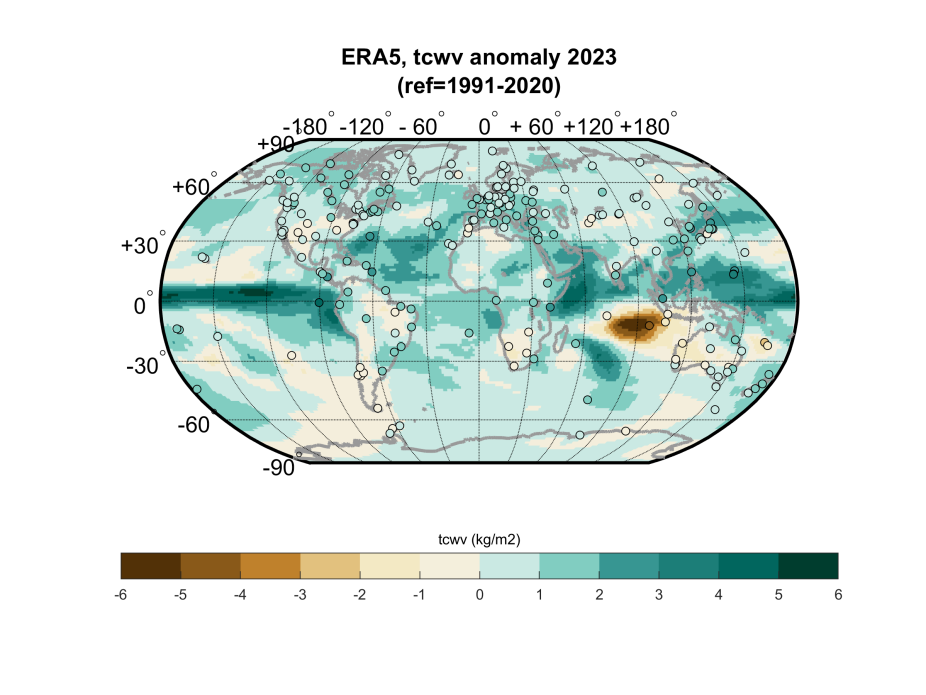
Figure 1: TCWV anomalies (unit kg m-2) from ERA5 reanalysis (shading) and 225 selected ground-based GNSS stations (filled circles) for the year 2023 which is characterized by a strong El-Niño event. GNSS data set IPGP/CODE (https://doi.org/10.25326/68). The shorter time series from the GNSS observations have been adjusted, so there is zero mean difference relative to the ERA5 results.
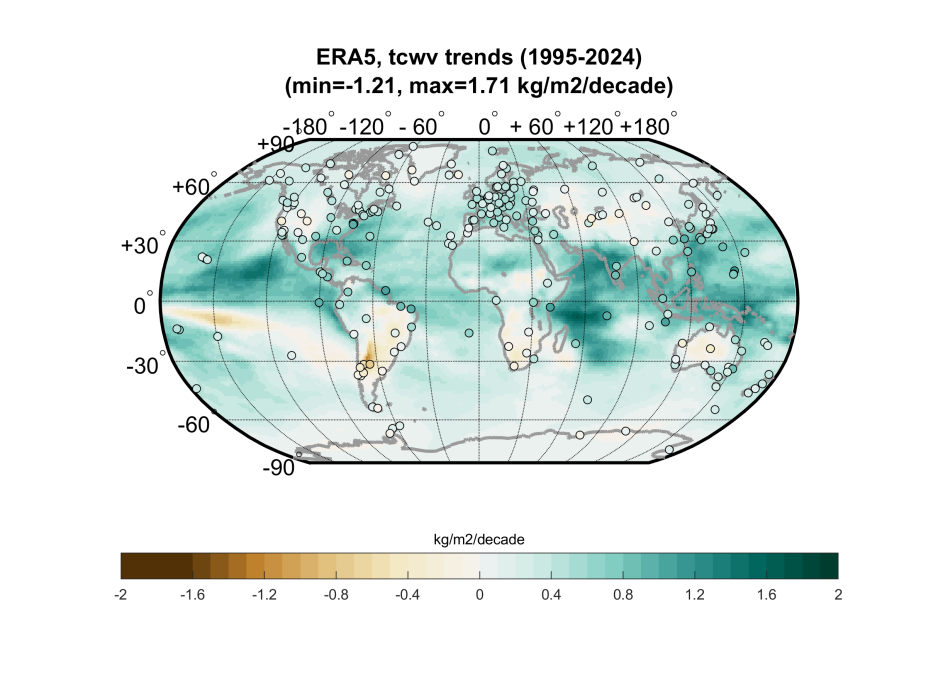
Figure 2: Linear trends of TCWV from ERA5 (shaded) and 236 selected ground-based GNSS stations (filled circles) over the period 1995 – 2024 (GNSS data set: IPGP/CODE, https://doi.org/10.25326/68). The shorter time series from the GNSS observations have been adjusted, so there is zero mean difference relative to the ERA5 results.
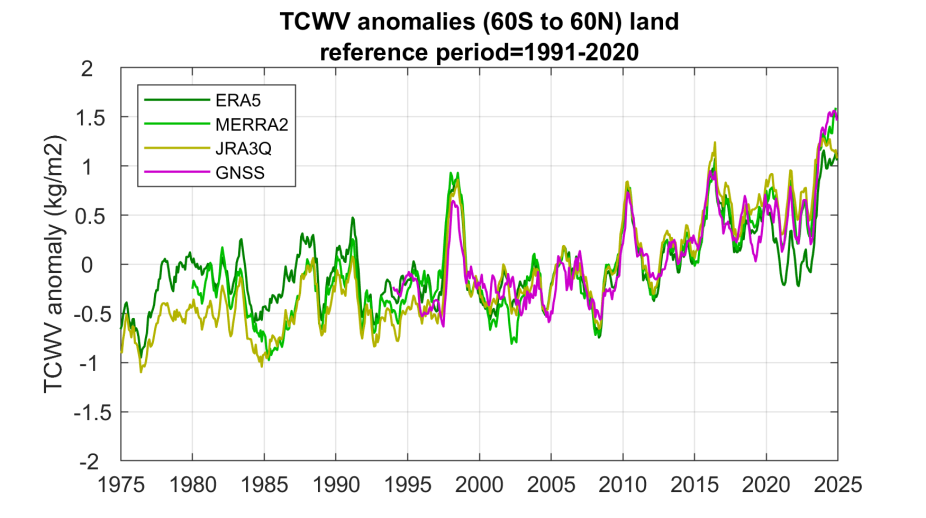
Figure 3: Monthly near-global average (60°S–60°N) total column water vapor annual anomalies (1991–2020 base period, unit: kg m⁻²) over land are shown from three global reanalyses and ground-based GNSS observations (dataset: IPGP/CODE; https://doi.org/10.25326/68). The strong positive anomalies in 1996/97, 2009/10, 2015/16, and 2023/24 correspond to major El Niño events. The anomalies are computed by subtracting the mean annual cycle from each grid point (for reanalyses) or station data (for GNSS), followed by latitude-weighted spatial averaging. Due to the limited spatial coverage of the GNSS network, the GNSS time series may not perfectly represent the true spatial average.