Tree-ring width chronologies: An overview of their use as climate proxies and of available databases
The width of an annual tree ring is a very simple indicator of the character of that year’s weather, but collectively the global network of tree-ring width measurements represents an invaluable resource for high-resolution paleoclimatology.
Key Strengths
Trees routinely can attain ages in excess of a few hundred years, and numerous species can live for over a thousand years. Archeological and sub-fossil wood can be used to extend ring-width records even further back in time.
Annual resolution with highly accurate dating
Compared with other types of proxies, tree-ring width measurements are relatively easy and inexpensive to produce. Records are available from hundreds of thousands of trees around the world, spanning many different climatic zones.
Key Limitations
The global tree-ring network is much denser in the mid- and high- latitudes of the Northern Hemisphere than in the rest of the world.
Many tree-ring records use an archaic data format that is not easily readable with modern analytical tools.
Regional differences in the nature and clarity of climate information preserved within tree-ring width records have an enormous influence on the type and quality of paleoclimatic reconstructions that may be produced from ring-width data in a given region.
Expert User Guidance
The following was contributed by Dr. Scott St. George, December, 2022:
General overview
The width of an annual tree ring is a very simple indicator of the character of that year’s weather, but collectively the global network of tree-ring width measurements represents an invaluable resource for high-resolution paleoclimatology.
The International Tree-Ring Databank (ITRDB) is the main archive of digital tree-ring width measurements. Established in 1974, the ITRDB is maintained by the US National Oceanic and Atmospheric Administration and includes more than 5,300 ring-width records from all continents except Antarctica. Ringwidth data stored in the ITRDB follows the “Tucson Decadal Format” (TDF) standard, which describes the sample identification, calendar dates, and ring-width measurements for individual tree-ring series. Each collection, which is made up of data from one to several hundred trees, also includes metadata describing the location and elevation of the sampling site, tree species, the start and end dates of the combined record, the country and/or state of origin, and the data producers.
The reformatted ITRDB (rITRDB) is a corrected and compiled database containing all measurements of tree-ring width (and wood density and isotopic composition) held by the ITRDB on June 2017. The rITRDB can be downloaded as a single file containing data and metadata for 8,326 individual contributions, with formatting errors in the original data (mainly due to the use of non-standard Latin characters and repeated identification numbers) having been corrected.
The PAGES2k proxy temperature database (version 2) is a community-sourced compilation of 692 terrestrial and marine records. The majority of the records (59%) are tree-ring chronologies — composite series made by averaging together measurements of tree-ring width, wood density, isotopic composition, or other anatomical or biogeochemical variables from several dozen or more trees at the same location.
The global tree-ring width network is best represented in the mid- and high-latitudes, particularly in the Northern Hemisphere, but recent collections have begun to fill in the gap in equatorial regions. The Tropical Tree-Ring Network includes more than 400 tree-ring chronologies compiled from tropical and subtropical latitudes and describes growth over the most recent 50 years at each location.
What are the key strengths of this data set?
Ring-width data have several advantages that make them effective climate proxies.
First, trees routinely attain ages in excess of several hundred years, and more than 35 species are known to live a thousand years or longer. Ring-width records can be extended farther back in time through the addition of archeological or subfossil wood, and some of these blended records span several millennia.
Second, tree-ring records have annual resolution (each ring can be assigned to a single growing season) and the accuracy of their dating is confirmed by a rigorous cross-comparison procedure. In many cases, the dating of tree-ring sequences have been corroborated by identifying unusual anatomical features associated with known historic and paleoenvironmental events, such as fire scars, extreme floods, and volcanically-induced cooling.
Third, because temperate and boreal forests occupy more than a quarter of Earth’s land mass, trees that go through an annual cycle of dormancy and activity (and as a result, form discrete annual rings) are very common, particularly in the mid-latitudes of the Northern Hemisphere. Ring-width records have been obtained from hundreds of different tree species and span a broad range of environments, including the equatorial zone, the northern limit of erect trees, and high-elevation sites more than 4200 meters above sea level.
Finally, the fact that ring-width measurements are comparatively easy and inexpensive to produce has allowed dendrochronologists to generate sequences from hundreds of thousands of trees around the planet (Figure 1).
What are the key limitations of this data set?
The global tree-ring network is biased towards the mid- and high-latitudes of the Northern Hemisphere, and ring-width records are much less common for the tropics and much of the Southern Hemisphere. This deficiency is either because the climate of these areas is not seasonal enough to consistently induce dormancy in trees (for example, in areas such as Amazonia, tropical Africa, and Indonesia) or is too arid to support forests (for instance, Saharan Africa, the Middle East, and central Australia).
Because its data format was developed in the 1960s, standard tree-ring data is not easily read by modern analytical tools and nearly a third of individual ITRDB files have formatting errors or inconsistencies. The most common problems include (i) the use of non-standard Latin characters, (ii) blank lines separating lines of data, (iii) ring-width series sharing the same identification codes, and (iv) multiple copies of the same ring-width series.
What are some common mistakes that users encounter when processing or interpreting these data?
Compared to the original tree-ring width measurements, tree-ring chronologies offer several advantages. They are easier than sample- or tree-level data to incorporate into regional syntheses, they have been pre-processed to remove the confounding influence of tree size or age, and they are often adjusted to minimize or eliminate biologically-driven persistence. But the devil is in the detail. Choices made during the production of tree-ring chronologies can have major implications for their interpretation, but those decisions are not typically documented in metadata and therefore cannot be known by end users.
It is sometimes asserted (wrongly) that tree-ring width chronologies provide information about generally the same aspects of climate. To the contrary, the environmental information that is encoded into tree rings is known to vary substantially across climatic and ecological gradients (Figure 2). In cold Arctic or alpine forests, summer temperature is the primary factor that influences ring width (and wood density). But in warmer locales, those same tree-ring variables mainly reflect moisture availability during the growing season, whether delivered by summer rains or passed over from winter by gradual snowmelt. The major regional differences in the nature and clarity of climate information preserved within tree-ring width records have an enormous influence on the type and quality of paleoclimatic reconstructions that may be produced from ring-width data in a given region.
Tree-ring sequences are not dated by simply counting rings back in time. Instead, they are dated by matching relative growth patterns across many trees at multiple locations, with successful cross-dating between individual records reported at distances exceeding 1100 kilometers. The global tree-ring calendar has also been independently confirmed by the discovery of a number of short-lived global surges in atmospheric C14 production during the Common Era. The prominent radiocarbon spike in CE 774-775 has been detected in tree-ring chronologies from Japan, Germany, Siberia, California, the Austrian Alps, New Zealand, and many other locations (Figure 3). The fact that the same C14 signatures are discernible in many chronologies from both the Northern and Southern hemispheres is irrefutable evidence of the accuracy of tree-ring dating back over — at least — the past twelve centuries.
What are the likely spurious (non-climatic) features, if any, of time series derived from these data?
Trees are complex biological organisms, and the sequence of wide and narrow rings present within any individual tree can be influenced by a number of biotic and abiotic factors. As a result, the ring-width pattern from any single tree will display some behavior that is shared with other trees in the same stand (and perhaps trees in nearby or distant stands) as well as variance unique to that specimen. If trees within the same plot exhibit similar ring-width patterns through time, that synchronous behavior may be connected to one or more environmental factors that affect the entire stand (such as climate and ecological disturbance).
Describe any conversion steps that are necessary or general strategies to compare these data with model output.
Almost all tree-ring measurements from individual trees contain strong trends due to endogenous (biological) factors, so before they can be compiled and interpreted as evidence of exogenous (environmental) influences, those age/size trends need to be filtered out through a procedure known as detrending or standardization. In ring-width sequences, the most obvious feature is often a gradual decline from wide to narrow rings as the tree ages. The principal reason for this trend is structural — as the tree grows larger with age, it is obliged to form a similar volume of new wood about the ever-increasing circumference of its bole.
How is uncertainty characterized in these data?
It is unwise to interpret a ring-width series from an individual tree - or even a composite record from many trees in the same forest - as a surrogate measure of only one environmental control. To a degree, this limitation can be circumvented by sampling in locations where tree growth is plausibly connected to a single, dominant limiting factor, but even so there is no substitute for the advantages offered by replication. Research in dendrochronology and dendroclimatology is based on the premise that patterns appearing within many trees at many locations are more likely to reflect important aspects of tree growth than those exhibited by a few individuals. In the same manner, we might be more confident about those aspects of climate that are expressed very clearly in many ring-width records, and act more cautiously when interpreting signals that are weaker or appear less often.
Provide a summary statement about these data and their utility for climate research and model evaluation.
For several decades, tree-ring widths have been one of the main proxies used in high-resolution paleoclimatology and these data continue to be used regularly as the sole or leading source for paleoclimate reconstructions spanning the late Holocene. Beyond the archive’s own intrinsic qualities, the central role played by ring-width records in modern paleoclimatology is also due to the global network’s massive replication and widespread geographic coverage. Those qualities are testament to the dendrochronological community’s long-standing commitment to field collection, record development, and data sharing.
Cite this page
Acknowledgement of any material taken from or knowledge gained from this page is appreciated:
St. George, Scott & National Center for Atmospheric Research Staff (Eds). Last modified "The Climate Data Guide: Tree-ring width chronologies: An overview of their use as climate proxies and of available databases.” Retrieved from https://climatedataguide.ucar.edu/climate-data/tree-ring-width-overview-as-climate-proxies-and-open-databases on 2026-06-15.
Citation of datasets is separate and should be done according to the data providers' instructions. If known to us, data citation instructions are given in the Data Access section, above.
Acknowledgement of the Climate Data Guide project is also appreciated:
Schneider, D. P., C. Deser, J. Fasullo, and K. E. Trenberth, 2013: Climate Data Guide Spurs Discovery and Understanding. Eos Trans. AGU, 94, 121–122, https://doi.org/10.1002/2013eo130001
Key Figures
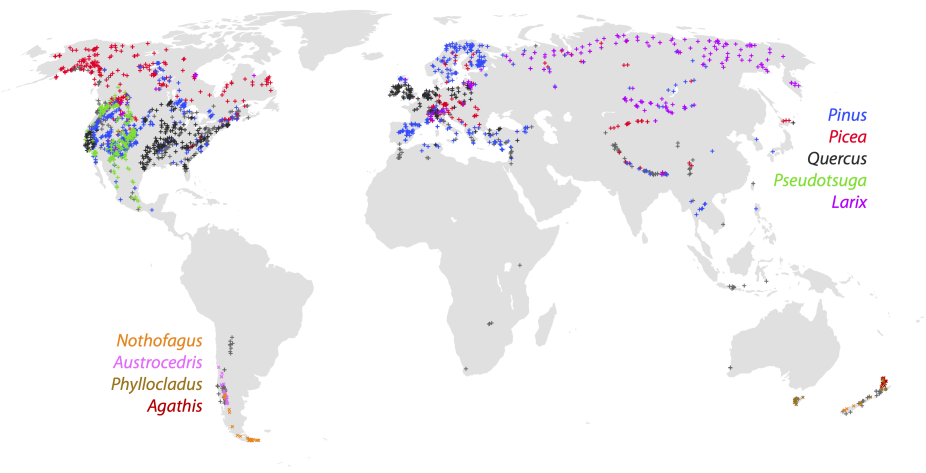
Figure 1: The global network of tree-ring width data held by the World Data Center for paleoclimatology, NOAA. Colored crosses mark the location of ring-width records from the tree genera most commonly used. Records derived from genera other than those included in the legend are indicated by grey crosses. From St. George (2014).

Figure 2: Map showing the imprint of seasonal climate within tree-ring widths. The color of each circle corresponds to the absolute magnitude of the correlation between ring-width and local summer temperature (red), summer precipitation (blue), and winter precipitation (green). The spokes along the color wheel represent correlations coefficients ranging from zero (central circle) to one (outermost circle), with each step corresponding to an increment of 0.25. For illustration, a record that is well correlated (either positively or negatively) with winter precipitation (r ≅ ±0.7) but uncorrelated with both summer precipitation and temperature (r ≅ 0) would be drawn in bright green. Records that reflect a blend of climate factors are represented by intermediate tones, while those drawn in black have near-zero correlations with all three variables. From St. George and Ault (2014).
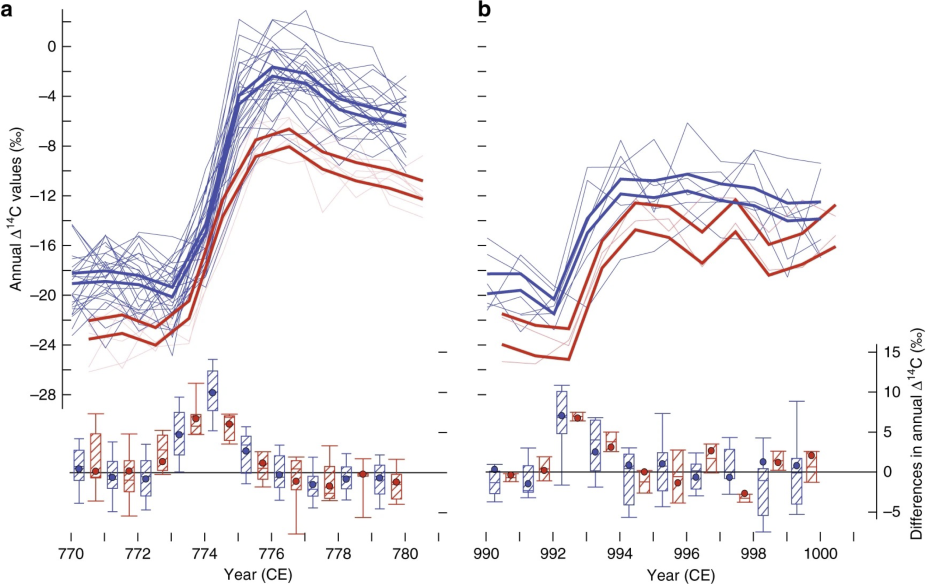
Figure 3: The accuracy of the tree-ring calendar has been independently confirmed by globally-coherent signatures of cosmogenic radiocarbon events in CE 774 and 993. (a) Annual 14C content of 374 tree rings formed between CE 770 and 780 at 27 and seven sites across the Northern Hemisphere (NH) and Southern Hemisphere (NH), respectively (light blue and red lines). (b) 14C content of 110 tree rings from CE 990–1000 at eight and two sites in the NH and SH (blue and red lines), respectively. The Thick lines bracket standard uncertainties around the hemispheric means, and the lower box plots reveal year-to-year 14C differences (median, 25th and 75th percentiles). From Büntgen et al., 2018.
Other Information
- St. George, S., 2014: An overview of tree-ring width records across the Northern Hemisphere. Quaternary Science Reviews, 95, 132–150, https://doi.org/10.1016/j.quascirev.2014.04.029.
- St. George, S., and T. R. Ault, 2014: The imprint of climate within Northern Hemisphere trees. Quaternary Science Reviews, 89, 1–4, https://doi.org/10.1016/j.quascirev.2014.01.007.
- Büntgen, U., and Coauthors, 2018: Tree rings reveal globally coherent signature of cosmogenic radiocarbon events in 774 and 993 CE. Nat Commun, 9, https://doi.org/10.1038/s41467-018-06036-0.