Coral geochemical records: An overview of their use as climate proxies and of available databases

Coral records are one of the main types of high-resolution (annual to sub-annual) paleoclimate proxies, providing timeseries of environmental conditions reaching hundreds to thousands of years into the past in the tropics, the central driver of the global atmospheric circulation. As such, corals complement paleoclimate records from the largely mid-latitude tree-ring network and the largely high-latitude ice core and lake sediment networks. Coral geochemical proxies are widely used to reconstruct past changes in tropical climate variability and investigate its response to natural and anthropogenic forcings. Coral climate reconstructions provide important out-of-sample tests of climate model simulations. This post summarizes what aspects of climate coral records capture, the major strengths and limitations of corals as climate proxies, and the major available databases of coral-derived data.
Key Strengths
Corals provide climate information from under-sampled tropical regions
Well-dated chronologies with annual to sub-annual resolution that reach hundreds of years into the past
Paired Sr/Ca and δ18O measurements jointly provide temperature and hydroclimate information.
Key Limitations
Most fossil coral records are short (<100 years) and do not extend to the 20th or 21st centuries.
Sr/Ca-SST calibration methods and equations are not standardized and often site-specific. That is to say, a calibration uncertainty exists when converting the proxy measurement to a geophysical variable such as SST.
Most published fossil coral records do not extend back to time intervals prior to the Holocene. That said, advancements in coral drilling have provided the opportunity to recover older samples.
- Grothe et al. (2019) modern and fossil coral δ18O data compilation from the Line Islands in the central equatorial Pacific.
- Emile-Geay et al. (2015) compiled ~2000 years of published coral and mollusk δ18O data from ENSO-sensitive locations across the western, central, and eastern Pacific.
- The PAGES CoralHydro2k database (Walter et al., 2023)
- Coral records from NOAA NCEI World Data Service for Paleoclimatology (WDS Paleo)
- Coral records from World Data Center PANGAEA (search by investigator, location, or time interval)
Expert User Guidance
The following was contributed by Dr. Allison Lawman, June, 2023:
Overview
The tropical oceans are powerful drivers of temperature and hydroclimate patterns worldwide. Paleoclimate records from shallow-water, reef-building corals (Figure 1) extend the instrumental record and provide decades to centuries of high-resolution (annual to sub-annual) temperature and hydroclimate information from the tropical to subtropical oceans (~30°S-30°N). Coral geochemical proxies are widely used to reconstruct past changes in tropical climate variability and investigate its response to natural and anthropogenic forcings. Prominent modes of tropical climate variability include the El Niño-Southern Oscillation (ENSO), tropical Pacific decadal variability, the Indian Ocean Dipole, and tropical variability in the Atlantic.
As a coral grows, tiny coral polyps secrete a skeleton made of aragonite, a crystal form of calcium carbonate (CaCO3). Massive corals can grow several meters in height and live for hundreds of years, providing continuous high-resolution records of environmental conditions. Corals have annual density banding that is visible when thin ~5-7 mm slices of coral skeleton are x-ray imaged perpendicular to the growth axis (Figure 2). The annual density banding along with radiometric dating techniques (Cheng et al., 2013; Shen et al., 2012) provide well-dated chronologies with age uncertainties typically on the order of a few years or less. Fast growth rates of ~0.3-2 cm/year (Thompson, 2021) and precise micro-milling techniques permit annual to sub-annual sampling along the coral’s growth axis.
Changes in the chemical composition of a coral’s skeleton reflect oceanic conditions at the time of growth. Strontium-to-calcium ratios (Sr/Ca) and the oxygen isotopic composition (δ18O) of coral skeletal aragonite are well-established climate proxies (Fairbanks et al., 1997; Lough, 2010). Sea surface temperature (SST) exerts the dominant climate control on coral Sr/Ca (Beck et al., 1992), whereas coral δ18O is jointly influenced by SST and the oxygen isotopic composition of seawater (δ18Osw) (Weber and Woodhead, 1972). δ18Osw is impacted by similar processes as sea surface salinity (e.g., rainfall, evaporation, advection of different water masses, and freshwater runoff; LeGrande and Schmidt, 2006). Hydroclimate signals from coral-inferred δ18Osw values are calculated using paired coral Sr/Ca and δ18O measurements to remove the SST contribution from coral δ18O.
Together, modern (living when collected) and fossil (dead when collected; Figure 1) corals provide climate information from the tropical oceans, a region largely underrepresented among other high-resolution paleoclimate records from tree rings and ice cores.
Key Strengths
• Corals provide climate information from underrepresented tropical regions.
• Annual to sub-annual resolution.
• Well-dated chronologies.
• Paired Sr/Ca and δ18O measurements jointly provide temperature and hydroclimate information.
Key Limitations
• Most fossil coral records are short (<100 years) and do not extend to the 20th or 21st centuries.
• Inter-coral colony replication is limited.
• Sr/Ca-SST calibration methods and equations are not standardized and often site-specific.
• Most published fossil coral records do not extend to time intervals prior to the Holocene. That said, recent advancements in coral drilling provide the opportunity to recover older samples.
Types of Uncertainties in Coral Proxy Records
• Analytical uncertainty
• Chronological uncertainty (layer-counting errors and radiometric dating errors)
• Calibration uncertainty
• “Geological” uncertainty due to uncertainties about the oceanographic setting (for fossil corals) or sampling
Publicly Available Coral Data Compilations
Many coral proxy records are available from public repositories such as the NOAA National Centers for Environmental Information World Data Service for Paleoclimatology (WDS Paleo) (https://www.ncei.noaa.gov/access/paleo-search/?dataTypeId=4) and the World Data Center PANGAEA data publisher (https://www.pangaea.de/). These repositories enable users to search for coral records by investigator, location, or time interval.
The PAGES CoralHydro2k database (Walter et al., 2023) is a comprehensive, community-sourced compilation of peer-reviewed coral records from the Common Era (CE). The database is available for download from the WDS Paleo (https://www.ncei.noaa.gov/metadata/geoportal/rest/metadata/item/noaa-coral-35453/html). Version 1 of the database includes 54 paired Sr/Ca-δ18O records, 79 unpaired δ18O records, and 29 unpaired Sr/Ca records that span the global tropics (Figure 3). This dataset is available in the Linked Paleo Data (LiPD) standardized format and includes serializations in Python, MATLAB, and R. Example scripts that demonstrate how to query the database are provided on the CoralHydro2k GitHub repository (https://github.com/CoralHydro2k/).
The CoralHydro2k database builds upon the work of PAGES Ocean2k (Tierney et al., 2015) and PAGES Iso2k (Konecky et al., 2020). Many coral records will appear in multiple PAGES2k databases. A notable difference is that the CoralHydro2k database includes short coral records (minimum 10 years in length) that did not meet the length criteria for other PAGES2k databases. All records in the CoralHydro2k database are quality control checked, machine-readable, and include standardized metadata fields.
Fossil coral records from time periods prior to the Common Era are rarer but nonetheless provide important insight about Holocene tropical climate variability. Numerous studies (e.g., Cobb et al., 2013, Emile-Geay et al., 2015, Grothe et al., 2019, Lawman et al., 2022) use Holocene coral records to understand the response of ENSO to orbital and anthropogenic forcing during the Holocene. Emile-Geay et al. (2015) compiled ~2000 years of published coral and mollusk δ18O data from ENSO-sensitive locations across the western, central, and eastern Pacific. The compiled records are available as a MATLAB file from GitHub (https://github.com/CommonClimate/EmileGeay_NatGeo2015/tree/master/data/obs). All records have annual or finer resolution.
Grothe et al. (2019) present an updated modern and fossil coral δ18O data compilation from the Line Islands in the central equatorial Pacific. This synthesis includes over 1700 years of coral data from multiple studies. Collectively, this data compilation covers intervals from ~7,000 years ago through 2016 CE. The average length of an individual fossil coral record is approximately 30 years and provides discrete “snapshots” of climate variability through time. The modern and fossil composite MATLAB data files from Grothe et al. (2019) are available from the WDS Paleo (https://www.ncei.noaa.gov/access/paleo-search/study/22415).
Additional Details
Coral Age Models
The layer-counted chronologies for modern corals are assigned ages based on the date of collection. Radiometric dates provide chronological tie points for fossil corals. For corals sampled at approximately monthly resolution, the sub-seasonal chronology is typically determined by assigning annual local maxima and/or local minima in the coral geochemical data a calendar month based on the climatology at the study site.
Proxy Calibrations
Coral proxy calibrations may use local in-situ measurements or gridded climate data products. At present, there is no standardized Sr/Ca-SST calibration equation. Slope values for the linear Sr/Ca‐SST transformation typically fall within the −0.06 ± 0.01 (±1σ) mmol/mol/°C range for the Indo‐Pacific (Corrège, 2006). The temperature dependence for δ18O at individual coral sites may range from −0.10 to −0.34‰/°C (Evans et al., 2000), whereas studies that synthesize the results from multiple locations report values of −0.20 (Evans et al., 2000) and −0.22 (Lough, 2004), which are close to the inorganic slope of −0.22‰/°C (Epstein et al., 1953).
Non-climate Influences
Corals are complex living organisms so there may be non-climatic factors or “vital effects” that influence the measured Sr/Ca and δ18O values. To minimize non-climatic influences, it is crucial to carefully sample a coral along its maximum growth axis (DeLong et al., 2013). Primary coral aragonite material should also be screened for diagenesis before sampling.
Strategies for Comparing Coral Proxy Data with Model Output
Coral climate reconstructions provide important out-of-sample tests of climate model simulations. Typically, paleoclimate proxy data is transformed into a climate variable (e.g., SST) using empirically determined calibration equations.
Alternatively, forward modeling via a proxy system model (PSM) transforms observations or climate model output into “pseudoproxies” that estimate the proxy signal (Evans et al., 2013; Dee et al., 2015). This is a common approach for both model-data comparisons and data assimilation. A PSM mathematically models how different processes impact a climate signal that emerges from the proxy data. Simple coral PSMs use observations or climate model output to forward model coral δ18O as a linear combination of temperature and salinity or δ18Osw (if available) (Thompson et al., 2011).
Other more complex coral PSMs (Lawman et al., 2020) include other processes and assumptions inherent to coral paleoclimatology. The simulated δ18O generated using a PSM is more directly comparable to coral δ18O observations. Coral-model data comparisons have a wide array of climate applications. For example, Lawman et al., (2022) perform a model-data comparison to investigate the response of ENSO to orbital forcing during the Holocene (Figure 4).
Due to model biases, coral data users should be cautious about direct point‐to‐point comparisons between coral observations and climate model output from a single grid point. Care should be taken to select a region in the model that best matches the climate conditions observed at the proxy site.
Summary
Coral records provide invaluable information about tropical temperature and hydroclimate variability on interannual, decadal, and multi-decadal timescales. New insights about the full range of tropical climate variability and its response to external forcing will help improve the representation of the tropics in climate models and improve projections for the future.
Cite this page
Acknowledgement of any material taken from or knowledge gained from this page is appreciated:
Lawman, Allison & National Center for Atmospheric Research Staff (Eds). Last modified "The Climate Data Guide: Coral geochemical records: An overview of their use as climate proxies and of available databases.” Retrieved from https://climatedataguide.ucar.edu/climate-data/coral-geochemical-records-overview-their-use-climate-proxies-and-available-databases on 2026-06-14.
Citation of datasets is separate and should be done according to the data providers' instructions. If known to us, data citation instructions are given in the Data Access section, above.
Acknowledgement of the Climate Data Guide project is also appreciated:
Schneider, D. P., C. Deser, J. Fasullo, and K. E. Trenberth, 2013: Climate Data Guide Spurs Discovery and Understanding. Eos Trans. AGU, 94, 121–122, https://doi.org/10.1002/2013eo130001
Key Figures
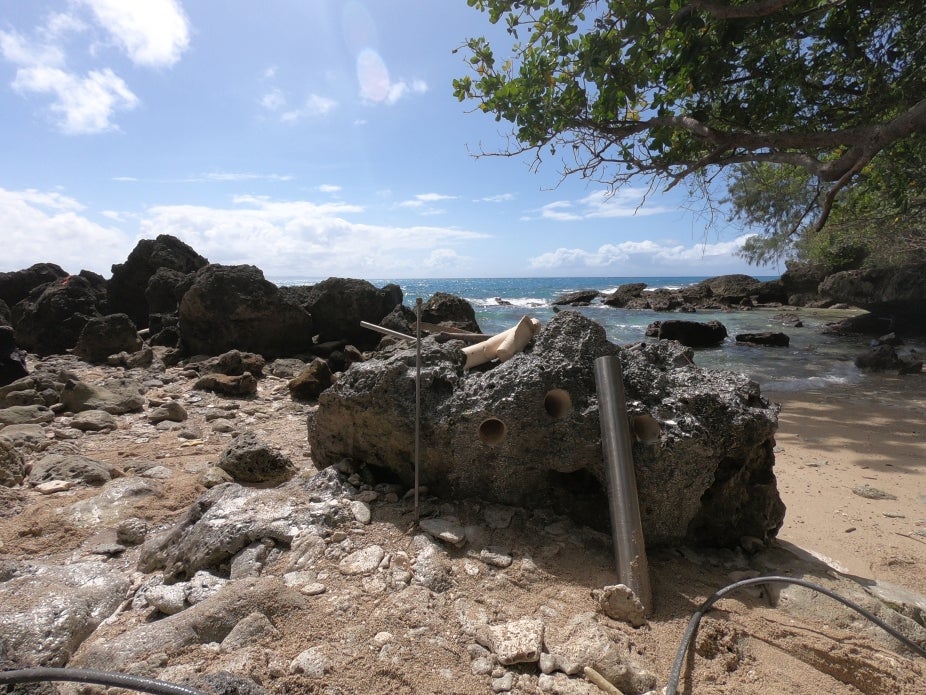
Figure 1. In-situ fossil coral head from Vanuatu, southwest Pacific (Image credit: R. Domeyko, UT Austin).
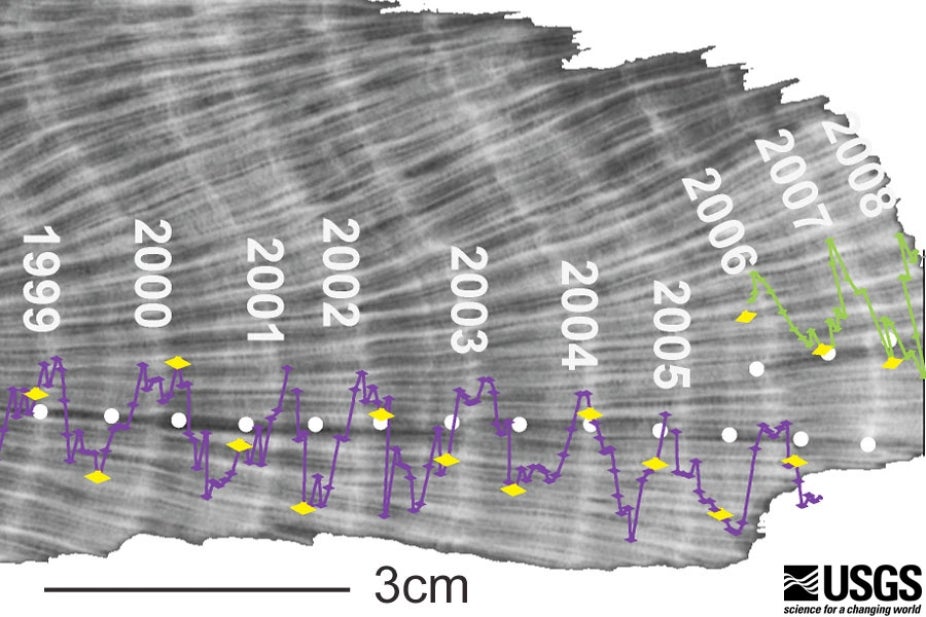
Figure 2. X-ray image illustrating the annual density bands in corals. A Sr/Ca time series is overlain. Each Sr/Ca maximum (winter) to minimum (summer) represents an annual temperature cycle. (Image credit: USGS).
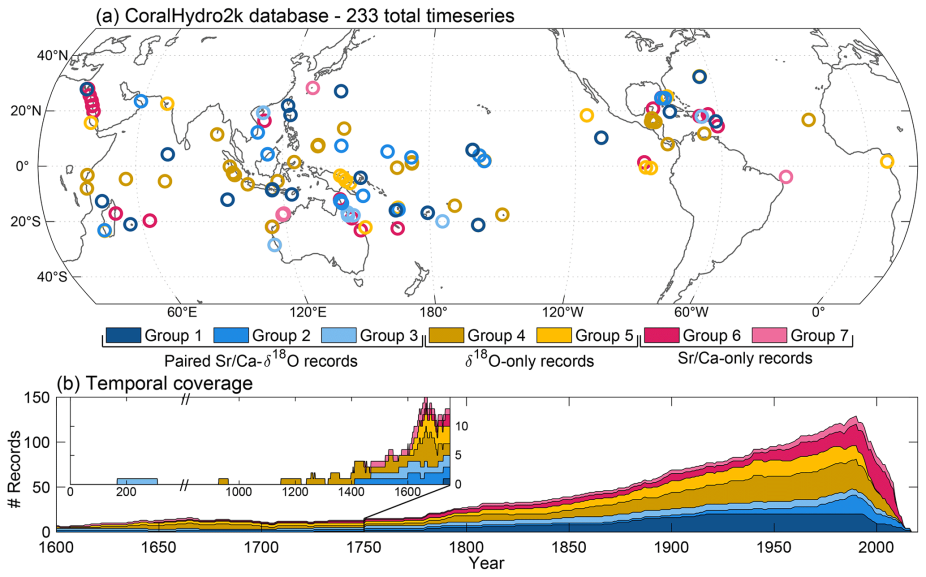
Figure 3. The CoralHydro2k database (Walter et al., 2023). (a) Spatial distribution and (b) temporal coverage. Colors indicate groupings based on proxy information (see Walter et al., 2023 for additional details about the groupings). (credit: Walter et al., 2023)
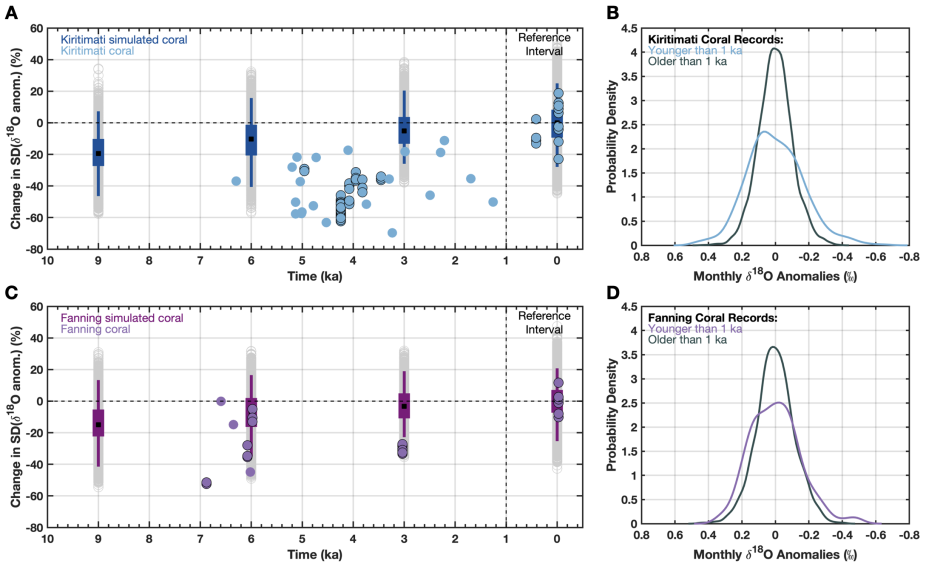
Figure 4. Example climate model-coral data comparison from Lawman et al., (2022). Simulated coral δ18O anomalies compared to published Holocene fossil coral δ18O anomalies from Kiritimati and Fanning Atolls (Line Islands) in the central equatorial Pacific. Simulated coral δ18O anomalies (colored box plots and gray circles) generated using a process-based PSM (Lawman et al., 2020) and Holocene paleoclimate model output from CESM1. (A, C) Data points indicate the percent change in ENSO variability relative to the median value for 0 ka (simulated coral output) and 1 to 0 ka for the coral data. Colored boxes show the 25th and 75th percentiles, and colored vertical lines indicate the 2.5th to 97.5th percentile range. Gray circles indicate the full range of simulated coral estimates. Colored circles indicate published coral proxy records (Cobb et al., 2013; McGregor et al., 2013; Grothe et al., 2019) for each site, with full 30-year intervals outlined in black. (B and D) PDFs of monthly coral δ18O anomalies for (C) Kiritimati and (D) Fanning. (credit: Allison Lawman)
Other Information
- Beck, J. W., R. L. Edwards, E. Ito, F. W. Taylor, J. Recy, F. Rougerie, P. Joannot, and C. Henin, 1992: Sea-Surface Temperature from Coral Skeletal Strontium/Calcium Ratios. Science, 257, 644–647, https://doi.org/10.1126/science.257.5070.644.
- Cheng, H., and Coauthors, 2013: Improvements in 230Th dating, 230Th and 234U half-life values, and U–Th isotopic measurements by multi-collector inductively coupled plasma mass spectrometry. Earth and Planetary Science Letters, 371–372, 82–91, https://doi
- Cobb, K. M., N. Westphal, H. R. Sayani, J. T. Watson, E. Di Lorenzo, H. Cheng, R. L. Edwards, and C. D. Charles, 2013: Highly Variable El Niño–Southern Oscillation Throughout the Holocene. Science, 339, 67–70, https://doi.org/10.1126/science.1228246.
- Corrège, T., 2006: Sea surface temperature and salinity reconstruction from coral geochemical tracers. Palaeogeography, Palaeoclimatology, Palaeoecology, 232, 408–428, https://doi.org/10.1016/j.palaeo.2005.10.014.
- Dee, S., J. Emile-Geay, M. N. Evans, A. Allam, E. J. Steig, and D. M. Thompson, 2015: PRYSM: An open-source framework for PRoxY System Modeling, with applications to oxygen-isotope systems. J. Adv. Model. Earth Syst., 7, 1220–1247, https://doi.org/10.1002
- DeLong, K. L., T. M. Quinn, F. W. Taylor, C.-C. Shen, and K. Lin, 2013: Improving coral-base paleoclimate reconstructions by replicating 350years of coral Sr/Ca variations. Palaeogeography, Palaeoclimatology, Palaeoecology, 373, 6–24, https://doi.org/10.1
- Emile-Geay, J., and Coauthors, 2015: Links between tropical Pacific seasonal, interannual and orbital variability during the Holocene. Nature Geosci, 9, 168–173, https://doi.org/10.1038/ngeo2608.
- EPSTEIN, S., R. BUCHSBAUM, H. A. LOWENSTAM, and H. C. UREY, 1953: REVISED CARBONATE-WATER ISOTOPIC TEMPERATURE SCALE. Geol Soc America Bull, 64, 1315, https://doi.org/10.1130/0016-7606(1953)642.0.co;2.
- Evans, M. N., A. Kaplan, and M. A. Cane, 2000: Intercomparison of coral oxygen isotope data and historical sea surface temperature (SST): Potential for coral-based SST field reconstructions. Paleoceanography, 15, 551–563, https://doi.org/10.1029/2000pa000
- Evans, M. N., S. E. Tolwinski-Ward, D. M. Thompson, and K. J. Anchukaitis, 2013: Applications of proxy system modeling in high resolution paleoclimatology. Quaternary Science Reviews, 76, 16–28, https://doi.org/10.1016/j.quascirev.2013.05.024.
- Fairbanks, R. G., M. N. Evans, J. L. Rubenstone, R. A. Mortlock, K. Broad, M. D. Moore, and C. D. Charles, 1997: Evaluating climate indices and their geochemical proxies measured in corals. Coral Reefs, 16, S93–S100, https://doi.org/10.1007/s003380050245.
- Grothe, P. R., and Coauthors, 2020: Enhanced El Niño–Southern Oscillation Variability in Recent Decades. Geophys. Res. Lett., 47, https://doi.org/10.1029/2019gl083906.
- Konecky, B. L., and Coauthors, 2020: The Iso2k database: a global compilation of paleo-&lt;i&gt;δ&lt;/i&gt;&lt;sup&gt;18&lt;/sup&gt;O and &lt;i&gt;δ&lt;/i&gt;&lt;sup&gt;2&lt;/sup&gt;H records
- Lawman, A. E., J. W. Partin, S. G. Dee, C. A. Casadio, P. Di Nezio, and T. M. Quinn, 2020: Developing a Coral Proxy System Model to Compare Coral and Climate Model Estimates of Changes in Paleo‐ENSO Variability. Paleoceanography and Paleoclimatology, 35,
- Lawman, A. E., P. N. Di Nezio, J. W. Partin, S. G. Dee, K. Thirumalai, and T. M. Quinn, 2022: Unraveling forced responses of extreme El Niño variability over the Holocene. Sci. Adv., 8, https://doi.org/10.1126/sciadv.abm4313.
- LeGrande, A. N., and G. A. Schmidt, 2006: Global gridded data set of the oxygen isotopic composition in seawater. Geophys. Res. Lett., 33, https://doi.org/10.1029/2006gl026011.
- Lough, J. M., 2010: Climate records from corals. WIREs Clim Change, 1, 318–331, https://doi.org/10.1002/wcc.39.
- Shen, C.-C., and Coauthors, 2012: High-precision and high-resolution carbonate 230Th dating by MC-ICP-MS with SEM protocols. Geochimica et Cosmochimica Acta, 99, 71–86, https://doi.org/10.1016/j.gca.2012.09.018.
- Thompson, D. M., T. R. Ault, M. N. Evans, J. E. Cole, and J. Emile-Geay, 2011: Comparison of observed and simulated tropical climate trends using a forward model of coralδ18O. Geophys. Res. Lett., 38, n/a-n/a, https://doi.org/10.1029/2011gl048224.
- Thompson, D. M., 2021: Environmental records from coral skeletons: A decade of novel insights and innovation. WIREs Climate Change, 13, https://doi.org/10.1002/wcc.745.
- Tierney, J. E., and Coauthors, 2015: Tropical sea surface temperatures for the past four centuries reconstructed from coral archives. Paleoceanography, 30, 226–252, https://doi.org/10.1002/2014pa002717.
- Walter, R. M., and Coauthors, 2023: The CoralHydro2k database: a global, actively curated compilation of coral δ18O and Sr ∕ Ca proxy records of tropical ocean hydrology and temperature for the Common Era. Earth Syst. Sci. Data, 15, 2081–2116, https://doi
- Weber, J. N., and P. M. J. Woodhead, 1972: Temperature dependence of oxygen-18 concentration in reef coral carbonates. J. Geophys. Res., 77, 463–473, https://doi.org/10.1029/jc077i003p00463.