Asymmetry and Diversity in the pattern, amplitude and duration of El Niño and La Niña
El Niño and La Niña, the two phases of ENSO, are sometimes described as opposites. However, there are asymmetries in their spatial structure, amplitude, duration and seasonal evolution. This leads to differing teleconnections and global impacts, as well as implications for ENSO predictability. The 'Expert Guidance' section of this post summarizes the metrics used to characterize ENSO asymmetry and discusses the underlying physical mechanisms.
Key Strengths
Key Limitations
Expert User Guidance
The following was contributed by Dr. Agus Santoso, University of New South Wales, September, 2019:
The El Niño Southern Oscillation (ENSO) is Earth’s strongest year-to-year climate variability with pronounced global impact. There are to date several research articles, review papers and books covering the various aspects of ENSO, such as dynamics, teleconnection, impact, prediction, and future projections. ENSO asymmetry and diversity have important implications on these societally relevant aspects. This article provides a very brief overview of ENSO asymmetry and diversity, how we can diagnose them in nature, and how well they are represented in climate models.
ENSO originates in the equatorial Pacific Ocean and vacillates irregularly every 2-7 years, switching between its positive phase (El Niño) and negative phase (La Niña). El Niño and La Niña events are characterised by anomalous surface layer warming and cooling, respectively, over central to eastern equatorial Pacific Ocean that tend to peak toward the end of calendar year. ENSO events develop through a suite of processes that take part in a positive air-sea feedback loop referred to as the Bjerknes feedback (Bjerknes 1969): e.g., surface warming induces anomalous westerly winds that deepen the thermocline (region of steepest vertical temperature gradient) thus reinforcing the initial surface warming, and the cycle continues. The switch to an opposite phase generally involves propagation of oceanic waves that lead to a discharge or recharge of the upper equatorial Pacific heat content (also known as the ‘warm water volume’) priming the system for La Niña or El Niño respectively (Jin 1997; Meinen & McPhaden 2000), with wind bursts often acting as a trigger (e.g., Chiodi & Harrison 2015; Fedorov et al. 2015).
Such anomalous warming and cooling occurring in the climatologically cool and dry region of the eastern Pacific (often referred to as the ‘cold tongue’ region) directly affect the Walker Circulation. The Walker Circulation constitutes a low-level flow of air from the cold-tongue region towards the western Pacific warm pool (a vast area of warm water above 28°C surrounding the maritime continent) where air rises and upon reaching the upper troposphere it flows eastward and subsides over the cold tongue region. The Walker Circulation weakens during El Niño and strengthens during La Niña. During an El Niño, western and eastern Pacific receive less and more rainfall, respectively. The converse occurs during a La Niña. The impact of ENSO is also transmitted outside the tropical Pacific through atmospheric and oceanic waves, influencing climate variability sourced in other oceanic basins that can in turn affect ENSO (e.g., Cai et al. 2019).
It is often generalized that La Niña is an opposite to El Niño. While this holds true to a certain extent, El Niño and La Niña are not simply a mirror image of each other. There is an apparent asymmetry in:
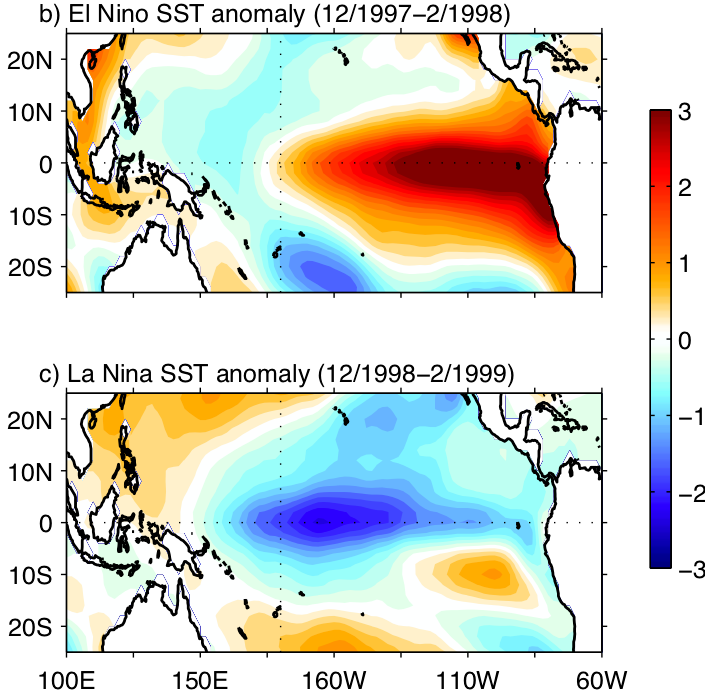
1) pattern: strong El Niño events tend to peak over eastern Pacific, while strong La Niña events tend to peak over central Pacific;
2) amplitude: El Niño can attain a notably larger magnitude than La Niña;
3) duration: El Niño events tend to be of shorter duration than La Niña events.
The generalised ENSO sea surface temperature anomaly (SSTA) pattern is shown in Fig. 1a through regressing SSTA onto the Niño3.4 index (see contribution by Kevin Trenberth on Niño indices; https://climatedataguide.ucar.edu/climate-data/Niño-sst-indices-Niño-12-3-34-4-oni-and-tni). The apparent asymmetry in SSTA pattern between the 1997-98 El Niño (Fig. 1b) and 1998-99 La Niña (Fig. 1c) demonstrates the laxity of this generalization. The 1997-98 El Niño was dubbed “the climate event of the 20th Century”. It was followed immediately by an extreme La Niña which lasted from 1998 to 2000. This chain of events, i.e., a switch from an extreme El Niño to a back-to-back extreme La Niña, is a poster example of ENSO duration asymmetry (see Okumura & Deser 2010 on this topic). The key processes associated with 1997-2000 extreme ENSO events are captured in this animation: https://www.youtube.com/watch?v=gaFjlZxM7S4&feature=youtu.be.
Figure 2 shows SSTA in the equatorial Pacific from a different angle based on the NOAA ERSSTv5 reanalysis (Huang et al. 2017) from 1950-2018 as in Fig. 1. The longitudinal profile during the peak ENSO season shows a cloud of SSTAs that is skewed eastward by the large positive SSTAs peaking in the Niño3 region. These SSTAs belong to the 1997-98 and 1982-83 El Niño events, the strongest El Niños in instrumental record, with the 1997-98 event being the most extreme. The most recent extreme El Niño in 2015-16 peaks slightly to the west (more in the Niño3.4 region). On the other hand, strong La Niña events (1973-74, 1975-76, 1988-1989, 1998-2000) peak about the central Pacific (Niño4 region). Taking these strong ENSO events out of the picture, particularly the extreme El Niño ones, would make the longitudinal distribution of ENSO SSTAs more symmetrical. Also apparent is that extreme El Niños attain notably stronger magnitude than extreme La Niñas.
It is thus clear that ENSO asymmetry is shaped by the strong events, especially extreme El Niños. The asymmetry in pattern and amplitude renders positive and negative skewness of SSTA in the Niño3 and Niño4 regions respectively, while in the Niño3.4 region the SSTA tends to be normally distributed (Burgers & Stephenson 1999).
The dominance of extreme events in ENSO asymmetry also skews the distribution of various metrics based on ocean and atmospheric variables in the tropical Pacific, such as surface wind velocities, rainfall, upper ocean heat content, direction of SSTA propagation, ocean currents, among others (see Santoso et al. 2017 for a review). These metrics can be used to define ENSO extremes and/or detect their potential emergence (e.g., see Fig. 24 of Santoso et al. 2017). For example, a regularly updated daily time series of surface zonal wind velocity (e.g., NCEP/NCAR Reanalysis; Kalnay et al. 1996; accessible from www.esrl.noaa.gov/psd/) averaged over the central Pacific (5°S-5°N, 155°E-150°W) can be used to identify elevated activity of westerly wind bursts in boreal summer that would indicate potential emergence of an extreme El Niño at the end of the year. On the other hand, the warm water volume or equivalently ocean temperature averaged above 300 m across the equatorial Pacific (5°S-5°N, 120°E-155°W; e.g., www.pmel.noaa.gov/tao/wwv/data/) in boreal spring indicates potential emergence of an extreme La Niña.
The variety of longitudinal distribution of the SSTA across the equatorial Pacific in Fig. 2 depicts that no ENSO events are exactly alike, thus the notion of ‘ENSO event diversity’. In fact, diversity and asymmetry are two closely related dynamical aspects of ENSO. The tendency for a strong El Niño to peak in the Eastern Pacific (EP), and a strong La Niña (and moderate El Niño) in the Central Pacific (CP) manifests from two dynamical EP and CP regimes that provide a continuum for events to occur with different ‘flavor’ (e.g., Capotondi et al. 2015; Takahashi & Dewitte 2016; Timmermann et al. 2018). Stochastic forcing, such as the westerly wind bursts, also contributes to ENSO diversity. For instance, the presence of westerly wind bursts can lead to either a CP or EP El Niño depending if the initial heat content of the equatorial Pacific is normal or high, respectively (Fedorov et al. 2015).
Examining ENSO diversity can be done using EOF analysis of tropical Pacific SSTs (e.g., Takahashi et al. 2011; Dommenget et al. 2013), averaged over the peak ENSO season (e.g., December-February average). The leading EOF depicts a typical ENSO SSTA pattern, while the second EOF depicts an opposing polarity between the central and eastern Pacific. Superimposing EOF2 onto EOF1 results in a shift of the ENSO pattern. Depending on the sign and intensity of the EOFs, the core SSTA shifts toward the east or central Pacific. The combination of the EOF principal component time series: E-index=(PC1+PC2)/sqrt(2); C-index=(PC1-PC2)/sqrt(2), represent the temporal evolution of EP and CP ENSO, respectively, which allows classifying ENSO events into EP or CP, or a mix of the two. For example, the 1982-83 and 1997-98 events are considered as EP El Niño, while the 2015-16 event as a mix (see Fig. 1 of Santoso et al. 2019). Should calculating EOFs prove to be cumbersome, PC1 and PC2 can be replaced with the Niño3 index and the Trans Niño Index (TNI), respectively, to yield a similar result (Santoso et al. 2017). The TNI (Trenberth and Stephaniak 2001) is the difference between Niño1+2 and Niño4 (each with the mean removed and normalized). There are also many invariants of EP and CP ENSO indices used in the literature as outlined by Capotondi et al. (2015). The EOF approach is recommended when analysing climate model output given the core location of the ENSO SST anomalies in climate models may not correspond well with the observed counterpart (Cai et al. 2018). EOF analysis can also be used to examine ENSO diversity by applying it on longitude-time snapshots of several El Niño event samples (e.g., Lee et al. 2014).
The observed quadratic relationship between PC1 and PC2 depicts the tendency for strong El Niño to peak in the eastern Pacific, and strong La Niña to peak in the central Pacific. The strength of curvature corresponds with the level of ENSO diversity. If the curvature is weak, then the ENSO SSTA would tend to be more static, peaking in the Niño3.4 region. Thus, the parameter α in the following quadratic equation fitted to the data scatter on PC1-PC2 phase space is a measure of ENSO diversity: PC2=α*PC12+β*PC1+γ (Dommenget et al. 2013; Karamperidou et al. 2017; Cai et al. 2018).
Atmosphere-ocean processes governing ENSO extremes that contribute to ENSO asymmetry and diversity are nonlinear (e.g., Kang & Kug 2002; An & Jin 2004; Choi et al. 2013; Dommenget et al. 2013; Cai et al. 2015; Takahashi & Dewitte 2016; Timmermann et al. 2018; Cai et al. 2018). The climatological eastward sloping ocean thermocline, westward blowing trade winds, the warm pool in the west and the cold-tongue in the east, all of which are linked and sustain one another, provide the environment for nonlinear air-sea interactions to occur. For instance, stronger reduction in atmospheric convection due to La Niña surface cooling occurs toward the warm pool (Hoerling et al. 1997). This is because the cold tongue region is already dry, and thus further surface cooling exerts little effect, but stronger effect takes place in the central Pacific where there is more heat and humidity. In contrast, shifts in atmospheric convection from the climatological convective zones (Intertropical Convergence Zone, the warm pool, South Pacific Convergence Zone) toward the cold tongue region need to be triggered by strong positive SSTA occurring in the region. The outcropping climatological thermocline in the eastern equatorial Pacific allows vigorous air-sea interactions that favors generation of strong surface warming involving thermocline deepening. Thus, another feature of ENSO asymmetry is the highly positive skewness in rainfall over the eastern equatorial Pacific associated with extreme El Niño. As such, the Niño3 rainfall time series can be used to identify extreme El Niño events in observations and models (e.g., Cai et al. 2014 using December-February average Niño3 rainfall > 5 mm/day). Synoptic scale processes also contribute to ENSO asymmetry. For instance, tropical instability waves that exert a damping on ENSO SST anomalies are more active during La Niña than El Niño (An 2008).
Climate models can simulate a diverse range of ENSO events to various extent, with some more realistic than others (e.g., Kim & Yu 2012; Taschetto et al. 2014). However, they overall underestimate the degree of the observed ENSO asymmetry and diversity (e.g., Ham & Kug 2012; Dommenget et al. 2013; Zhang & Sun 2014; Sun et al. 2016; Karamperidou et al. 2017; Cai et al. 2018). This is evident in the weaker skewness of the Niño indices compared to the observed counterpart (Fig. 4). The curvature of the PC1-PC2 relationship described above also tends to be underestimated, as reflected in the overall weaker than observed α parameter (Fig. 5). The underestimation of ENSO asymmetry and diversity is linked to systematic biases associated with model deficiency in capturing crucial physical processes such as atmospheric convection, cloud formation, and other subgrid-scale processes. For instance, the persistent cold tongue bias (cooler than observed eastern-central equatorial Pacific) tend to confine atmospheric convection in the warm pool areas, making it more difficult to shift convection toward the eastern equatorial Pacific (Ham & Kug 2012; Sun et al. 2016), a crucial process of extreme El Niños. In association, many models also underestimate the positive skewness of Niño3 rainfall (Cai et al. 2014). The farther west location and the narrower meridional structure of the modeled ENSO wind anomalies than observed contribute to overly regular ENSO oscillation (Capotondi et al. 2006), thus a weaker duration asymmetry (Choi et al. 2013). In addition, the coarse resolution of the ocean and atmospheric sub-model components also makes it challenging to resolve small-scale processes that contribute in shaping ENSO asymmetry and diversity, such as the tropical instability waves and Madden Julian Oscillation which contributes to westerly wind bursts (e.g., Graham 2014; Feng & Lian 2018). ##
Cite this page
Key Figures

Figure 1: ENSO sea surface temperature (SST) anomaly patterns. a) Generalized pattern obtained by regressing SST at each grid point onto the Niño3.4 index (normalized unit). b) SST anomalies at the peak of 1997-98 extreme El Niño (in °C). c) SST anomalies at the peak of 1998-99 extreme La Niña. The analysis is based on Extended Reconstructed SST version 5 (ERSSTv5) data averaged over boreal winter (December-February), with linear trend removed. Data are provided by the NOAA/OAR/ESRL PSD, Boulder, Colorado, USA, from their Web site at http://www.esrl.noaa.gov/psd/. The regions of Niño indices are shown in a).(contributed by A Santoso)
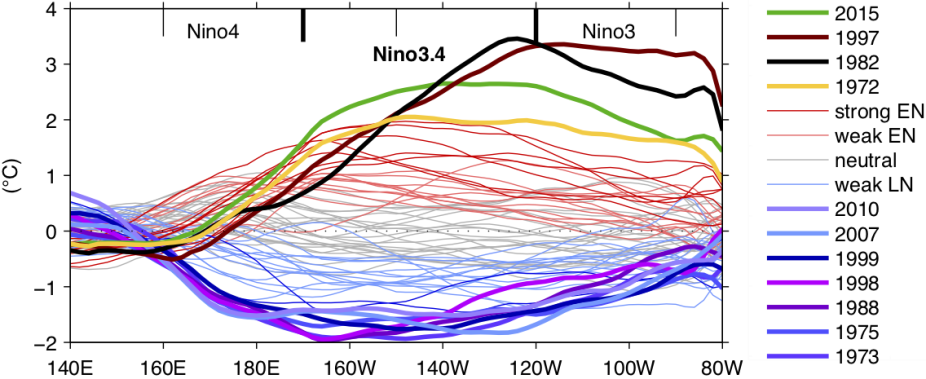
Figure 2: SST anomalies along the equator averaged over December to the following February. The analysis is based on the ERSSTv5 reanalysis (see Fig. 1) with linear trend removed. (contributed by A Santoso)

Figure 3: Leading ENSO SST patterns obtained through empirical orthogonal function (EOF) analysis of December-February average SST over 15°S-15°N, 140°E-80°W. a) 1st EOF pattern expressed as SST regression onto the corresponding principal component (PC) time series. b) As in a) but for the 2nd EOF. c) The relationship between PC1 and PC2. The black curve overlaid in c) is obtained by fitting a quadratic function (PC2=α*PC12+β*PC1+γ) onto the PC1-PC2 scatters. See Fig. 1 for data source. (contributed by A Santoso)
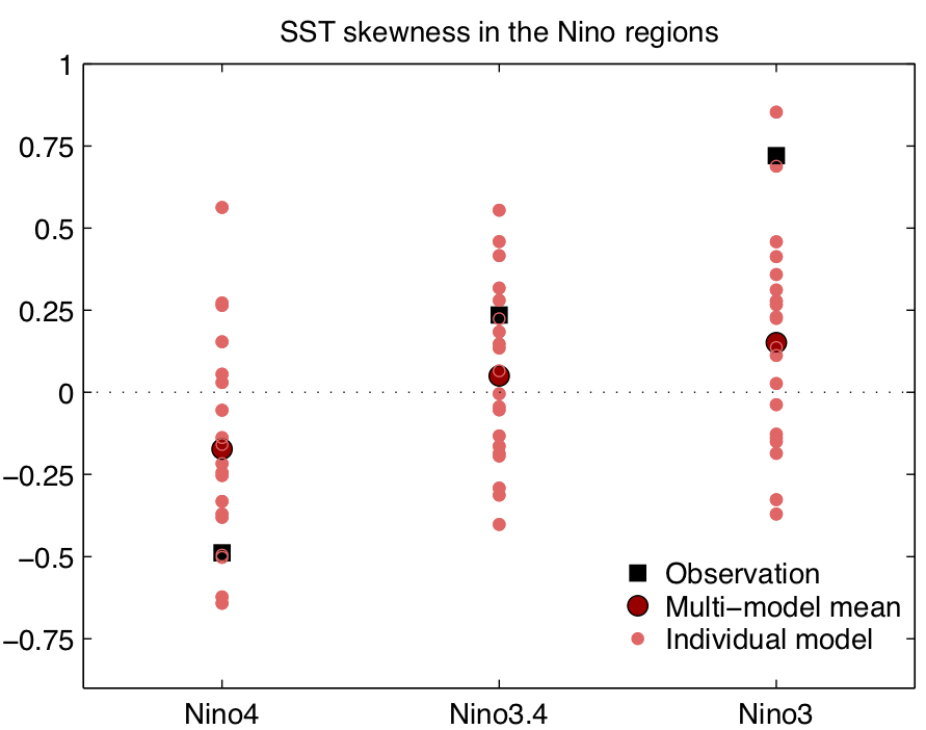
Figure 4: Skewness for the Niño4, Niño3.4, and Niño3 indices for ERSSTv5 (black filled square) and 20 models (pink circles) participating in the Coupled Model Intercomparison Project phase 5 (CMIP5; https://esgf-node.llnl.gov/projects/esgf-llnl/) over the period of 1950 to 1999. The multi-model mean skewness is displayed in dark red filled circles. Analysis is based on monthly data. (contributed by A Santoso)
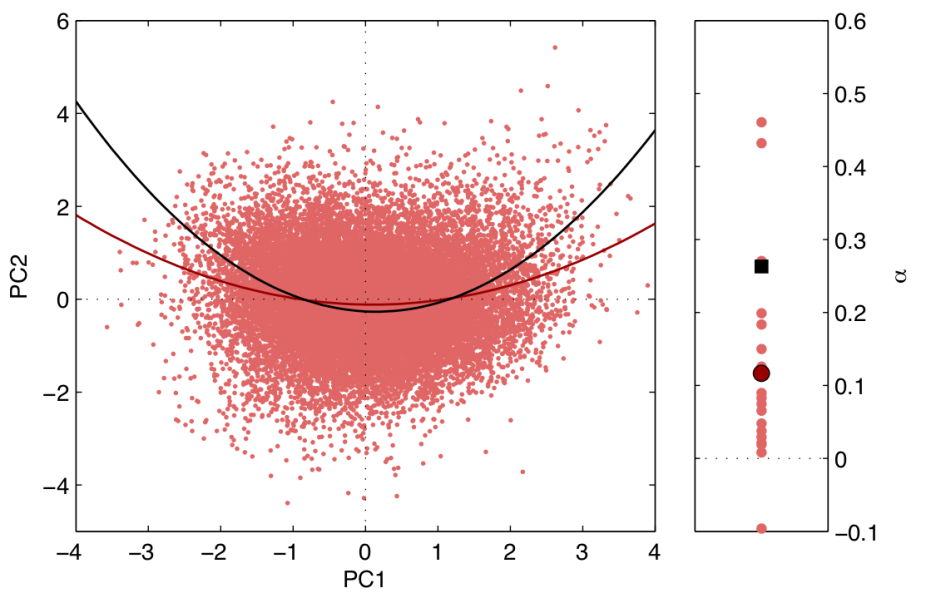
Figure 5: The PC1-PC2 relationship (left panel) and the α parameter (right panel) for 20 CMIP5 models and ERSSTv5 reanalysis. The α parameter measures the curvature strength in the PC1-PC2 nonlinear relationship (see Fig. 3), indicating the level of ENSO diversity. The curvature is notably weaker in the models (pink dots) than in observation (black). Multi-model mean α is displayed in dark red filled circles. Analysis is based on EOF analysis of quadratically detrended monthly data over 1950-1999. (contributed by A Santoso)