Climate data guide content with tag ENSO
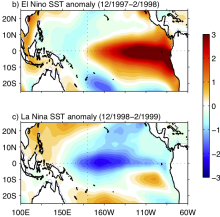 Asymmetry and Diversity in the pattern, amplitude and duration of El Niño and La Niña
Years of record
- N/A
El Niño and La Niña, the two phases of ENSO, are sometimes described as opposites. However, there are asymmetries in their spatial structure, amplitude, duration and seasonal evolution. This leads to differing teleconnections and global impacts, as well as implications for ENSO predictability. The 'Expert Guidance' section of this post summarizes the metrics used to…
-
Formats
- N/A
-
Timestep
- N/A
-
Domain
- Tropics
-
Collections
- N/A
Experts contributing reviews
- Santoso, Agus
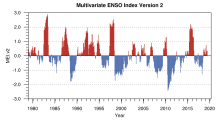 Multivariate ENSO Index
Years of record
- to
The Multivariate ENSO Index (MEI) is said to capture a more holistic representation of the atmospheric and oceanic anomalies that occur during ENSO events than do single-variables timeseries like the NinoSST indices. The MEIv2 is based on five variables from the tropical Pacific. These five variables are: sea-level pressure (P), zonal (U) and meridional (V) components…
Main variables and Earth System components
N/A-
Formats
- ascii
-
Timestep
- Monthly
-
Domain
- Pacific Ocean
-
Collections
- Climate Analysis Section (CAS) Data Catalog
Experts contributing reviews
- N/A
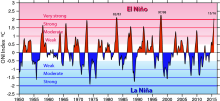 Nino SST Indices (Nino 1+2, 3, 3.4, 4; ONI and TNI)
Years of record
- to
There are several indices used to monitor the tropical Pacific, all of which are based on sea surface temperature (SST) anomalies averaged across a given region. Usually the anomalies are computed relative to a base period of 30 years. The Niño 3.4 index and the Oceanic Niño Index (ONI) are the most commonly used indices to define El Niño and La…
-
Formats
- ascii
-
Timestep
- Monthly
-
Domain
- Pacific Ocean, Tropics
-
Collections
- Climate Analysis Section (CAS) Data Catalog
Experts contributing reviews
- Trenberth, Kevin
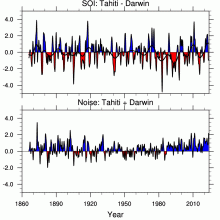 Southern Oscillation Indices: Signal, Noise and Tahiti/Darwin SLP (SOI)
Years of record
- to
The Southern Oscillation Index (SOI) is a time series used to characterize the large scale sea level pressure (SLP) patterns in the tropical Pacific. Monthly mean SLP at Tahiti [T] and Darwin [D] are used. An optimal SOI can be constructed. It consists of [T-D] which is a measure of the large scale phenomena while [T+D] is a measure of small scale and/or…
-
Timestep
- Monthly
-
Domain
- Australia, Pacific Ocean, Tropics
-
Collections
- Climate Analysis Section (CAS) Data Catalog
Experts contributing reviews
- Trenberth, Kevin
 U.S. Climate Extremes Index (CEI)
Years of record
- to
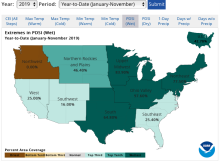
The U.S. Climate Extremes Index (CEI) was first presented in 1995 as a framework for quantifying observed changes in climate within the contiguous United States. At present, the CEI evaluates the percent area of extremes in the distribution of much above/below average (top/bottom 10% of occurrence) temperatures, precipitation, drought, and tropical cyclone wind…
Main variables and Earth System components
Atmosphere Air Temperature Maximum Air Temperature Minimum Air Temperature Precipitation Wind Land Drought-
Formats
- ascii
-
Timestep
- Monthly, Seasonal, Annual
-
Domain
- North America
-
Collections
- N/A
Experts contributing reviews
- Gleason, Karin