Canadian Forest Fire Weather Index (FWI)

Fire weather indices are used to quantify the meteorological conditions that can lead to fire ignition and spread. They are used to communicate fire danger levels to emergency and fire fighting management, as well as the public on short time scales, and also for understanding long-term changes in fire regimes or wildfire risk. Several fire weather indices exist, each developed and calibrated using observations from a specific region, but many have been shown to be well-suited for understanding of global wildfire risk. In this guide, the Canadian Forest Fire Weather Index (FWI) is outlined, and links to the FWI and related variables/indices calculated using ERA5 reanalysis are provided. The Canadian Forest Fire Weather Index (FWI) is one of the most widely used indices for understanding the role of climate variability and change on fire weather, and for detection and attribution of the anthropogenic influence on wildfire risk.
Key Strengths
A relatively straightforward way, from four variables, to quantify the meteorological conditions that can lead to fire ignition and spread
One of the most widely used indices for understanding the role of climate variability and change on fire weather; applicable to observational datasets and models
Useful for detection and attribution of the anthropogenic influence on wildfire risk.
Key Limitations
The FWI only relies on meteorological variables and therefore only captures the risk of wildfire from an atmospheric perspective.
It does not include three important factors of wildfire risk and spread including: (1) vegetation/fuel availability, (2) ignition (natural or human-caused), and (3) fire suppression and management.
Because of the exclusion of these factors in the FWI, not all extreme fire weather days will result in a wildfire. Note that, when a wildfire does occur in the observed world, possible feedbacks from wildfire dynamics (e.g., heat from wildfires causing convective activity) will be observed, and could affect subsequent wildfire risk. However, this will not be reflected if using simulations from an Earth system model that does not explicitly simulate wildfire ignition and spread.
Expert User Guidance
The following was contributed by Danielle Touma, August, 2023:
Summary:
Fire weather indices are used to quantify the meteorological conditions that can lead to fire ignition and spread. They are used to communicate fire danger levels to emergency and fire fighting management, as well as the public on short time scales, and also for understanding long-term changes in fire regimes or wildfire risk. Several fire weather indices exist, each developed and calibrated using observations from a specific region, but many have been shown to be well-suited for understanding of global wildfire risk. In this guide, the Canadian Forest Fire Weather Index (FWI) is outlined, and links to the FWI and related variables/indices calculated using ERA5 reanalysis are provided. It is one of the most widely used indices for understanding the role of climate variability and change on fire weather, and for detection and attribution of the anthropogenic influence on wildfire risk.
FWI Framework:
The schematic (Figure 1) shows the raw and derived variables used to calculate the FWI in the datasets. The equations used for each calculation are clearly detailed in Dowdy et al. (2009), and the respective dataset reference papers, so we do not show them here. We note that each dataset may have used slightly modified variables and equations, and that you should be aware of these differences when using each dataset or comparing among datasets. The original formulation of the FWI, which was developed using experimental field data, uses noon-time temperature, precipitation, wind speed and relative humidity (Van Wagner, 1987). However, CMIP-class model datasets usually only have daily statistics available, and therefore, in these cases daily maximum temperature, total precipitation, minimum or mean relative humidity, and mean wind speed total precipitation is used instead (see Gallo et al. (2023), Touma et al. (2021, 2022, 2023), and Abatzoglou et al. (2019)) . For the sake of simplicity, this description of the FWI uses “temperature”, “precipitation”, “relative humidity”, and “wind speed” to refer to the relevant version of the variables.
The FWI is calculated in three main tiers. In the first tier, three moisture codes are calculated. The Fine Fuel Moisture Code (FFMC) is calculated using temperature, precipitation, wind speed, and relative humidity. The FFMC represents moisture levels on daily time scales and in litter that is 2cm or less deep. The Duff Moisture Code (DMC) is calculated using temperature, precipitation, and relative humidity. The DMC represents moisture levels on ~2 week time scales and in litter and soil 5-10 cm deep. The Drought Code (DC) is calculated using temperature and precipitation. The DC represents moisture levels on ~2 month scales and in litter and soil 10-20 cm deep. All three moisture codes are unitless.
In the second tier, the Build-up Index (BUI) and Initial Spread Index (ISI) are calculated using the derived codes in the first tier. The BUI is calculated using the DMC and DC and represents the total fuel available for combustion through long-term drying. The ISI is calculated using the FFMC and wind speed to represent the rate of fire spread. In the third tier, the FWI is calculated using the BUI and ISI, and represents fire danger given the meteorological conditions, and the fire intensity, if a fire were to be ignited.
Extreme Fire Weather:
The FWI usually ranges between 0 and 180, though it has no upper limit. It is unitless, with higher numbers representing higher fire danger. What is considered high or extreme fire danger can be defined absolutely, or relative to location- and period-specific climatology. Studies that span multiple locations and time periods usually define extreme or high fire danger FWI values using percentile values (e.g., 95th or 99th percentiles) for each location for a specific period of interest for a given time period. This allows a straightforward way to examine the role of long-term trends in climate on extreme fire weather, without the need to evaluate each location’s fire danger history individually. Additionally, this allows systemic biases in a model to have a smaller or negligible influence on projections of wildfire risk. However, for more localized studies that have long records of weather and wildfire observations, it is recommended to understand the absolute levels of FWI that were associated with historic fires of different severities and sizes to establish FWI thresholds for fire danger.
Other considerations:
The FWI only relies on meteorological variables and therefore only captures the risk of wildfire from an atmospheric perspective. It does not include three important factors of wildfire risk and spread including: (1) vegetation/fuel availability, (2) ignition (natural or human-caused), and (3) fire suppression and management. While these factors can be included to have a more holistic understanding of wildfire risk, few observational wildfire datasets include relevant information on ignition and suppression, and observations of vegetation and fuel availability can be sparse in space and time.
Because of the exclusion of these factors in the FWI, not all extreme fire weather days will result in a wildfire. Note that, when a wildfire does occur in the observed world, possible feedbacks from wildfire dynamics (e.g., heat from wildfires causing convective activity) will be observed, and could affect subsequent wildfire risk. However, this will not be reflected if using simulations from an Earth system model that does not explicitly simulate wildfire ignition and spread.
Moreover, wildfires are extremely localized events - for reference, the August Complex (2020), which is the largest observed California fire to date, burned ~4,000 km2. Therefore, when there is an extreme fire weather day in a CMIP model grid box (~10,000 km2 scale), the grid box in question is at an elevated wildfire risk. Therefore if there is an ignition in that grid box, there is a higher chance that a wildfire will spread within that grid box, but the area that will burn within that grid box will be dependent on subgrid scale vegetation/fuel, suppression/management, and land and atmospheric dynamics. ##
Cite this page
Acknowledgement of any material taken from or knowledge gained from this page is appreciated:
Touma, Danielle & National Center for Atmospheric Research Staff (Eds). Last modified "The Climate Data Guide: Canadian Forest Fire Weather Index (FWI).” Retrieved from https://climatedataguide.ucar.edu/climate-data/canadian-forest-fire-weather-index-fwi on 2026-06-23.
Citation of datasets is separate and should be done according to the data providers' instructions. If known to us, data citation instructions are given in the Data Access section, above.
Acknowledgement of the Climate Data Guide project is also appreciated:
Schneider, D. P., C. Deser, J. Fasullo, and K. E. Trenberth, 2013: Climate Data Guide Spurs Discovery and Understanding. Eos Trans. AGU, 94, 121–122, https://doi.org/10.1002/2013eo130001
Key Figures
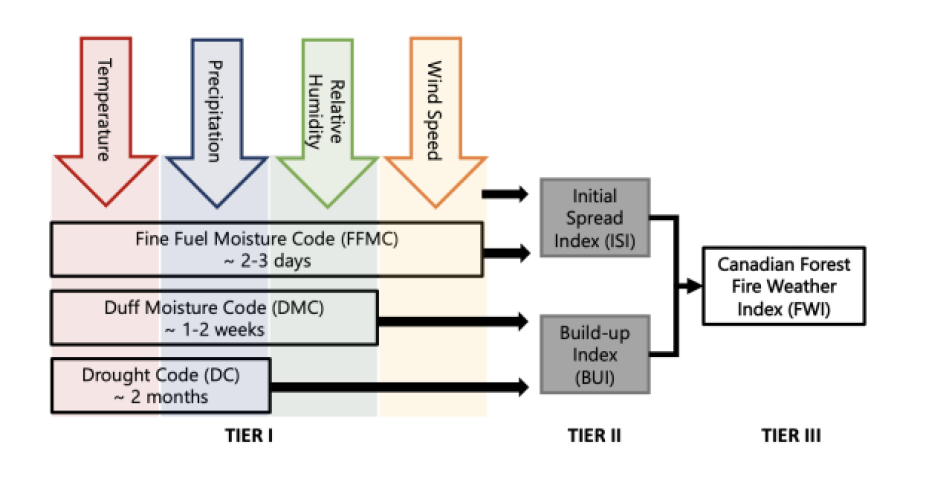
Figure 1: FWI calculation schematic (modified from Touma et al. (2023))
(contributed by Danielle Touma)
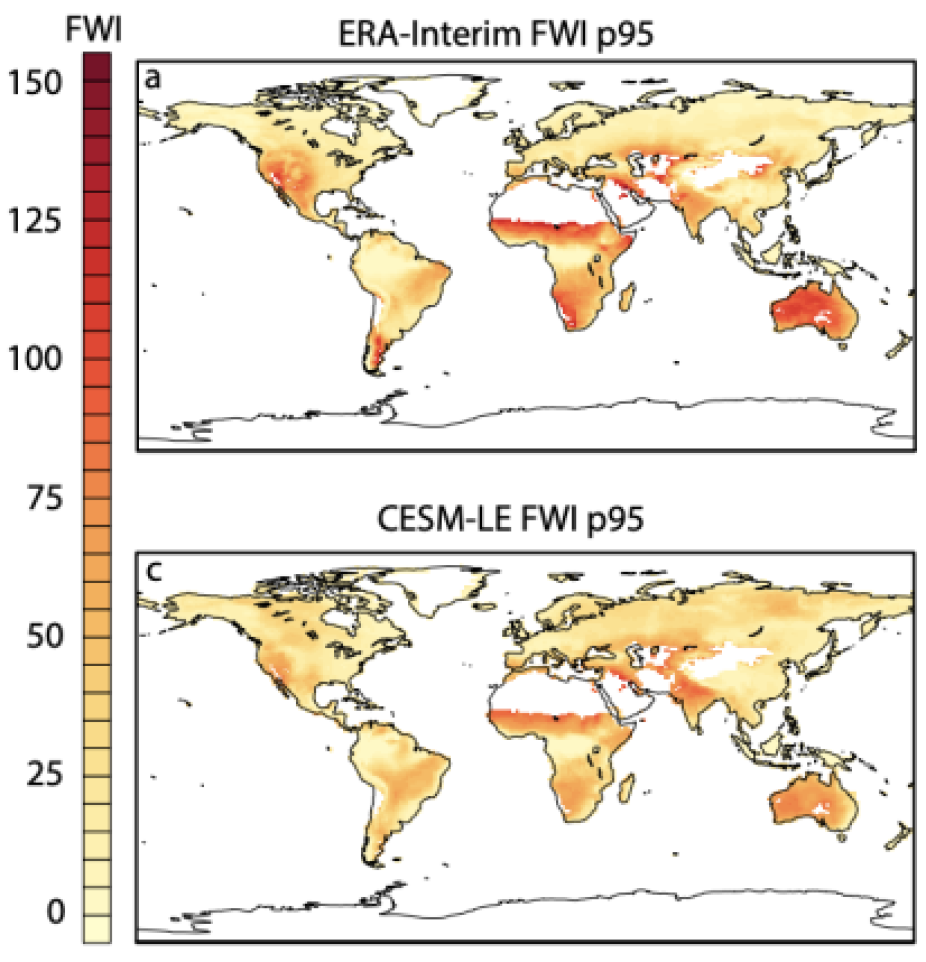
Figure 2: 95th percentile FWI values for 1980-2018 for ERA-Interim and CESM-LE (Modified from Touma et al. (2021))(contributed by Danielle Touma)
Other Information
- Abatzoglou, J. T., A. P. Williams, and R. Barbero, 2019: Global Emergence of Anthropogenic Climate Change in Fire Weather Indices. Geophys. Res. Lett., 46, 326–336, https://doi.org/10.1029/2018gl080959.
- Dowdy, AndrewJ. (Andrew James), 1975- and Mills, G. A. (Graham Alan), 1946- and Finkele, K and De Groot, William and Centre for Australian Weather and Climate Research and Australia. Bureau of Meteorology and CSIRO. Australian fire weather as represented
- Gallo, C., J. M. Eden, B. Dieppois, I. Drobyshev, P. Z. Fulé, J. San-Miguel-Ayanz, and M. Blackett, 2023: Evaluation of CMIP6 model performances in simulating fire weather spatiotemporal variability on global and regional scales. Geosci. Model Dev., 16, 3
- Touma, D., S. Stevenson, F. Lehner, and S. Coats, 2021: Human-driven greenhouse gas and aerosol emissions cause distinct regional impacts on extreme fire weather. Nat Commun, 12, https://doi.org/10.1038/s41467-020-20570-w.
- Touma, D., S. Stevenson, D. L. Swain, D. Singh, D. A. Kalashnikov, and X. Huang, 2022: Climate change increases risk of extreme rainfall following wildfire in the western United States. Sci. Adv., 8, https://doi.org/10.1126/sciadv.abm0320.
- Touma, D., J. W. Hurrell, M. R. Tye, and K. Dagon, 2023: The Impact of Stratospheric Aerosol Injection on Extreme Fire Weather Risk. Earth’s Future, 11, https://doi.org/10.1029/2023ef003626.
- van Wagner, Canadian Forest Service, 1987: Development and structure of the Canadian Forest Fire Weather Index System. 1987. Van Wagner, C.E. Canadian Forestry Service, Headquarters, Ottawa. Forestry Technical Report 35. 35 p.