CHIRPS: Climate Hazards InfraRed Precipitation with Station data (version 2)
Note: CHIRPS v2 has been superseded by CHIRPS v3 as of June 2025.
Climate Hazards Group InfraRed Precipitation with Station data (CHIRPS) is a quasi-global (50S - 50N), land-only rainfall dataset with a range of temporal and spatial resolutions depending on the region and the time period. Data can be found at 0.05 deg or 0.1 deg resolution, and can be found at 6-hourly to seasonal time scales. These resolutions are regionally dependent and span different time periods. The dataset begins in 1981 and extends to the near-present day. The dataset integrates several data sources including station measurements and satellite data. The dataset is preliminarily updated for the whole domain two days after the end of a pentad (2nd, 7th, 12th, 17th, 22nd and 27th) of every month using only some station data, and is then finalized by the 3rd week of the month using the additional datasets. The dataset builds off a previously created climatology dataset that has used satellite information to fill in areas that have a lack of stations. Then, the dataset is created using daily to monthly infrared Cold Cloud Duration (CCD) precipitation estimates as well the spatial correlation structure of CCD, incorporated using a novel blending procedure.
Key Strengths
High spatial and temporal resolution of rainfall estimates
Accounts for regional variations in the relationships between different datasets
Relatively long-term record (1981-present) with nearly immediate updates of the dataset
Key Limitations
Rainfall only; does not include snow or ice
Land-only due to its heavy reliance on station data and not available outside of 50S-50N
Intended for drought and environmental monitoring; less known is its performance as a dataset to study low-frequency climate variability and trends
Expert User Guidance
The following was contributed by Carlos Martinez and Danielle Touma, Janurary 2023:
Noting a gap in types of gridded precipitation datasets (e.g., datasets with long records but coarse resolutions / long latency, or high-resolution datasets with short-records), the CHIRPSv2 dataset was designed to fill this gap by blending station and satellite data to produce a continuous, high-resolution 1981-present precipitation record.
Methodology (please see https://www.nature.com/articles/sdata201566, Fig. 1a, and Methods sections)
CHIRPSv2 process and validation comprises three components. The first is the development of a 0.05 monthly precipitation climatology, known as CHPclim (https://pubs.er.usgs.gov/publication/70155260). Over 27,000 monthly stations from the FAO, and ~21,000 stations from the Global Historical Climate Network (GHCN) were used to construct CHPclim. CHPclim uses information from TRMM 2B31 microwave precipitation estimates, CMOPRH microwave-plus-infrared based precipitation estimates, monthly mean geostationary infrared brightness temperatures and land surface estimates, and were resampled to a 0.05 degree common grid. Finally, a moving window regression is used for each grid cell; the regression models were fit to FAO climate normals, and GHCN station data were used to estimate ratio biases at each station. The 1980-2009 climate normal is then produced.
Next, pentadal CHIRP fields, which are variations on the CHPclim mean, are calculated, using a local calibration of satellite precipitation estimates with thermal infrared (TIR) cold cloud duration (CCD) statistics. 0.25 degree TMPA 3B42 pentadal precipitation estimates and TIR CCD data are used to develop regression slopes and intercepts. These values are resampled to a 0.05 degree grid, to then develop the 1981-present pentadal precipitation estimates. The Pentadal CHIRP values are disaggregated to daily precipitation estimates.
Finally, station data is merged and blended across several public data streams and private archives in order to produce CHIRPS.
Benefits
CHIRPSv2 provides several benefits. First, the spatial and temporal coverage and resolution in CHIRPSv2 provide the ability to study hydroclimate, precipitation extremes, and droughts, especially in historically data sparse regions such as the Caribbean, and Africa. Studies that are over small Islands and other regions with complex topographies may benefit from the 0.05deg resolution. Drought monitoring and global environmental change over land studies may benefit from using this dataset.
Limitations
Currently, CHRIPSv2 does not have coverage outside of (50S-50N), though a global CHIRPS is under development. The dataset is land-only, and can be computationally expensive to download and analyze. Since CHRIPSv2 uses station data, CHIRPSv2 has limitations in station data sparse regions (e.g., rural areas).
Cite this page
Acknowledgement of any material taken from or knowledge gained from this page is appreciated:
Touma, Danielle &, Martinez, Carlos & National Center for Atmospheric Research Staff (Eds). Last modified "The Climate Data Guide: CHIRPS: Climate Hazards InfraRed Precipitation with Station data (version 2).” Retrieved from https://climatedataguide.ucar.edu/climate-data/chirps-climate-hazards-infrared-precipitation-station-data-version-2 on 2026-07-10.
Citation of datasets is separate and should be done according to the data providers' instructions. If known to us, data citation instructions are given in the Data Access section, above.
Acknowledgement of the Climate Data Guide project is also appreciated:
Schneider, D. P., C. Deser, J. Fasullo, and K. E. Trenberth, 2013: Climate Data Guide Spurs Discovery and Understanding. Eos Trans. AGU, 94, 121–122, https://doi.org/10.1002/2013eo130001
Key Figures
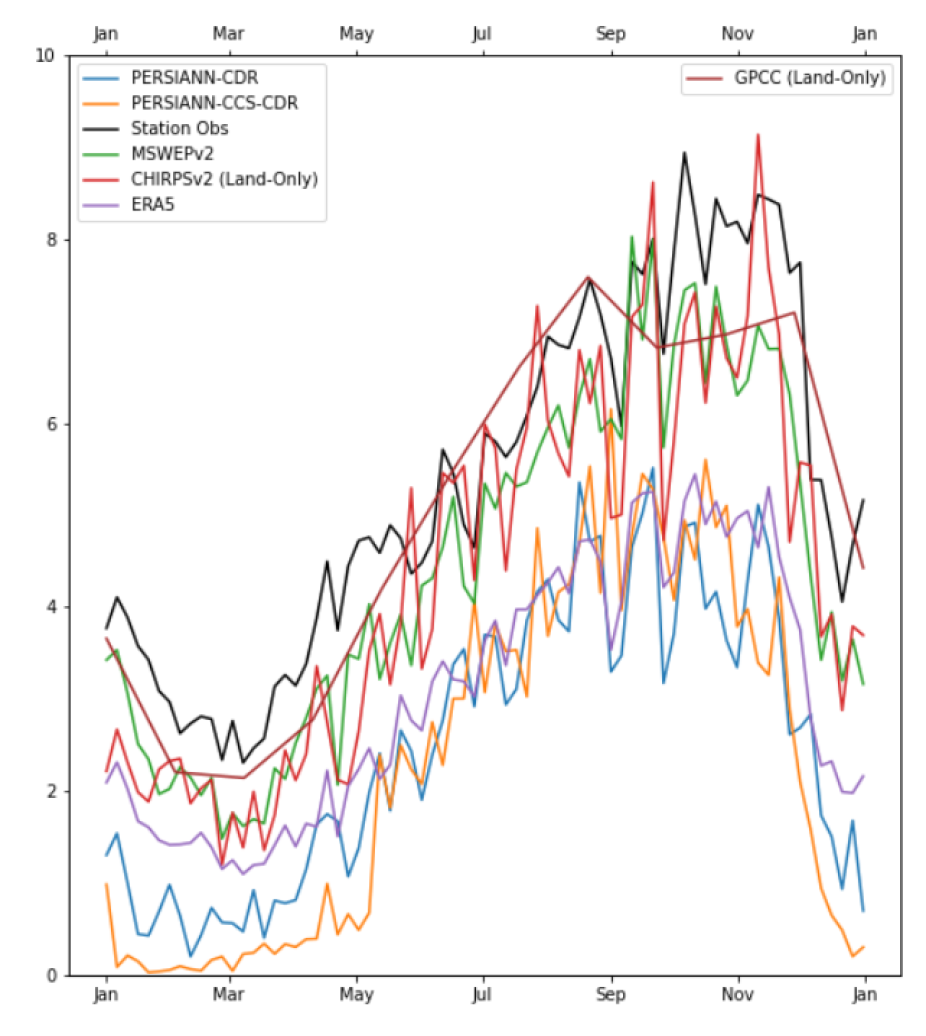
Figure 1. Pentad timeseries of the annual land climatological (1983-2014) hydroclimate in the Eastern Caribbean (Lesser Antilles). The black line denotes the station average from 7 station rain gauges within the Lesser Antilles (see Martinez et al. 2019 for information on station data). Colored lines denote each of the gridded precipitation datasets. The light red line denotes CHIRPSv2. The figure highlights how CHIRPSv2 is able to capture the seasonal structure and magnitude of the Eastern Caribbean hydroclimate. (provided by Carlos Martinez)
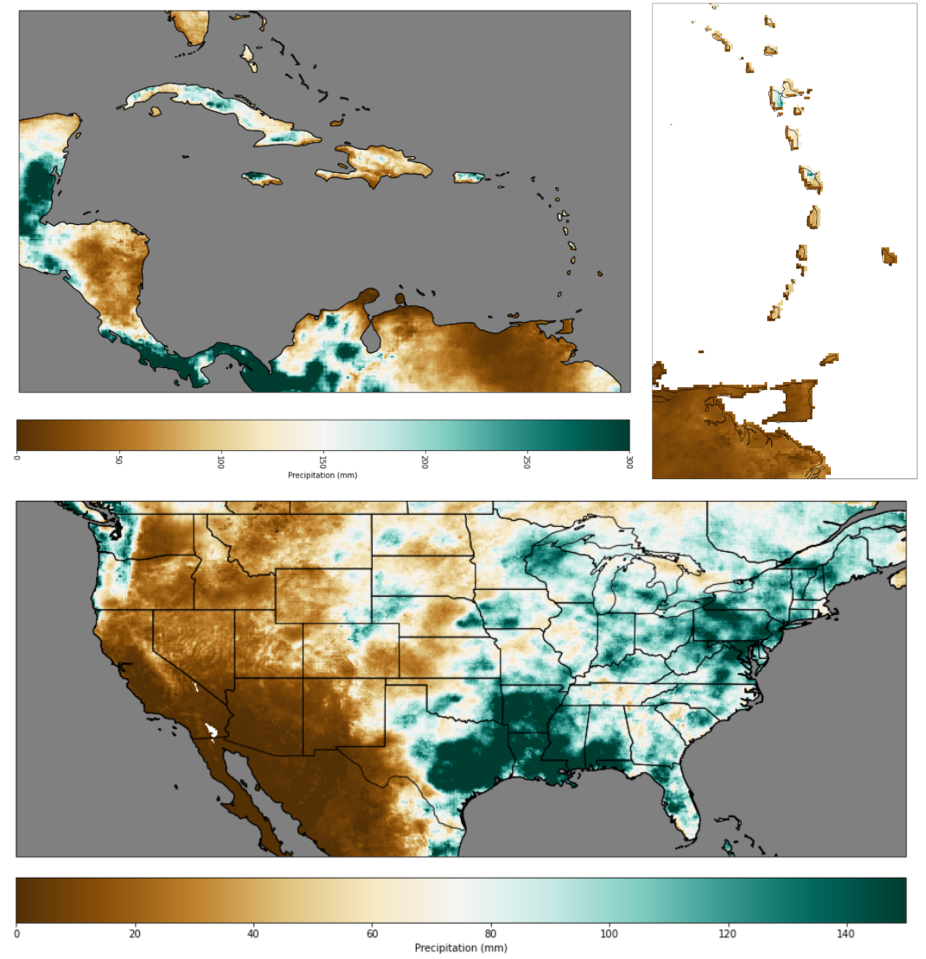
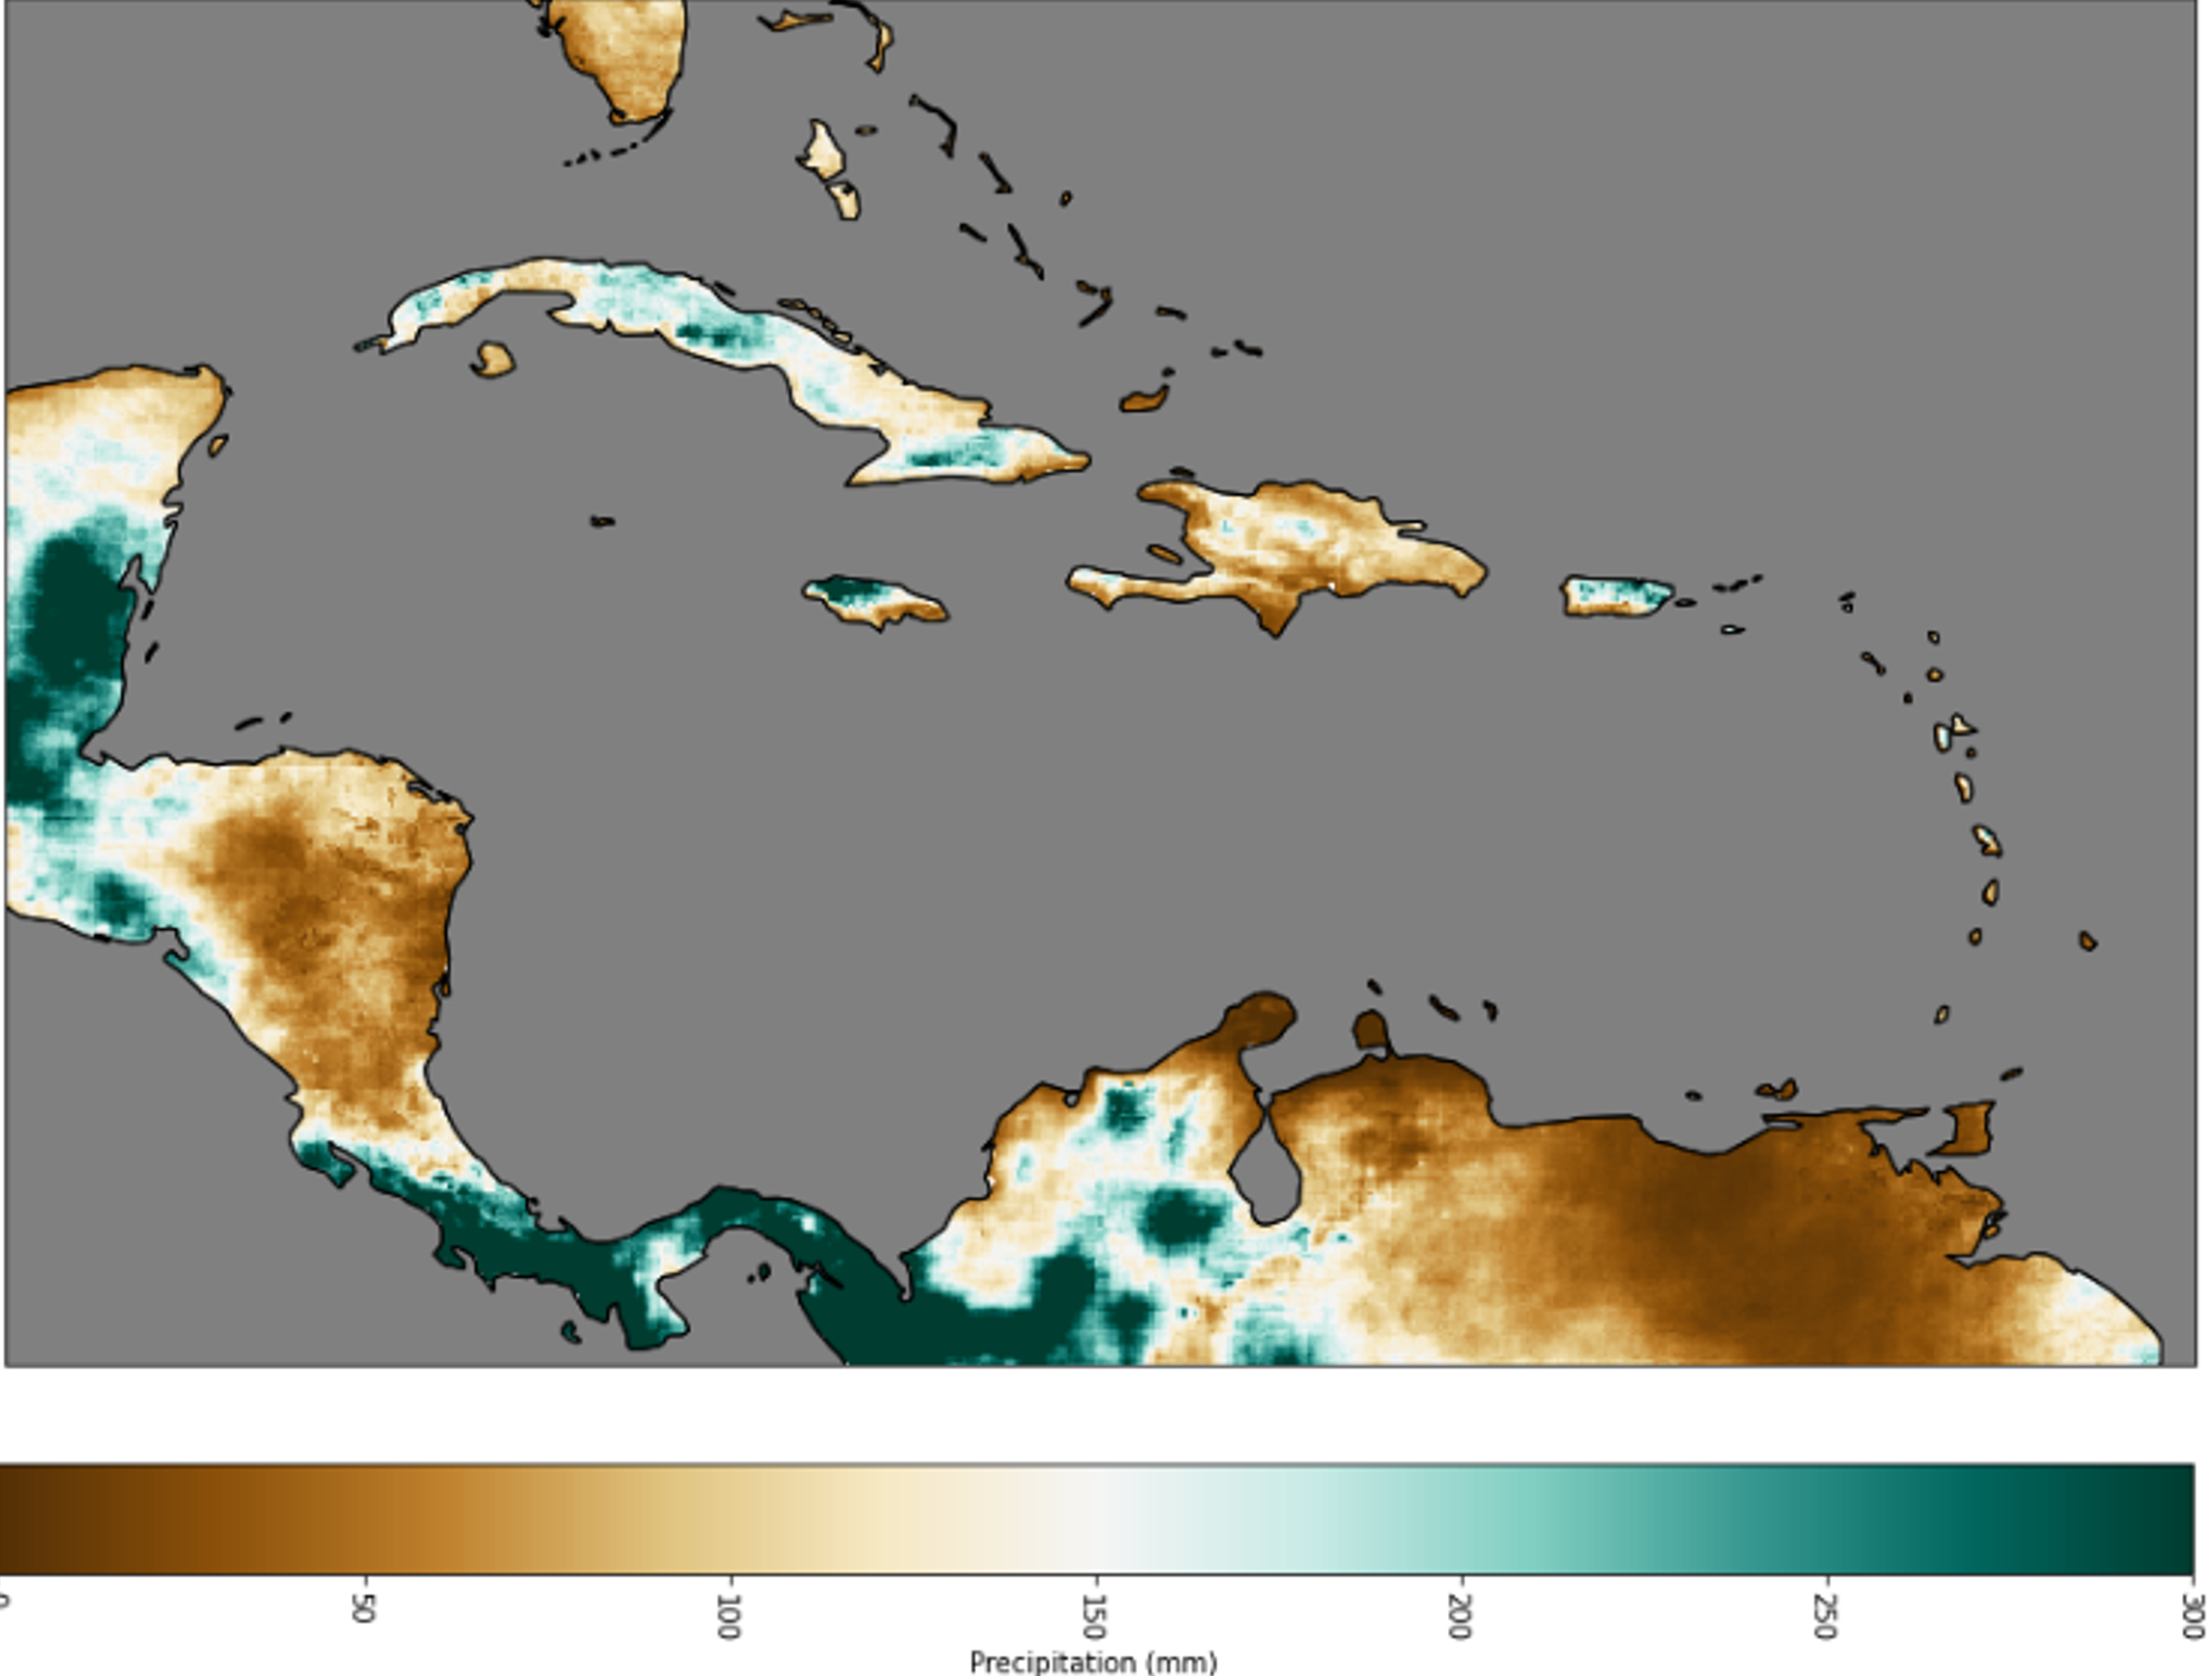
Spatial May Precipitation Totals in 2014 across the Caribbean, the Eastern Caribbean, and CONUS via CHIRPSv2. Contributed by Carlos Martinez.
Other Information
- Funk, C., and Coauthors, 2015: The climate hazards infrared precipitation with stations—a new environmental record for monitoring extremes. Sci Data, 2, https://doi.org/10.1038/sdata.2015.66.
- Martinez, C., L. Goddard, Y. Kushnir, and M. Ting, 2019: Seasonal climatology and dynamical mechanisms of rainfall in the Caribbean. Clim Dyn, 53, 825–846, https://doi.org/10.1007/s00382-019-04616-4.