Palmer Drought Severity Index (PDSI)
The Palmer Drought Severity Index (PDSI) uses readily available temperature and precipitation data to estimate relative dryness. It is a standardized index that generally spans -10 (dry) to +10 (wet). Maps of operational agencies like NOAA typically show a range of -4 to +4, but more extreme values are possible. The PDSI has been reasonably successful at quantifying long-term drought. As it uses temperature data and a physical water balance model, it can capture the basic effect of global warming on drought through changes in potential evapotranspiration. Monthly PDSI values do not capture droughts on time scales less than about 12 months; more pros and cons are discussed in the Expert Guidance.
Key Strengths
Effective in determining long-term drought, especially over low and middle latitudes
By using surface air temperature and a physical water balance model, the PDSI takes into account the basic effect of global warming through potential evapotranspiration
Takes precedent (prior month) conditions into account
Key Limitations
Not as comparable across regions as the Standardized Precipitation Index (SPI), but this can be alleviated by using the self-calibrating PDSI
Lacks multi-timescale features of indices like the SPI, making it difficult to correlate with specific water resources like runoff, snowpack, resevoir storage, etc.
Does not account for snow or ice (delayed runoff); assumes precipitation is immediately available
Expert User Guidance
The following was contributed by Sang Bui (Colorado School of Mines) and Nathan Lenssen (NSF NCAR), October, 2025:
Outline of PDSI Calculation
1) The Two-Layer Water Balance Model: The core of the PDSI calculation is a rudimentary, fixed-capacity two-layer soil moisture model designed to simulate the movement of water between the land surface and the atmosphere. This model imposes a rigid and uniformly applied total Available Water Capacity ($\text{AWC}$) of 152.4 mm, regardless of local soil type or land cover, which is partitioned into a shallow surface layer (25.4 mm) and a deeper subsoil layer (127.0 mm). The simulation tracks how monthly precipitation ($P$) is consecutively allocated to satisfy the demands of Evapotranspiration ($\text{ET}$), then Soil Moisture Recharge ($\text{R}$), and finally, any remaining excess is categorized as Runoff ($\text{RO}$). Conversely, in dry months, the model determines Loss ($\text{L}$), or the amount of soil moisture depleted to meet the atmospheric demand of potential evapotranspiration ($\text{PE}$). This simple accounting of water movement is fundamental to determining the actual hydrological status against which climatically appropriate conditions are judged, but the uniform $\text{AWC}$ represents one of the most structurally rigid and frequently critiqued assumptions of the original 1965 index.
2) Establishing Climatic Normals: The Greek Coefficients ($\alpha, \beta, \gamma, \delta$): The distinguishing feature of the Palmer Drought Severity Index (PDSI) lies in its ability to generate a locally specific definition of "normal" climate, a necessary requirement for determining the Climatically Appropriate For Existing Conditions ($\text{CAFEC}$) precipitation (${\hat P}$). This is achieved through the calculation of four fixed, dimensionless ratios known as the Greek coefficients ($\alpha, \beta, \gamma, \delta$). These coefficients are not computed monthly. Rather, they are calculated once for each location and month by taking the average of all water balance components over the entire long-term record. This process creates a static representation of local water-use efficiency. Each coefficient specifically represents the long-term monthly ratio of an actual water-balance component to its potential counterpart: $\alpha$ quantifies the climatological Evapotranspiration Efficiency ($\bar{ET}/\bar{PE}$), $\beta$ measures the climatological Recharge Efficiency ($\bar{R}/\bar{PR}$), $\gamma$ is the climatological Runoff Efficiency ($\bar{RO}/\bar{PRO}$), and $\delta$ is the climatological Loss Efficiency ($\bar{L}/\bar{PL}$). By integrating these efficiencies into the $\text{CAFEC}$ formula, the PDSI is internally calibrated to reflect the unique average hydrologic behavior, such as how much water typically runs off versus how much recharges the soil, at that exact location over the period of record.
3)Calculating the Moisture Departure: The concept of the Moisture Departure ($d$) is the primary point in the PDSI methodology, transforming the water balance simulation into a standardized climate index. At this stage, the calculation shifts from defining long-term norms to evaluating the anomaly of the current month. The $d$ value is the difference between the Actual Precipitation ($P$) received during the month and the Climatically Appropriate For Existing Conditions ($\text{CAFEC}$) precipitation ($\hat{P}$) . The $\hat{P}$ value is generated by applying the fixed, dimensionless Greek coefficients (the local proportionality factors for water partitioning) to the current month’s potential water balance demands ($\text{PE}, \text{PR}, \text{PRO}, \text{PL}$).This core relationship is expressed by the formula:$$\hat{P} = (\alpha \times \text{PE}) + (\beta \times \text{PR}) + (\gamma \times \text{PRO}) - (\delta \times \text{PL})$$ The resulting departure ($d = P - \hat{P}$) quantifies, in millimeters, the volume of water surplus or deficit that occurred relative to the water budget expected for that specific location and month. A positive $d$ indicates a wetter-than-expected condition, while a negative $d$ indicates a drought condition, forming the fundamental, un-normalized input for the final PDSI value.
4) The Final Index: Z-Index and PDSI: The PDSI calculation culminates in two final steps that transform the raw moisture surplus or deficit ($d$) into the standardized, time-dependent index. First, the Moisture Departure ($d$) is converted into the Z-Index ($Z$). This conversion is essential for normalization, as it allows for the comparison of water anomalies across different climatic regions. The $Z$-Index is computed by multiplying the departure ($d$) by the local climatic weighting factor ($\text{K}_{\text{month}}$). This $\text{K}$-factor is a complex normalization term derived from the PDSI's internal water balance calculations, ensuring that the same physical water deficit registers an appropriate and standardized climatic significance regardless of the location. Second, the $Z$-Index is integrated into the final PDSI value, which incorporates climatic memory, the index's unique ability to account for previous months' conditions. This is represented by the incipient index ($X$): $$X_{i} = 0.897 \times X_{i-1} + Z_i/3$$ The final reported PDSI is determined by a sophisticated, self-correcting spell tracking algorithm. This algorithm uses the incipient index to formally define the onset and termination of drought (negative) and wet (positive) periods. The PDSI index is thus a measure of the cumulative deviation from the local climatic normal, with $0$ representing normal conditions, and values typically ranging from $-4.0$ (extreme drought) to $+4.0$ (extremely wet). This spell tracking mechanism ensures the index maintains a sense of historical context, reflecting whether the current month is part of a longer, established wet or dry spell.
What is PDSI Good For?
1) Foundation in the Physical Water Balance: The primary advantage of the Palmer Drought Severity Index (PDSI), most notably in contrast to solely statistical indices, is that it is founded on a physical soil water balance model. Developed by Palmer (1965), the methodology simulates water flow into and out of an conceptualized two-layered soil. By comparing precipitation ($P$) with computed Potential Evapotranspiration ($\text{PE}$), PDSI determines actual hydrological disposition of water into Recharge ($\text{R}$), Runoff ($\text{RO}$), and Loss ($\text{L}$). This physical grounding ensures that the PDSI does not merely indicate a rainfall deficit but computes the actual soil moisture anomaly, the water deficit that affects the land surface. This makes the index useful to meteorological, agricultural, and hydrological users, particularly in low and mid-latitudes where temperature-driven processes dominate.
2) Standardization and Inter-Regional Comparison: One of the most significant advantages of the PDSI is that it produces a standardized index that allows for objective comparison of the severity of drought or wetness across vastly different climate regimes. Inter-regional comparability is accomplished through a rigorous, two-step climatic calibration process. Firstly, the dimensionless Greek coefficients ($\alpha, \beta, \gamma, \delta$) are determined from the long-term average values of the water balance terms. These coefficients are local proportionality factors such that the reference level of "normal" water demand, the CAFEC precipitation ($\hat{P}$), is by definition appropriate to that specific location's long-term average hydrology. Second, the resulting monthly Moisture Departure ($d$) is normalized by the local climatic weighting factor ($\text{K}_{\text{month}}$) to yield the Z-Index ($Z$). The $\text{K}$-factor rescales the raw water deficit or surplus so that, for instance, a $20 \text{ mm}$ deficit in an ever-arid region logs the same amount of climatic significance as a considerably larger deficit in a humid climate. This entire process ultimately generates the PDSI on a single, universal scale, typically from -4.0 (extreme drought) to +4.0 (extreme wetness).
3) Sensitivity to Temperature and Long-Term Climate Change: The PDSI possesses the important, yet often overlooked, strength in its ability to inherently reflect the basic effects of long-term climate change due to its specific method of calculating atmospheric water demand. It computes Potential Evapotranspiration ($\text{PE}$) based upon the Thornthwaite method, a choice made out of necessity because of the limited data in 1965. This method relies solely on surface air temperature and day length. As such, under a warming climate, rising temperatures mechanically and directly impact the calculated $\text{PE}$ to increase. Such an increase in $\text{PE}$, in turn, causes the Climatically Appropriate For Existing Conditions ($\text{CAFEC}$) precipitation ($\hat{P}$), amount of water required to maintain the local normal, to increase. By continuously increasing the required $\hat{P}$ base during the course of time, the PDSI is inevitably inclined towards registering negative values, which acts as an integrated, long-term measure of the way increasing thermal demand contributes to aridification. This feature makes the PDSI particularly valuable in the study of historical and long-term aridity changes provoked by global warming.
4) Quantifying Cumulative Drought Severity: One of the PDSI's most significant advantages, especially for water resources managers and long-range planning, is that it can quantify cumulative drought severity by retaining climatic memory. Unlike indices that reset monthly, the PDSI makes use of the incipient index ($X$), recursive calculation, to ensure that current moisture conditions of wetness are always maintained in the context of previous months. This is measured by the following equation: $$X_{i} = 0.897 \times X_{i-1} + Z_i/3$$ This memory factor allows the index to effectively track the duration and intensity of established drought or wet spells, the goal of the original approach prescribed by Palmer (1965). The final PDSI value is obtained via a sophisticated, self-correcting spell tracking algorithm. This algorithm uses the $X$ value to formally define the onset and, more critically, the termination of a spell. Because the algorithm resists ending a spell until the required cumulative recovery has occurred, the PDSI index is a measurement of the total, sustained deviation from the local climatic normal, and is thereby particularly suited to describing long-term hydrologic impacts.
When should I be careful with PDSI?
1) The Rigid and Fixed Water Balance Model: A primary structural weakness of the PDSI, as detailed in the methodology presented in Palmer (1965), lies in the fixed and uniform assumptions of its two-layer soil model. The index uses an rigid global total Available Water Capacity ($\text{AWC}$) of 152.4 mm (6 inches). The fixed depth is taken indiscriminately, without regard to the true local soil type, depth, texture, or land cover, more or less ignoring true hydrological variability in nature. The impact, as diagnosed by Alley (1984), is that PDSI values become highly sensitive to this "arbitrarily chosen" $\text{AWC}$ value, especially when comparing between regions. This structural rigidity limits the accuracy of the model, particularly where non-standard soil conditions are involved or where deeper stores of groundwater play a significant role, such that a climatic drought measurement is not reflective of the real hydrologic or agricultural state of the soil.
2) Arbitrary Constants and Limited Standardization: Although the PDSI is intended to possess universal comparability, its standardization procedure relies upon empirical constants that limit its accuracy across diverse climates. As critically noted by Alley (1984), the procedure used in deriving the local climatic weighting factor ($\text{K}_{\text{month}}$), the essential component required for normalizing the moisture departure ($d$), was based on very limited comparisons involving a small number of sites in the Great Plains (e.g., Iowa and Kansas). As a result, fixed scaling factors based on those particular regional climates are used universally across the globe. Furthermore, Alley states that the magnitude values used to differentiate the true severity classes (e.g., the $\pm$ 1.0 and $\pm$ 2.0) and the rules for defining the beginning and end of drought spells are based on rather arbitrary rules. This weak justification, which is neither strongly physical nor statistical, means the PDSI's scale may not consistently translate the same level of environmental impact across all climatic zones, leading to the index being potentially over- or under-sensitive in regions vastly different from the areas used for its original calibration.
3) Sensitivity to Spell Criteria and Memory Lag: The PDSI's core strength, its ability to track the duration of an established drought, is also a source of its most significant weakness: temporal lag and sensitivity to its internal termination criteria. This limitation stems directly from the sophisticated spell tracking algorithm that governs the final index value. As cited by Alley (1984), the method imposes "arbitrary rules" regarding the onset and cessation of a drought or wet period. Critically, PDSI values are "very sensitive to the criteria for ending an 'established' drought." Due to the fact that the index has a strong memory component (the recursive incipient index $X$), a return to normal precipitation may not immediately end the spell. Instead, the algorithm can sustain the drought signal until the accumulated moisture deficit is completely overcome. Alley further observes that the algorithm allows for current precipitation to have a large effect on the PDSI values of "several earlier months," demonstrating the index's internal backtracking mechanism. This high degree of memory and resistance is why the index succeeds with long-term planning but renders the PDSI highly unsuitable for the monitoring of flash drought or wet spells that begin rapidly over the course of several weeks.
4) Flawed Potential Evapotranspiration (PE) Calculation: A major limitation of the original PDSI methodology, which has been widely superseded in modern climatology, is the use of the Thornthwaite method to estimate Potential Evapotranspiration ($\text{PE}$). The Thornthwaite calculation was chosen because it only requires temperature and day length, which were the most readily available data in 1965. This simplicity, however, comes at the cost of physical accuracy. The Thornthwaite method grossly oversimplifies the complex physics of evaporation by completely ignoring critical atmospheric variables such as wind speed, net radiation, and humidity. In contrast, modern indices use energy-balance methods (like Penman-Monteith) that incorporate these factors, yielding a much more precise measure of atmospheric water demand. By using the flawed Thornthwaite $\text{PE}$, the PDSI's internal water balance and consequently its output can misrepresent the actual moisture stress on the land surface, particularly in regions where changes in wind or solar radiation, rather than just temperature, dominate the evaporative process.
Further Reading
(Palmer 1965) The original report on PDSI provides the two-layer water balance model, the fixed constants found from experiments performed in the great plains, the formulas for the coefficients used in the water balance model discussed above, and the definition of the incipient index ($X$) used to model the temporal structure of wet and dry spells.
(Alley 1984) The paper provides a critical review of PDSI, showcasing the weaknesses of the PDSI due to the structural assumptions and arbitrary rules made in the calculation. PDSI performs best when monitoring established, long-term droughts or wet spells. It performs pooly when tracking short-term droughts or wet spells and/or rapidly evolving soil moisture changes.
The following was contributed by Aiguo Dai (SUNY - Albany), September, 2012:
To quantify drought and monitor its development, many drought indices have been developed and applied. Among them, the Palmer Drought Severity Index (PDSI) is the most prominent index of meteorological drought used in the United States for drought monitoring and research, and its variants have been used to quantify long-term changes in aridity over land in the 20th and 21st century. The PDSI has also been widely used in tree-ring based reconstructions of past droughts in North America and other regions .
The PDSI was originally developed by Palmer [1965] with the intent to measure the cumulative departure in surface water balance. It incorporates antecedent and current moisture supply (precipitation, P) and demand (potential evapotranspiration, PE) into a hydrological accounting system, which includes a 2-layer bucket-type model for soil moisture calculations. The PDSI is a standardized measure, ranging from about -10 (dry) to +10 (wet) with values below -3 representing severe to extreme drought. The standardization used by Palmer was based on limited data from the central U.S. and tends to yield more severe PDSI in the Great Plains than other U.S. regions. To improve the spatial comparability, Wells et al. [2004] proposed a self-calibrating PDSI (sc_PDSI) by calibrating the PDSI using local conditions, instead of using the (fixed) coefficients used by Palmer [1965] based on data from the central U.S. The sc_PDSI performed better than the original PDSI during the 20th century over Europe and North America.
Another major complaint about the PDSI is that the PE calculated using the Thornthwaite equation in the original Palmer model could lead to errors in energy-limited regions [Hobbins et al., 2008], as the Thornthwaite PE (PE_th) is based only on temperature, latitude and month. This error can be minimized, however, by using the more sophisticated Penman-Monteith equation [referred to as PE_pm, which accounts for the effects of radiation, humidity and wind speed and works best over Australia in a comparison of various PE formulations. Palmer [1965] chose the PE_th mainly based on practical considerations as data for computing PE_pm and other types of PE may be unavailable. This is especially true for global analyses.
The PDSI is also imprecise in its treatment of all precipitation as immediately available rainfall (i.e., no delayed runoff from melting snow), its lack of impact of vegetation or frozen soils on evaporation, and some other processes. Despite all these caveats, Dai et al. [2004] and Dai [2011a] showed that the PDSI values are significantly correlated with measured soil moisture content in the warm season and streamflow over many regions over the world, and satellite observed land water storage changes, and these correlations are comparable over the U.S. and many other parts of the world. This suggests that the PDSI can be used as a measure of drought over land, especially over the low and middle latitudes. This is largely due to the fact that the normalization in the Palmer model minimizes the errors associated with many of the assumptions made by Palmer [1965] and that actual evaporation is often determined, to a large degree, by the availability of soil moisture (and thus affected by precipitation), not only by PE, over many land areas . Also, using annual values should minimize the seasonal effect of snowfall on the surface water balance.
Recently, the PDSI was criticized for its inability to depict droughts on time scales shorter than 12 months when monthly PDSI values were used . This is not unexpected as the PDSI was designed to be strongly auto-correlated in order to account for the impact of land memory on drought conditions. However, the Palmer model also computes the un-smoothed Z-index which can be used to track short-term agricultural drought, since it responds quickly to changes in soil moisture. For quantifying long-term changes in aridity and droughts, the relatively long intrinsic time scale of monthly PDSI should not be a problem.
On the positive side, the PDSI is based on a physical water-balance model, uses both precipitation and surface air temperature (and other variables when PE_pm is used) as input, and takes the precedent condition into account, in contrast to most other drought indices that are based purely on past statistics of certain climate variable(s), which often includes precipitation alone.
From this perspective, the PDSI and sc_PDSI may be considered superior to other statistically based drought indices. This is because the PDSI and sc_PDSI can account for the basic effect of global warming through Palmer's water balance model on droughts and wet spells. The effect of global warming may have already occurred during the 20th century [Dai et al., 2004; van der Schrier et al., 2006a, 2006b; Dai, 2011a] and may increase substantially in the 21st century [Burke and Brown, 2008; Dai, 2011a]. The effect of surface temperature, which accounts for 10-30% of PDSI's variance during the 20th century, comes mainly through potential evapotranspiration. As precipitation and surface air temperature are the only two climate variables with long historical records, the PDSI makes full use of these data and can be readily calculated for the last hundred years or so for most land areas.The impact of the choice of PE_th or PE_pm is relatively small for the 20th century, the use of PE_th tends to overestimate the impact of the globalwarming for the model-projected 21st century climate. Dai (2011a, JGR) compared the various versions of the PDSI and recommended the use of the sc_PDSI with the PE_pm (i.e., sc_PDSI_pm), especially for model projections. All the references cited here can be found in Dai (2011a, JGR) and in the Key References below.##
Cite this page
Acknowledgement of any material taken from or knowledge gained from this page is appreciated:
Dai, Aiguo &, Bui, Sang &, Lenssen, Nathan & National Center for Atmospheric Research Staff (Eds). Last modified "The Climate Data Guide: Palmer Drought Severity Index (PDSI).” Retrieved from https://climatedataguide.ucar.edu/climate-data/palmer-drought-severity-index-pdsi on 2026-06-23.
Citation of datasets is separate and should be done according to the data providers' instructions. If known to us, data citation instructions are given in the Data Access section, above.
Acknowledgement of the Climate Data Guide project is also appreciated:
Schneider, D. P., C. Deser, J. Fasullo, and K. E. Trenberth, 2013: Climate Data Guide Spurs Discovery and Understanding. Eos Trans. AGU, 94, 121–122, https://doi.org/10.1002/2013eo130001
Key Figures

Long-term PDSI over the continental US through January, 2014. Retrieved on 31 Jan 2014 from http://www.cpc.ncep.noaa.gov/products/analysis_monitoring/regional_moni…

EOF 1 & 2 patterns: PSDI: 1900-2005. (Climate Data Guide; A.Dai, D.Shea)
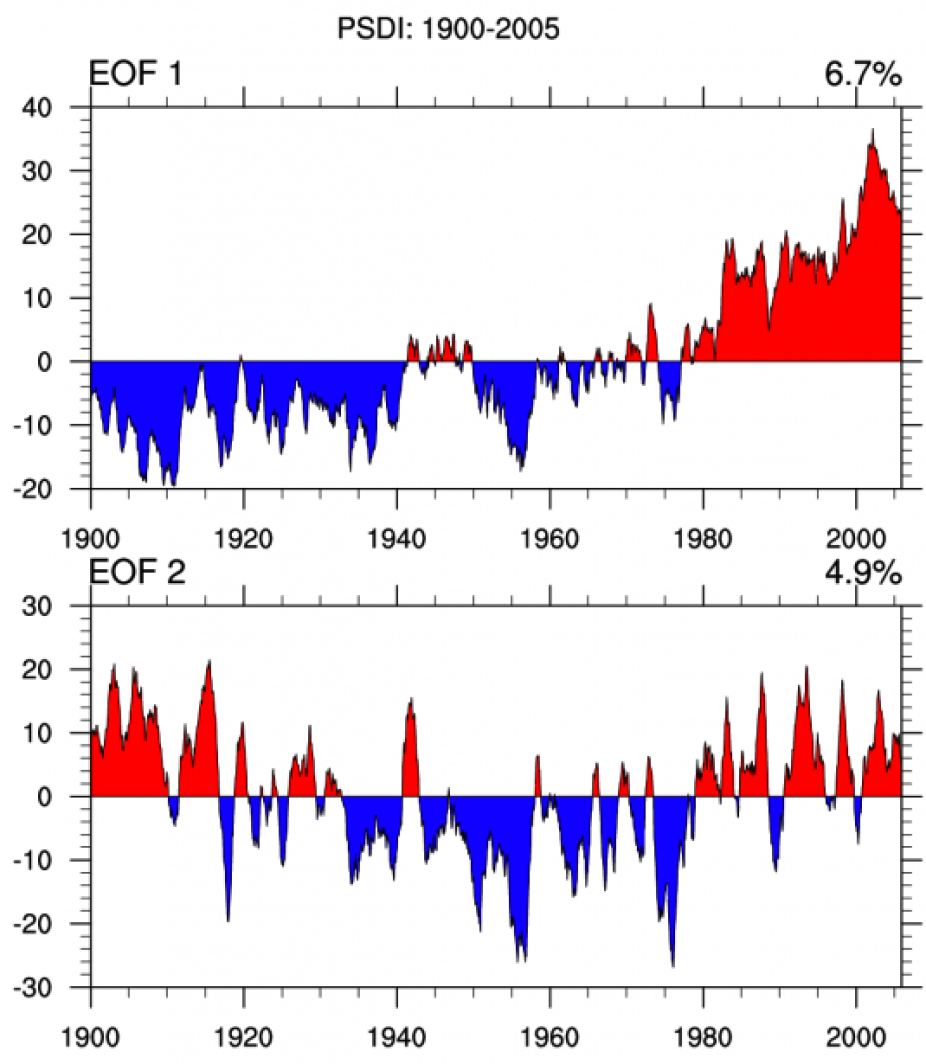
EOF 1 & 2 timeseries: PSDI: 1900-2005. (Climate Data Guide; A.Dai, D.Shea)
Other Information
- Zhao, T., and A. Dai (2015): The magnitude and causes of global drought changes in the 21st century under a low-moderate emissions scenario. J. Climate, , 28, 4490–4512
- Keyantash, John, John A. Dracup, 2002: The Quantification of Drought: An Evaluation of Drought Indices. Bull. Amer. Meteor. Soc., 83, 1167–1180.
- Dai, A., 2011a: Characteristics and trends in various forms of the Palmer Drought Severity Index (PDSI) during 1900-2008. J. Geophys. Res., 116, D12115
- Palmer, W. C, 1965: Meteorological Drought. Res. Paper No.45, 58pp., Dept. of Commerce, Washington, D.C.
- Palmer, W.C., 1968: Keeping track of crop moisture conditions, nationwide: The new crop moisture index. Weatherwise, 21, 156-161.
- Dai, A., 2011b: Drought under global warming: A review. Wiley Interdisciplinary Reviews: Climate Change, 2, 45-65
- Dai, A., K. E. Trenberth, and T. Qian, 2004: A global data set of Palmer Drought Severity Index for 1870-2002: Relationship with soil moisture and effects of surface warming. J. Hydrometeorology, 5, 1117-1130
- Alley, W.M., 1984: The Palmer Drought Severity Index: Limitations and Assumptions. J. Climate Appl. Meteor. 23, 1000-1009
- Wells, Nathan, Steve Goddard, Michael J. Hayes, 2004: A Self-Calibrating Palmer Drought Severity Index. J. Climate, 17, 2335–2351
- Hobbins, M. T., A. Dai, M. L. Roderick, and G. D. Farquhar (2008), Revisiting potential evapotranspiration parameterizations as drivers of long-term water balance trends, Geophys. Res. Lett., 35, L12403, doi:10.1029/2008GL033840
- van der Schrier, G., K. R. Briffa, P. D. Jones, and T. J. Osborn (2006a), Summer moisture variability across Europe, J. Clim., 19, 2818–2834, doi:10.1175/JCLI3734.1
- van der Schrier, G., K. R. Briffa, T. J. Osborn, and E. R. Cook (2006b), Summer moisture availability across North America, J. Geophys. Res., 111, D11102, doi:10.1029/2005JD006745
- Burke, E. J., and S. J. Brown (2008), Evaluating uncertainties in the projection of future drought, J. Hydrometeorol., 9, 292–299, doi:10.1175/2007JHM929.1
- Trenberth, K. E., A. Dai, G. van der Schrier, P. D. Jones, J. Barichivich, K. R. Briffa, and J. Sheffield^, 2014: Global warming and changes in drought. Nature Climate Change, 4, 17-22
- Richard R. Heim Jr., 2002: A Review of Twentieth-Century Drought Indices Used in the United States. Bull. Amer. Meteor. Soc., 83, 1149–1165
- van der Schrier, G., P. D. Jones, and K. R. Briffa (2011), The sensitivity of the PDSI to the Thornthwaite and Penman - Monteith parameterizations for potential evapotranspiration, J. Geophys. Res., 116, D03106
- Jacobi, J., D. Perrone, L.L. Duncan, G. Hornberger (2013): A tool for calculating the Palmer drought indices. Water Resources Res.
- Yu. H., Q. Zhang, C-Y Xu, J. Du, P. Sun, P.Hu (2019): Modified Palmer Drought Severity Index: Model Improvement and Application. Env. Int.