Cloud observations from MODIS
Key Strengths
Key Limitations
original measurements: Platnick, SA, et al., 2003: The MODIS cloud products: Algorithms and examples from Terra. IEEE Trans. Geosci. Rem. Sens., 41, 459-473. doi: 10.1109/TGRS.2002.808301.
gridded products: King MD, et al., 2003: Cloud and aerosol properties, precipitable water, and profiles of temperature and water vapor from MODIS. IEEE Trans. Geosci. Rem. Sens., 41, 442-458, doi:10.1109/TGRS.2002.808226
simulator-friendly versions: Pincus, R, S Platnick, SA Ackerman, RS Hemler, and RJP Hofmann, 2012: Reconciling simulated and observed views of clouds: MODIS, ISCCP, and the limits of instrument simulators. J. Climate, 25, 4699-4720. doi:10.1175/JCLI-D-11-00267.1.
none
Expert User Guidance
The following was contributed by Robert Pincus (University of Colorado), December, 2012:
#In individual pixels MODIS reports cloud thermodynamic phase, cloud-top pressure, optical thickness, effective particle size (see Hansen and Travis, 1974) and, based on the two latter quantities, an estimate of the condensed water path.
MODIS cloud properties are determined in steps. First, the “cloud mask”, with a wide range of situation-dependent tests using measurements in many spectral bands, determines the likelihood that a pixel contains some cloud. Next, cloud-top pressure is estimated, first using a technique based on absorption by carbon dioxide. The so-called CO2 slicing technique fails if the cloud is too low in the atmosphere, in which case MODIS (like ISCCP) uses an estimate based on infrared window emission in a channel centered at about 11 µm. Cloud thermodynamic phase is determined from further spectral tests. Finally, optical thickness and particle size are retrieved simultaneously (Nakajima and King, 1990) by minimizing the differences between observations and forward calculations at two wavelengths (nominally 0.86 or 0.65 µm and 2.1 µm). Liquid or ice water path is estimated from the product of particle size and optical thickness (following Stephens, 1978) but does not represent any additional information.
Like all current global passive remote sensing retrievals, MODIS uses forward models that assume plane-parallel, homogeneous clouds within each pixel. MODIS differs from other datasets (notably ISCCP and MISR) because it attempts to identify and exclude partly-cloud pixels before determining thermodynamic phase, particle size, and optical thickness. In the global, long-term mean “clear-sky restoral” removes about a quarter of all pixels identified by the cloud mask, so that the retrieval cloud fraction (about 50%) is substantially lower than the mask cloud fraction (about 67%, in line with similar estimates). Clouds with low optical thickness (less than ~3) are much less frequent in MODIS observations than in comparable data sets. For more information see Pincus et al. 2012.
MODIS estimates particle size at three independent wavelengths with increasing amounts of absorption by condensed water (1.6 µm, 2.1 µm, and 3.7 µm). Estimates from 2.1 µm are aggregated, but these can be substantially higher than estimates made from measurements at 3.7 µm (doi: Zhang and Platnick, 2011). Estimates from 1.6 µm signals are even higher. This may be due to small-scale variability in cloud properties (Zhang et al., 2012), to the presence of drizzle (Nakajima et al., 2010), or to some combination, but large time-average values of particle size, especially in regions of low cloud fraction, should not be taken literally.
Aggregated MODIS data is available at daily, eight-day, and monthly intervals on a 1-degree equal angle grid. Averages are reported for all clouds and for the subsets of ice and liquid clouds. Linear and logarithmic averages of optical depth are reported (the exponentiated logarithmic average gives roughly the correct mean albedo at cloud-top when coupled with the same surface spectral properties used in the MODIS algorithm). Many joint histograms are provided (optical thickness/cloud top pressure, optical thickness/particle size, etc.)
A MODIS “instrument simulator” is available as part of the COSP package (Bodas-Salcedo et al., 2011, http://cfmip-obs-sim.googlecode.com). Output from this simulator can be directly compared to a subset of the monthly aggregated data described in Pincus et al. 2012.
MODIS cloud fraction estimates from the cloud mask are comparable with ISCCP, MISR, and PATMOS-X, as are optical thickness comparisons that account for clear-sky restoral by MODIS (this can be accomplished in practice by excluding the thinnest clouds from the comparison). Particle size estimates are roughly comparable with PATMOS-X, though this too is complicated by MODIS clear-sky restoral. MODIS estimates of condensed water path are not comparable to microwave estimates except in carefully controlled circumstances (and 2010). ##
Cite this page
Acknowledgement of any material taken from or knowledge gained from this page is appreciated:
Pincus, Robert & National Center for Atmospheric Research Staff (Eds). Last modified "The Climate Data Guide: Cloud observations from MODIS.” Retrieved from https://climatedataguide.ucar.edu/climate-data/cloud-observations-modis on 2026-02-20.
Citation of datasets is separate and should be done according to the data providers' instructions. If known to us, data citation instructions are given in the Data Access section, above.
Acknowledgement of the Climate Data Guide project is also appreciated:
Schneider, D. P., C. Deser, J. Fasullo, and K. E. Trenberth, 2013: Climate Data Guide Spurs Discovery and Understanding. Eos Trans. AGU, 94, 121–122, https://doi.org/10.1002/2013eo130001
Key Figures
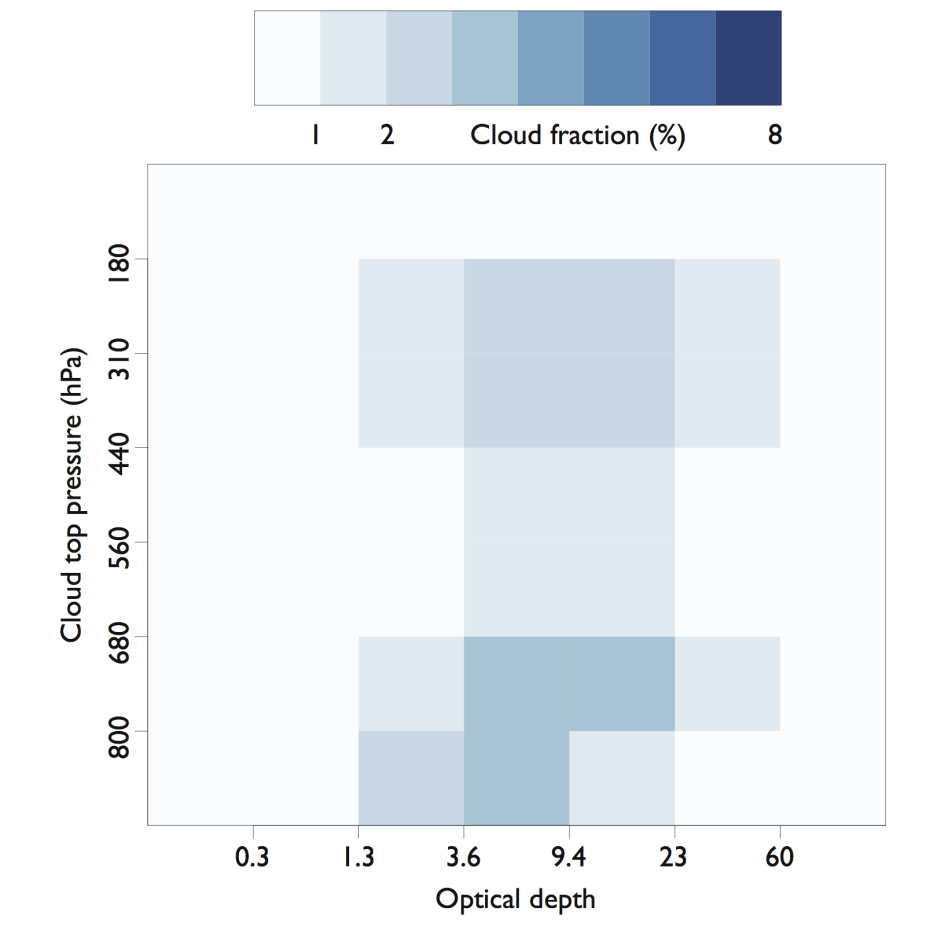
MODIS-Joint-Histogram: Global-mean joint histogram of cloud optical thickness and cloud-top pressure as observed by MODIS (Terra and Aqua combined). MODIS does not perform retrievals on pixels thought to be partly-cloudy and reports substantially less optically-thin cloud than other sensors. From Pincus et al., 2012. Contributed by R. Pincus.
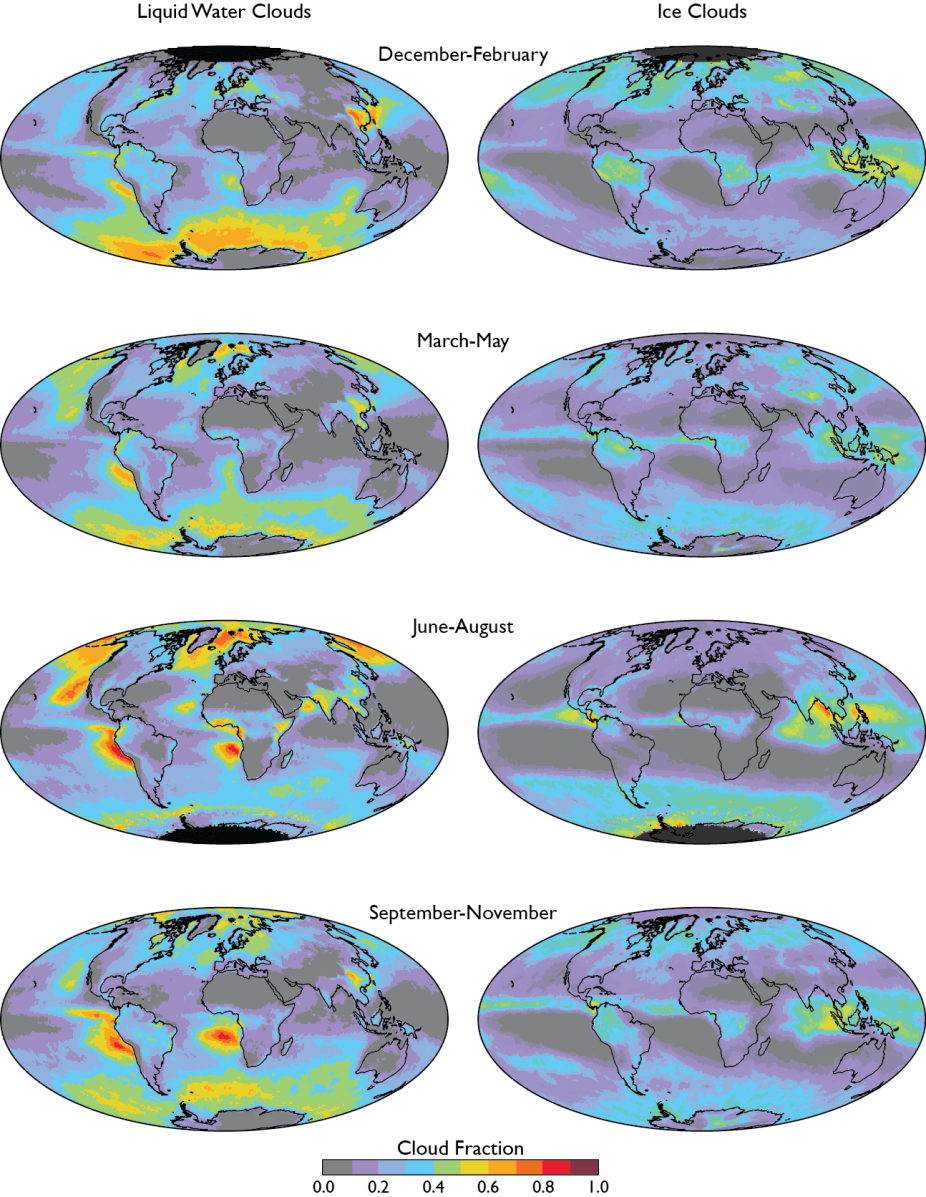
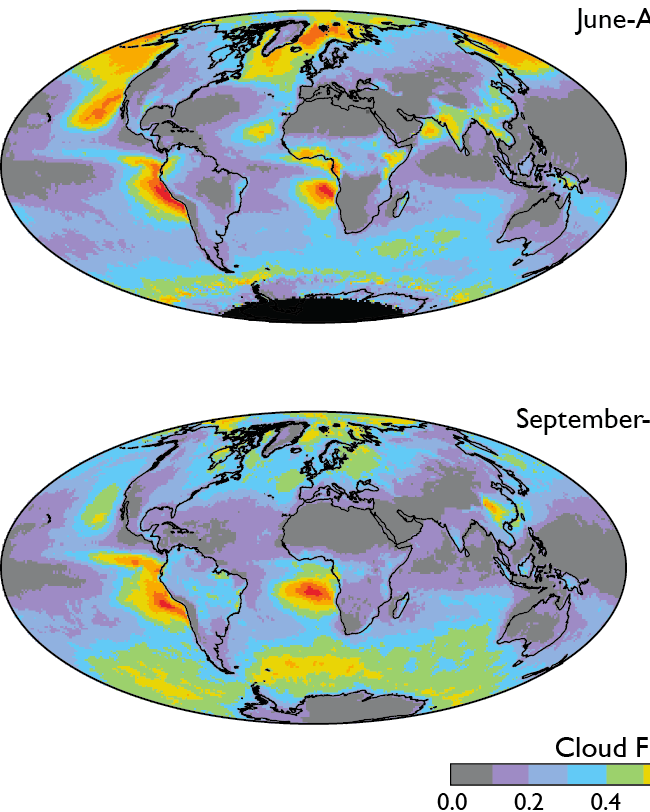
MODIS-cloud-fractions: Seasonal cycle of daytime-only liquid and ice cloud amount as observed by MODIS aboard Aqua (2002-2012). These figures show the fractional area for which optical properties are successfully retrieved and so omit pixels thought to be partly-cloudy as well as clouds of indeterminate phase. The sum is therefore less substantially less than other estimates including the MODIS cloud detection algorithm. After King et al. (2013). and contributed by M. King.
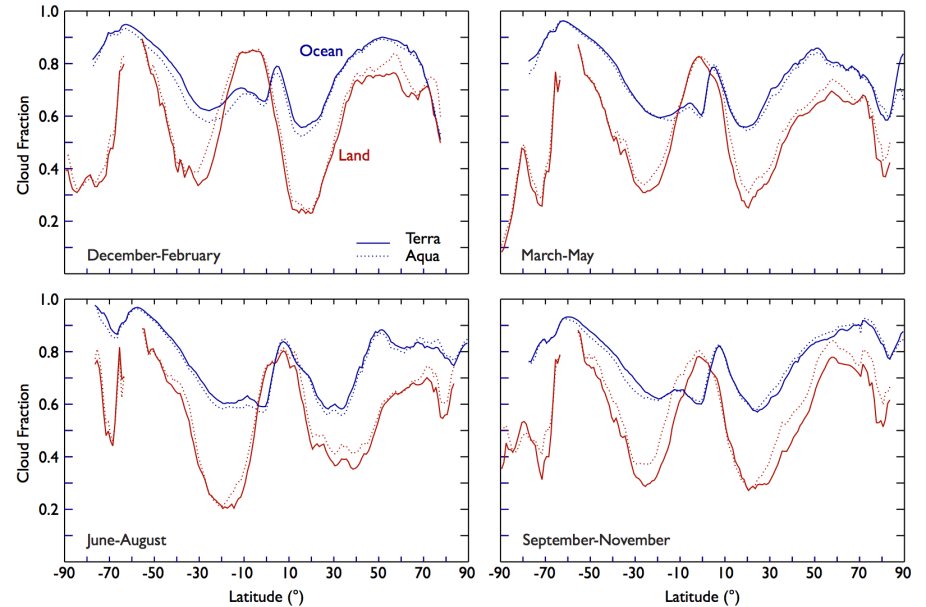
MODIS-zonal-cloud-fraction: Zonal mean daytime cloud fraction over land (red) and ocean (blue) from Terra (2000-2011) and Aqua (2002-2011) for (a) December-February, (b) March-May, (c) June-August, and (d) September-November. From King et al. (2013). Contributed by M. King
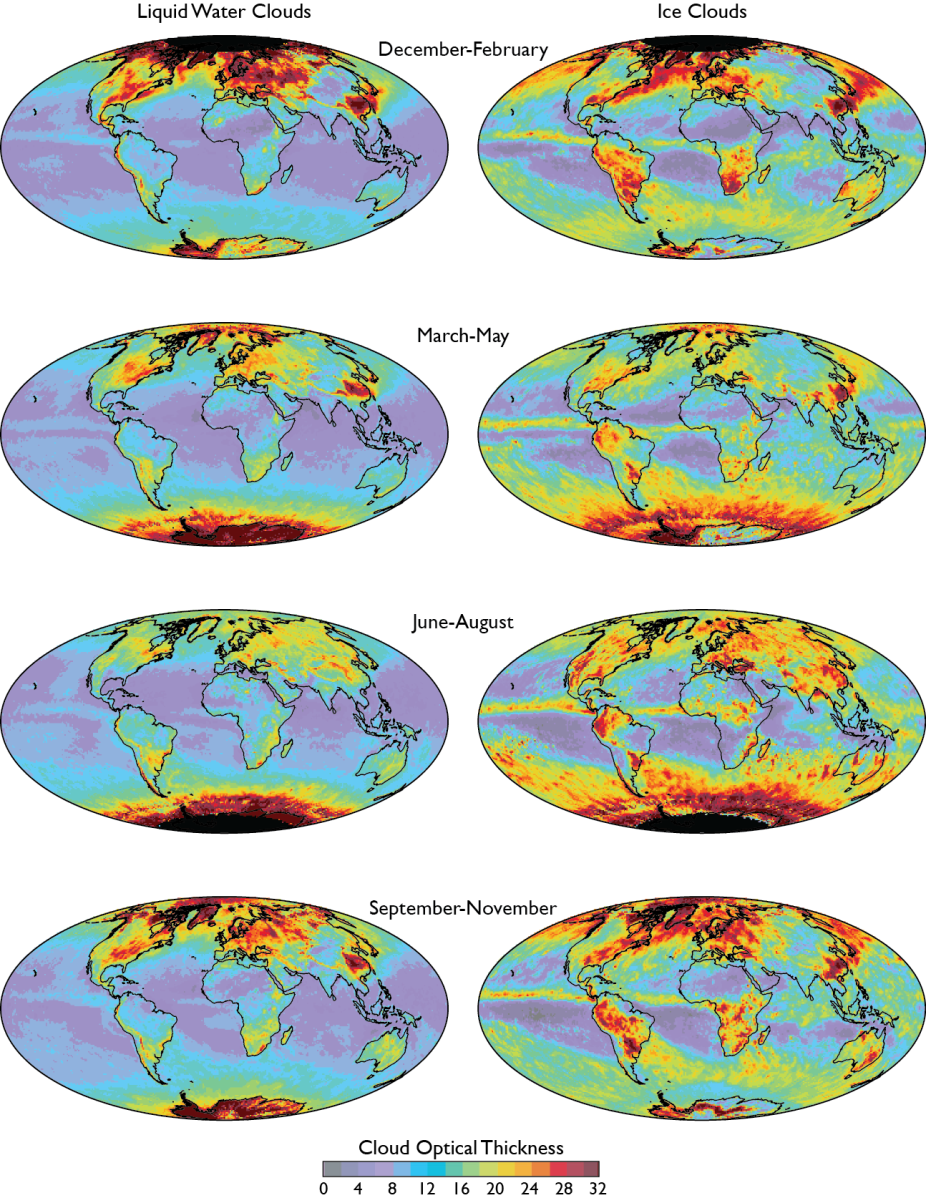
MODIS-LinearMean-Optical Thickness: Seasonal cycle of daytime-only liquid and ice cloud optical thickness as observed by MODIS aboard Aqua (2002-2012). Optical thickness is averaged linearly here and so gives a reasonable estimate of water mass but a poor estimate of the radiative effect of clouds for which the logarithmic mean (also available) is preferred. After King et al. (2013). and contributed by M. King.
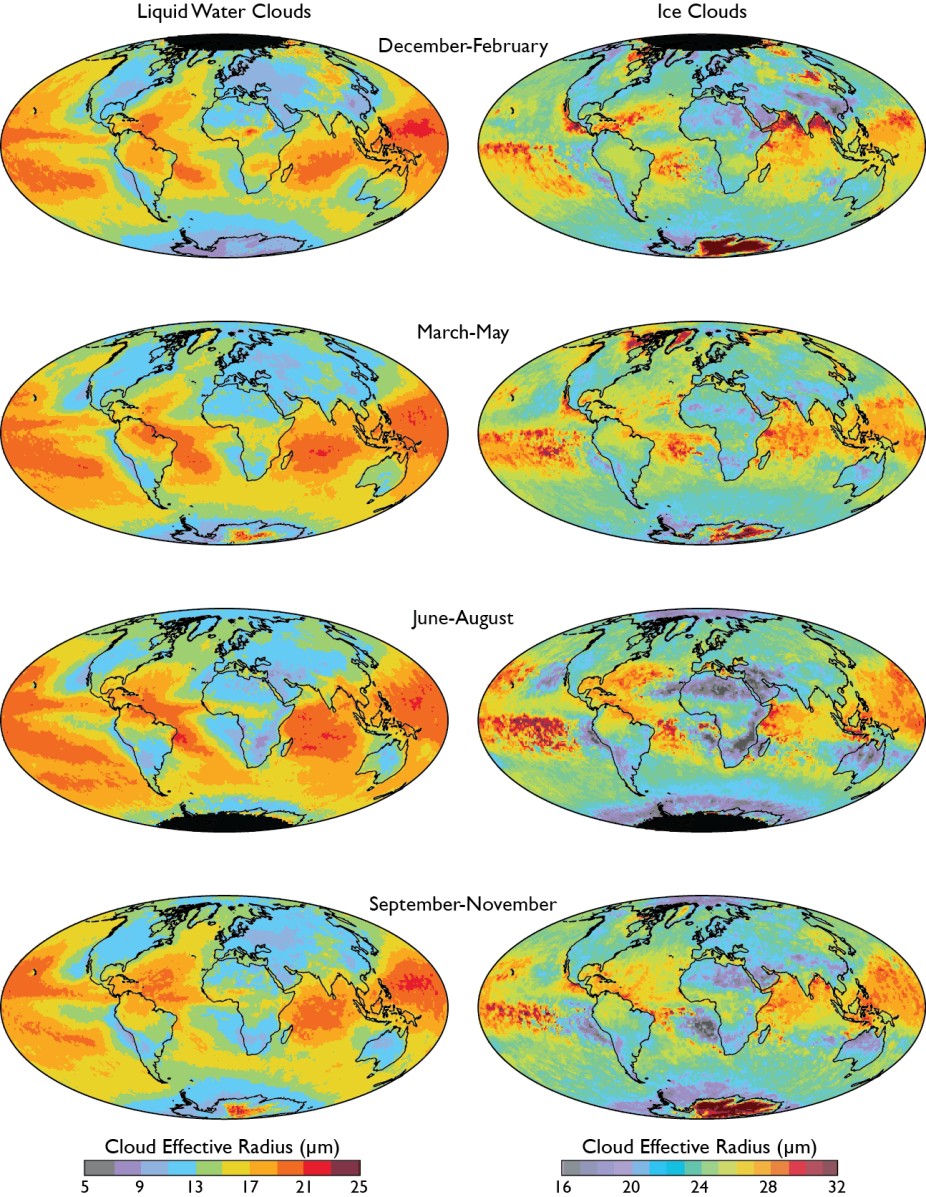
MODIS-Particle sizes: Seasonal cycle of daytime-only liquid and ice cloud effective radii as observed by MODIS aboard Aqua (2002-2012). These retrievals use the 2.1 micron band. Pixels thought to be partly-cloudy have been excluded but values, especially in low latitudes; this is thought to be related so small-scale cloud inhomogeneity in liquid clouds and to flawed radiative models for ice clouds. After King et al. (2013). and contributed by M. King.