ISCCP: International Satellite Cloud Climatology Project
The International Satellite Cloud Climatology Project (ISCCP) makes use of routine observations by operational weather satellites to provide a long-term (1983-2009), gridded, global record of cloud properties. ISCCP uses observations in the visible and infrared window portions of the spectrum to determine cloud optical thickness and cloud top temperature, from which the cloud top pressure is inferred. The major products include individual 3-hourly observations, monthly means for each 3-hour period of a day, and single monthly means calculated from the 3-hourly monthly means. A data set with single monthly means more suitable for comparison with observation simulator packages is also available.
The comments on this page generally refer to the "D" series of ISCCP data. A reprocessed "H" series version is available through NOAA-NCEI (See "get data") tab. Although the H Series could alleviate some of the systematic biases in the D series, that is not evaluated here. The H Series is offered at higher resolution (~10 km), in netCDF, and extended through 2015.
Key Strengths
Longest record of satellite-derived cloud properties available
Quantities retrieved are those that determine the planet’s radiation budget
Global coverage, resolved diurnal cycle
Key Limitations
Even long-term averages show systematic spatial patterns in cloud amount and cloud properties caused by relying on geostationary satellites
Internally-inconsistent retrievals are included in averages, so that total cloudiness and the amount of very high, optically thin clouds is overstated to an unknown degree.
Approximately 10% of the planet is covered with partly cloudy pixels and many of these are treated as fully cloudy in ISCCP data, complicating comparisons with models
Expert User Guidance
Editor's note: The comments here relate to the older "D" series of ISCCP data, not the "H" series.
#The following was contributed by Robert Pincus (University of Colorado), December, 2012:
The International Satellite Cloud Climatology Project (ISCCP; http://isccp.giss.nasa.gov) makes use of routine observations by operational weather satellites to provide a long-term, global record of cloud properties. ISCCP uses observations in the visible and infrared window portions of the spectrum to determine cloud optical thickness and cloud top temperature, from which the cloud top pressure is inferred. Observations are available globally every three hours.
ISCCP uses observations at two wavelengths, one in the visible and one in the infrared window in which the clear atmosphere is roughly transparent, to identify clouds and estimate the optical thickness and cloud top temperature, then matches that temperature to a profile to estimate the cloud top pressure. Optical thickness controls cloud reflectivity and cloud-top pressure controls clouds‘ impact on the outgoing longwave radiation, so these two measurements are enough to assess how clouds change the radiation budget of the atmosphere (i.e. to determine the cloud radiative effect). The uncertainty in individual retrievals is roughly 200 hPa in cloud top pressure and a factor of 3 in optical thickness. (Mace et al., 2011).
ISCCP currently distributes data in three formats: DX (pixel-level), D1 (three-hourly on a custom 2.5 degree equal-area grid), and D2 (gridded monthly means). A new H series of data with slightly revised algorithms and higher spatial resolution, is expected in 2013.
In the D1 and D2 data sets, the average cloud optical thickness reported for any domain is the value that reproduces the average cloud albedo, as opposed to the linear average. D1 and D2 data also include a joint histogram of cloud top pressure and optical thickness.
ISCCP was the first remote sensing dataset for which an “instrument simulator” was developed (Klein and Jakob, 1999). This diagnostic tool uses model-specific information to produce synthetic observations that are filtered to account for known biases and sensitivities in the retrieval process. Comparisons of model results to ISCCP observations are substantially less ambiguous when the ISCCP simulator is used.
As with all remote sensing datasets, ISCCP first identifies which pixels are cloudy and then determines the properties of cloudy pixels. ISCCP choses thresholds so that the resulting cloud amounts are in agreement with surface observers, among other observations (Rossow and Garder, 1993). Matching cloud amounts means that some partly-cloudy pixels are treated as fully cloudy, which can complicate comparison with models (see Pincus et al, 2012).
ISCCP attempts to find a cloud-top pressure that matches the apparent cloud-top temperature. In optically thin clouds this temperature is adjusted to account for cloud emissivity. For some clouds no appropriate temperature can be identified due to errors in determining optical thickness, errors in the assumed profile of temperature, or for some other reason. ISCCP assigns such pixels a pressure just above the tropopause. It is not possible to distinguish these observations from internally-consistent observations of very high, optically thin clouds.
ISCCP resolves the diurnal cycle of clouds using observations from geostationary satellites. Clouds are more easily detectable during the day, when visible wavelength observations are available, than during night when only infrared observations are available. ISCCP adjusts night-time values of cloud amount in the D1 and D2 data to account for this. In addition, because cloud detection becomes easier but cloud retrievals harder as the viewing angle increases, the heavy reliance on geostationary data leads to systematic spatial variations, centered on long-term sub-satellite locations, in cloud amounts and optical thickness.
ISCCP exploits measurements made by operational weather satellites. These instruments are not calibrated and the available constellation has changed over time, both of which have introduced small, spurious trends into the data set (Klein and Hartmann, 1993; Evan et al., 2007).
ISCCP cloud property estimates are roughly comparable with those produced by MODIS and MISR (though see Pincus et al., 2012 and Marchand et al., 2010 below for some important caveats). The ISCCP record is longer than either of these and resolves the diurnal cycle of cloudiness. Because ISCCP relies on observations at just two wavelengths, however, the estimate of cloud thermodynamic phases is simple and no information about particle size is available to refine the optical thickness estimate.##
Cite this page
Acknowledgement of any material taken from or knowledge gained from this page is appreciated:
Pincus, Robert & National Center for Atmospheric Research Staff (Eds). Last modified "The Climate Data Guide: ISCCP: International Satellite Cloud Climatology Project.” Retrieved from https://climatedataguide.ucar.edu/climate-data/isccp-international-satellite-cloud-climatology-project on 2026-07-22.
Citation of datasets is separate and should be done according to the data providers' instructions. If known to us, data citation instructions are given in the Data Access section, above.
Acknowledgement of the Climate Data Guide project is also appreciated:
Schneider, D. P., C. Deser, J. Fasullo, and K. E. Trenberth, 2013: Climate Data Guide Spurs Discovery and Understanding. Eos Trans. AGU, 94, 121–122, https://doi.org/10.1002/2013eo130001
Key Figures
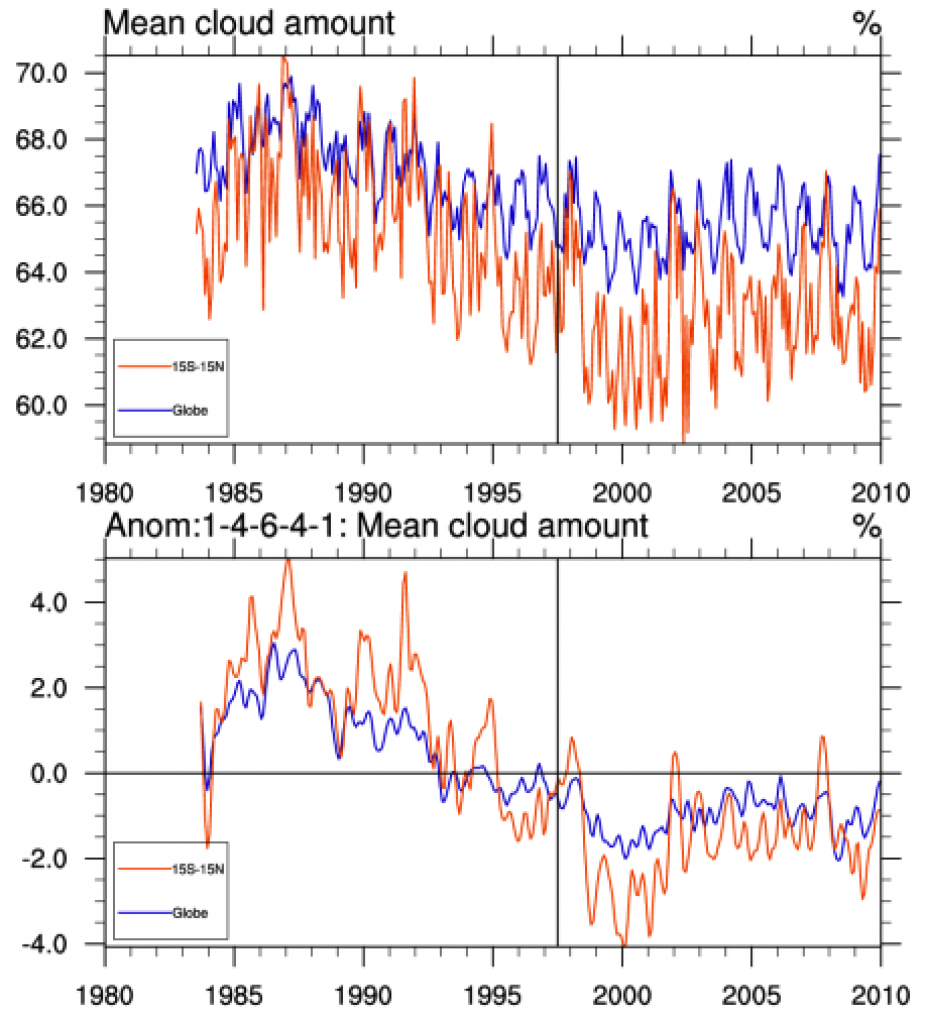
ISCCP derived mean cloud amount (%) for the globe (blue) and 15S-15N (red). Top: actual amount; Bottom: anomalies relative to the climatology. About mid-1997, a change in the satellite mixture possibly affected this quantity. See also Evan et al (2007). [Climate Data Guide; D. Shea]
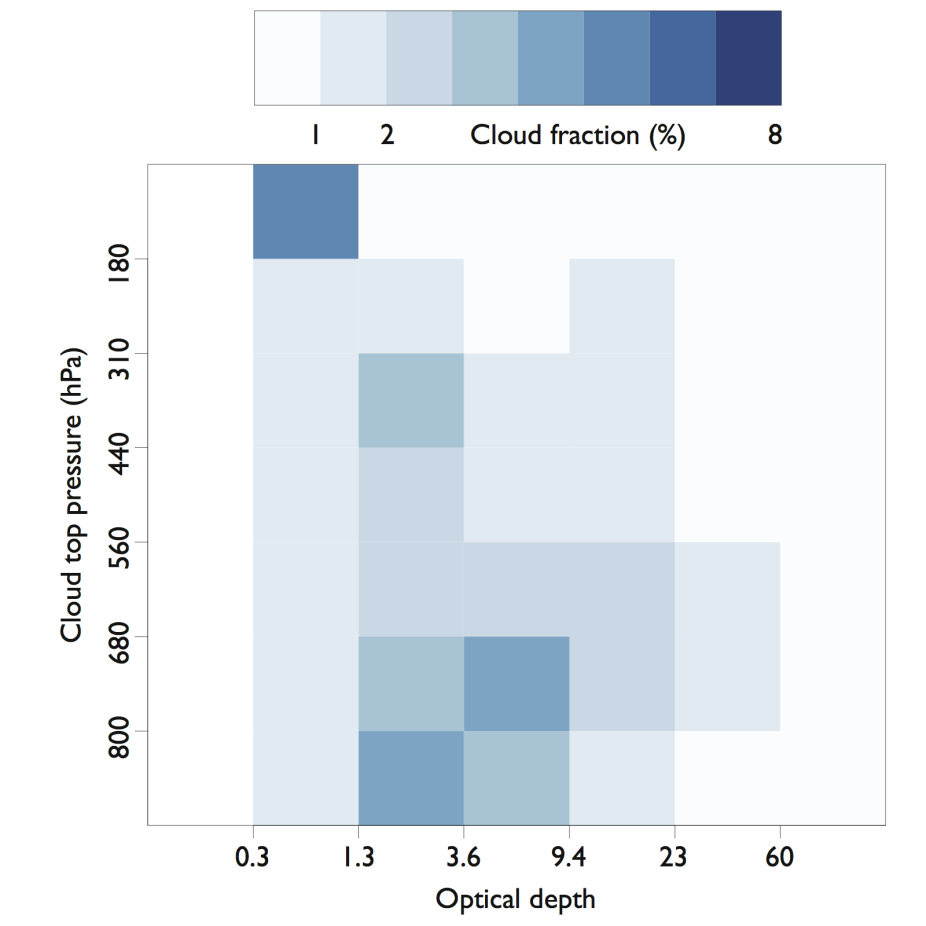
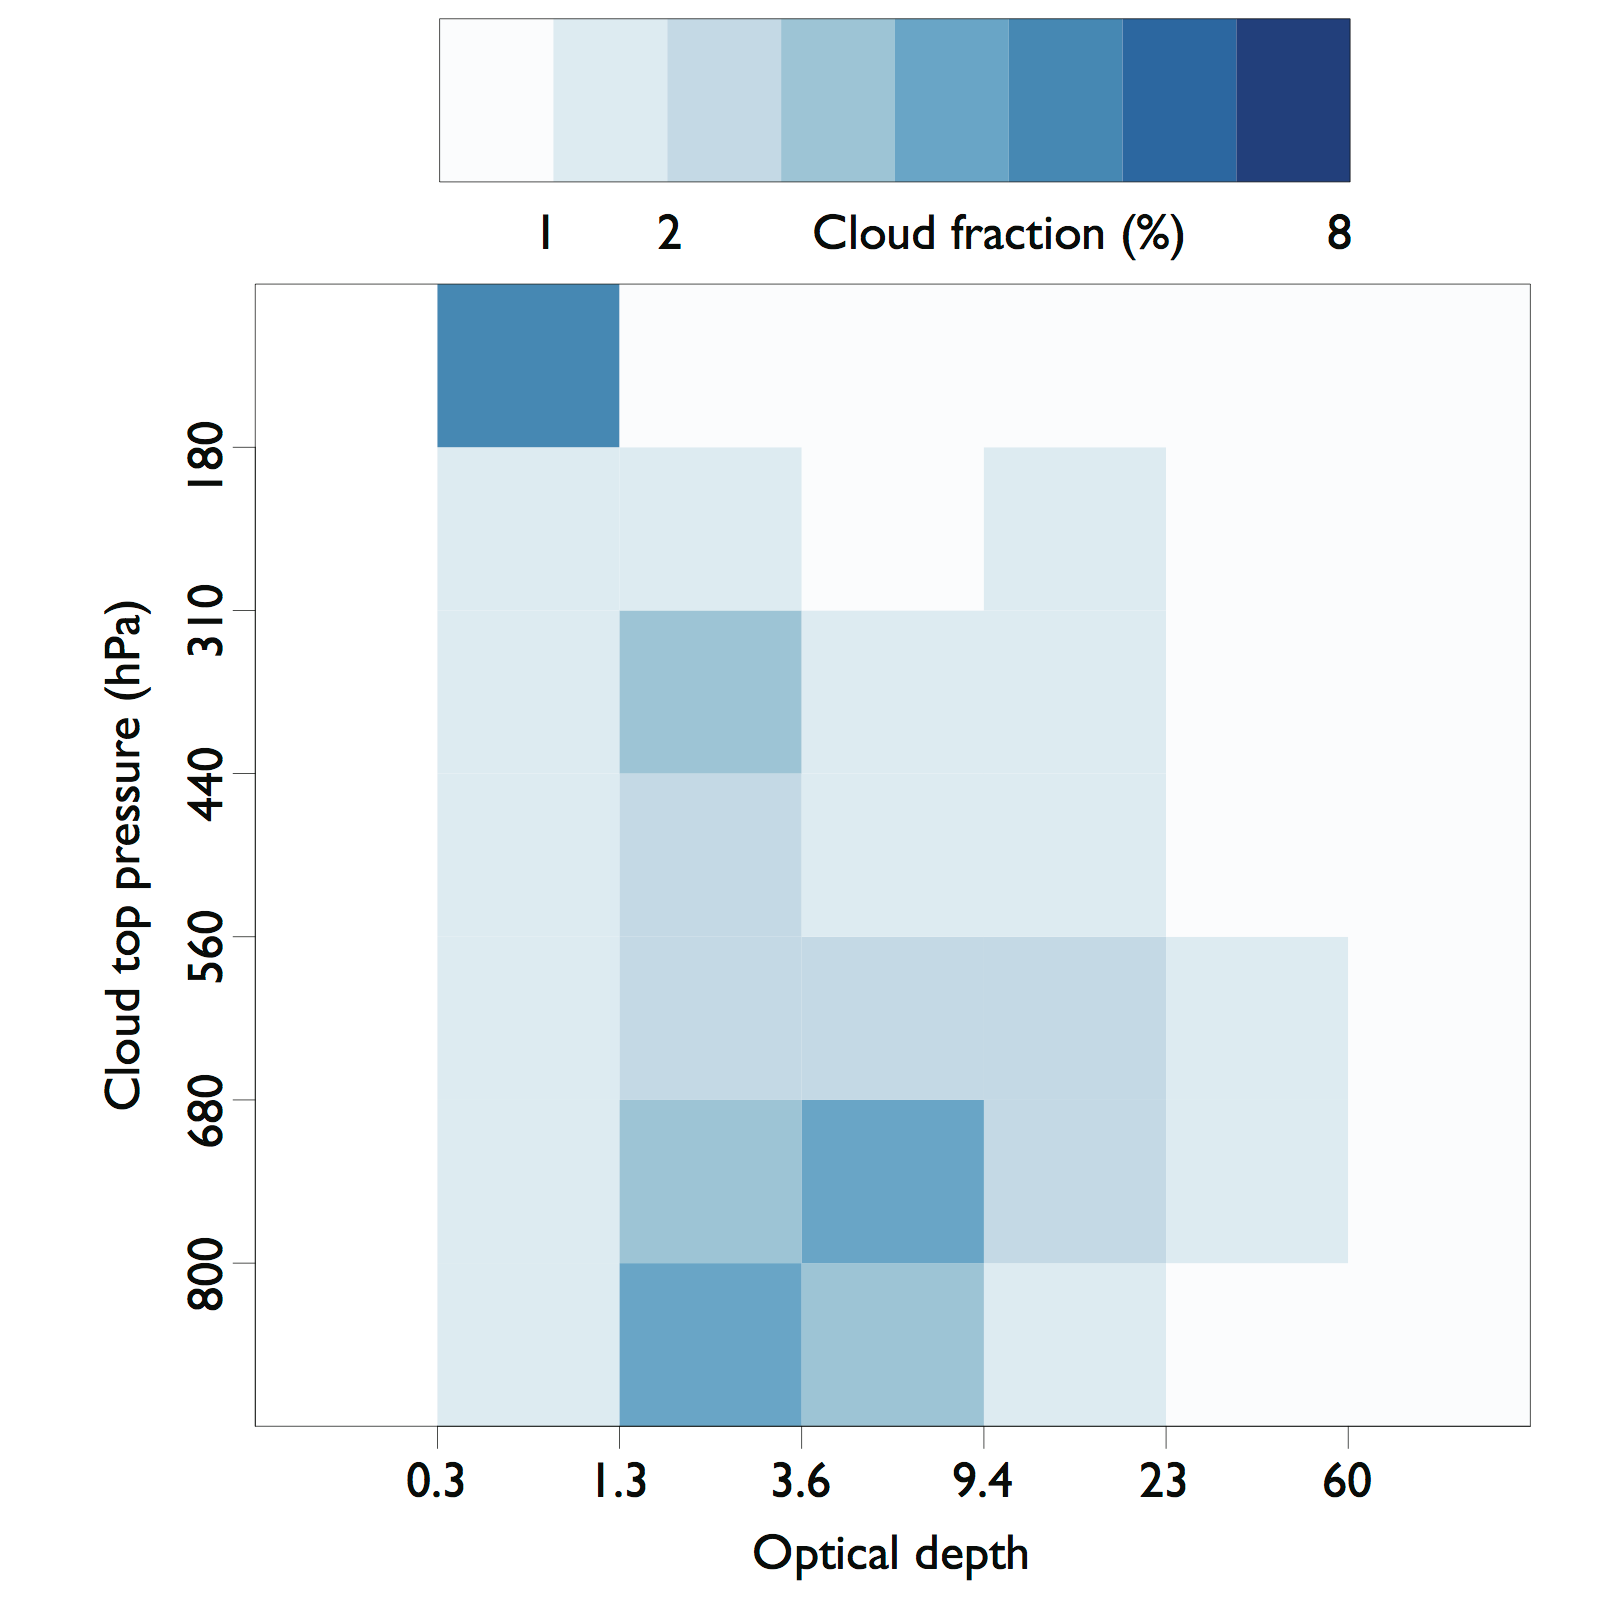
SCCP-Joint-Histogram: Global-mean joint histogram of cloud optical thickness and cloud-top pressure as observed by ISCCP. Retrievals for which a self-consistent pair of values can't be determined are assigned the lowest possible cloud top pressure, so the upper-left bin (lowest cloud top pressure, lowest optical thickness) also contains some failed retrievals. From Pincus et al., 2012. Contributed by R. Pincus.
Other Information
- Rossow, WB and RA Schiffer, 1999: Advances in understanding clouds from ISCCP. Bull. Amer. Met. Soc., 80, 2261-2287. doi: 10.1175/1520-0477(1999)0802.0.CO;2
- Mace, Gerald G., Stephanie Houser, Sally Benson, Stephen A. Klein, Qilong Min, 2011: Critical Evaluation of the ISCCP Simulator Using Ground-Based Remote Sensing Data. J. Climate, 24, 1598–1612.
- Klein, SA and C Jakob, 1999: Validation and sensitivities of frontal clouds simulated by the ECWMF model. Mon. Wea. Rev., 127, 2514-2531. doi: 10.1175/1520-0493(1999)1272.0.CO;2.
- Rossow, William B., Leonid C. Garder, 1993: Validation of ISCCP Cloud Detections. J. Climate, 6, 2370–2393.
- Pincus, R, S Platnick, SA Ackerman, RS Hemler, and RJP Hofmann, 2012: Reconciling simulated and observed views of clouds: MODIS, ISCCP, and the limits of instrument simulators. J. Climate, 25, 4699-4720. doi:10.1175/JCLI-D-11-00267.1.
- Klein, S. A. and D. L. Hartmann (1993), Spurious changes in the ISCCP dataset, Geophys. Res. Lett., 20(6), 455–458, doi:10.1029/93GL00211
- Evan, A. T., A. K. Heidinger, and D. J. Vimont (2007), Arguments against a physical long-term trend in global ISCCP cloud amounts, Geophys. Res. Lett., 34, L04701, doi:10.1029/2006GL028083.
- Marchand, R, TP Ackerman, M Smyth, and WB Rossow, 2010: A review of cloud top height and optical depth histograms from MISR, MODIS, and ISCCP. J. Geophys. Res., 115, D16206. doi:10.1029/2009JD013422.
- Dai, A., T. R. Karl, B. Sun, and K. E. Trenberth, 2006: Recent trends in cloudiness over the United States: A tale of monitoring inadequacies. Bull. Amer. Meteor. Soc., 87, 597-606.
- Stubenrauch, C., W. Rossow and S. Kinne (2012), Assessment of Global Cloud Data Sets from Satellites, A Project of the World Climate Research Programme Global Energy and Water Cycle Experiment Radiation Panel, WCRP Report No. 23/2012, 176 pp (.pdf).
- Mayer, Michael, Leopold Haimberger, 2012: Poleward Atmospheric Energy Transports and Their Variability as Evaluated from ECMWF Reanalysis Data. J. Climate, 25, 734–752.