Drought atlases from tree rings
Tree-ring drought atlases provide a paleoclimate analog to modern drought indices, most commonly the Palmer Drought Severity Index (PDSI). Produced on a regular lat-lon grid for regions such as North America, Europe, and Australia, these centuries-long datasets are convenient for comparisons with climate model experiments and historical data on human populations and ecosystems. The target variable for drought atlases, the PDSI, is typically averaged over the summer months when trees are actively growing. As such, the current generation of drought atlases are not well suited for studies of cool-season hydroclimate except in areas where cool-season precipitation dominates. The statistical reconstruction method provides detailed maps of reconstruction quality in the form of calibration and validation statistics. These should be consulted for skill at the grid point level before use. Regional averages are often better than the skill indicated for the individual grid point reconstructions. Tree-ring drought atlases are perhaps best known for the discovery of large-scale, medieval megadroughts.
Key Strengths
Key Limitations
All of the drought atlases produced to date are publically available for download at NOAA’s National Centers for Environmental Information (NCEI; https://www.ncdc.noaa.gov/paleo-search/). Under “Data Type” on this webpage, click on “Climate Reconstructions”, and then enter in the “General Search” box the name of the drought atlas you want, e.g. NADA, OWDA, etc. If you search for NADA you will get hits for both NADAv2a (Cook et al., 2007) and LBDA (Cook et al., 2010a). The main differences between the NADAv2a and the LBDA are resolution (2.5x2.5° for NADAv2 and 0.5x0.5° for LBDA) and spatial coverage (North America only up to 63°N for NADAv2a and all of North America including Alaska for LBDA). All of the drought atlases from NCEI are downloadable as ASCII-text files and netCDF files.
Expert User Guidance
The following was contributed by Dr. Edward R. Cook at Lamont-Doherty Earth Observatory, March, 2017:
Tree-ring reconstructed drought atlases covering much of the Earth’s continents have fundamentally altered our understanding of hydroclimatic variability around the world. These drought atlases include the North American Drought Atlas (NADA; Cook et al., 2004, 2007, 2010a), the Monsoon Asia Drought Atlas (MADA; Cook et al., 2010b), the Old World Drought Atlas (OWDA; Cook et al., 2015), the Australia/New Zealand Drought Atlas (ANZDA; Palmer et al., 2015), and the Mexican Drought Atlas (MXDA; Stahle et al., 2016). They are all based on annually-resolved and exactly dated tree-ring reconstructions of the boreal or austral summer Palmer Drought Severity Index (PDSI) on a regular grid (e.g., Figure 1), thus producing annual maps of hydroclimatic variability that extend back centuries to a millennium or more in the past. These drought atlases have been used extensively by a diverse range of scientific disciplines, ranging from climate modeling studies (e.g., Seager et al., 2008) to the collapse of past civilizations (e.g., Benson et al., 2009). See Cook et al. (2007) for a general review. The discovery of large-scale medieval megadroughts of unprecedented duration over the Northern Hemisphere is perhaps what the drought atlases are best known for.
The array of drought atlases produced thus far are all based on the same basic reconstruction method called ‘Point-by-Point Regression’ or PPR (Cook et al., 1999). The user is requested to read this paper to understand the basis of PPR and why it was developed as the method of choice for developing the drought atlases. Later drought atlases (e.g., the MADA and OWDA) are based on an expanded ensemble version of PPR, but the underlying method remains the same. Please read Cook et al. (2010b, 2015) for descriptions of this ensemble method. Among the commonly reported statistics for all of the drought atlases produced thus far are maps of PPR calibration and validation statistics that express the level of statistical quality or skill of each grid point reconstruction. These can be found in the primary drought atlas references provided here (e.g., Figure 2). It is highly recommended that use of the drought atlases at the grid point level be based in part on the estimated statistical quality of the reconstruction provided because not all areas of the grid will be reconstructed equally well. However, experience has shown that the regional patterns of reconstructed hydroclimatic variability are frequently better in quality than the individual grid point validation statistics indicate. It is also the case that the skill of the grid point reconstructions may be artificially compromised by the declining quality of the instrumental-based gridded PDSI target field used. See Cook et al. (2010b) for an example of this problem, which seriously confronted the development of the MADA. For this reason, the drought atlases have also been compared to known historical droughts (and one pluvial) prior to the instrumental data period to further validate them. The results of those additional validation tests have in general been excellent.
Even so, the user should always exercise care when using the drought atlases for specific interpretative purposes. Contact me by email (drdendro@ldeo.columbia.edu) if there are any questions.##
Cite this page
Acknowledgement of any material taken from or knowledge gained from this page is appreciated:
Cook, Edward & National Center for Atmospheric Research Staff (Eds). Last modified "The Climate Data Guide: Drought atlases from tree rings.” Retrieved from https://climatedataguide.ucar.edu/climate-data/drought-atlases-tree-rings on 2026-02-11.
Citation of datasets is separate and should be done according to the data providers' instructions. If known to us, data citation instructions are given in the Data Access section, above.
Acknowledgement of the Climate Data Guide project is also appreciated:
Schneider, D. P., C. Deser, J. Fasullo, and K. E. Trenberth, 2013: Climate Data Guide Spurs Discovery and Understanding. Eos Trans. AGU, 94, 121–122, https://doi.org/10.1002/2013eo130001
Key Figures
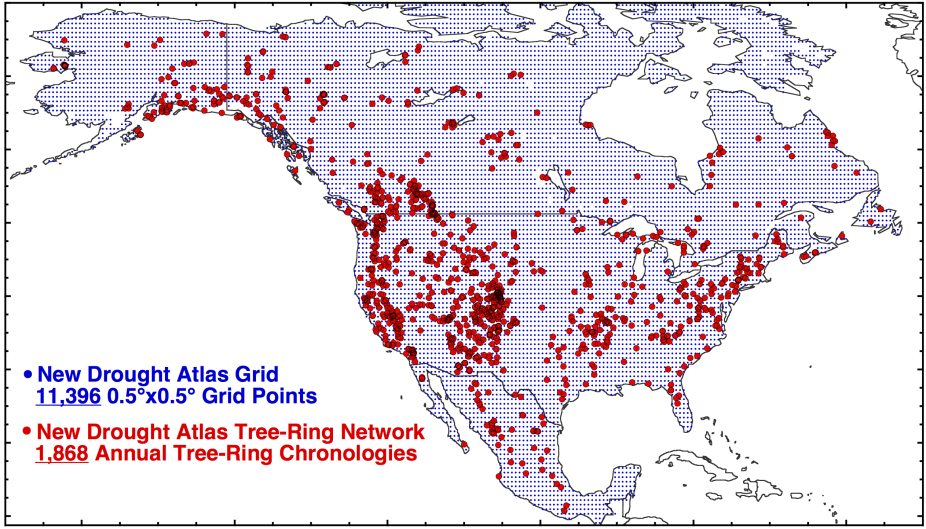
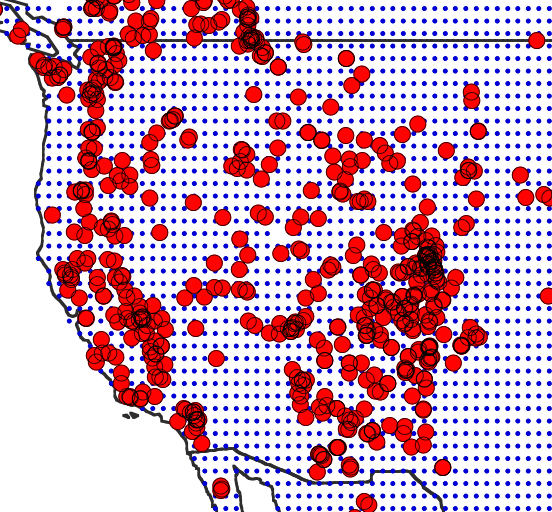
Figure 1. An example tree-ring drought atlas: the North American Drought Atlas (a.k.a. Living-Blended Drought Atlas) (Cook et al., 2010a) showing the reconstruction domain with 11,396 regularly spaced 0.5°x0.5° grid points of PDSI in blue and the irregularly spaced network of 1,845 tree-ring chronologies used for reconstruction. The PPR method allows for the efficient reconstruction of this PDSI domain. (provided by Ed Cook)
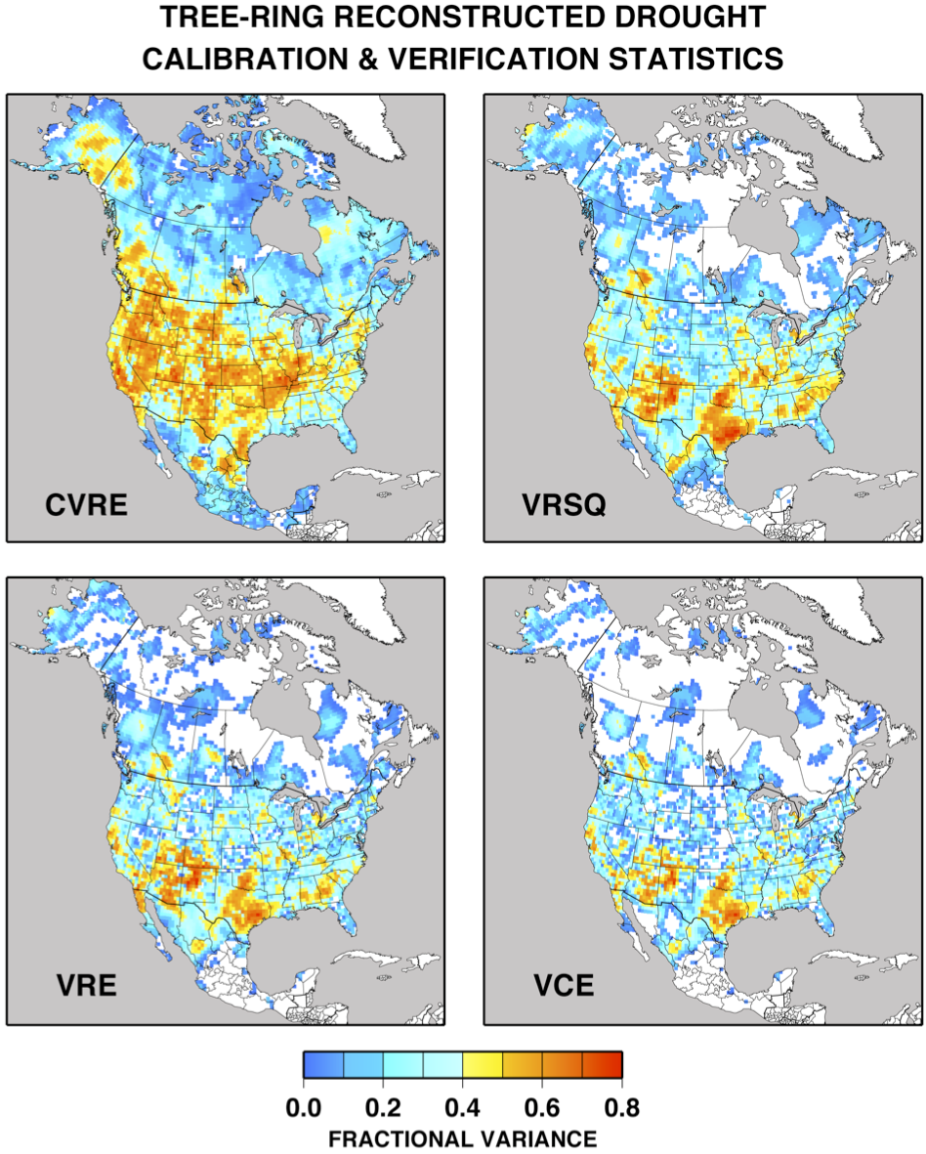
Figure 2. Calibration period (CVRE) and validation period (VRSQ, VRE, and VCE) mapped statistics for the LBDA reconstructions. See Cook et al. (2010a) for a description of these particular statistics and their interpretation. (provided by Ed Cook)